23167 NW 180th Pl · High Springs, FL
Flood risk 1/10 · Minimal
- FEMA flood zone
- X (unshaded)
- Chance of flooding over 30 yrs
- 0.0%
- Est. flood insurance / yr
- $507 – $1,088
Fire risk 4/10 · Minor
- Est. fire insurance / yr
- $947 – $1,759
Heat risk 8/10 · Major
- Hot days now (above 109°F)
- 7 days/yr
- Hot days in 30 yrs
- 21 days/yr
Wind risk 9/10 · Severe
- Chance of severe wind over 30 yrs
- 99.0%
Air-quality risk 4/10 · Minor
- Unhealthy air days now
- 4 days/yr
- Unhealthy air days in 30 yrs
- 5 days/yr
Risk factors via First Street. Map © Google.
Why this score? — see what drove the C- grade
The composite is a weighted blend of 9 inputs, each scored 0–100. Each bar is that input's sub-score; the figure is the points it added to the 100-point composite (weight × sub-score).
- Cash flow +19.2/30.0
- ARV discount +7.5/15.0
- DSCR +6.1/10.0
- 1% rule +4.7/10.0
- Schools +4.3/10.0
- Livability +3.4/5.0
- Rent growth +2.5/5.0
- Condition / age +2.5/5.0
- Appreciation +0.0/10.0
$244,900
🖨 Deal sheet (PDF) 📄 Offer letter ✓ Due diligence
Listing remarks MLS
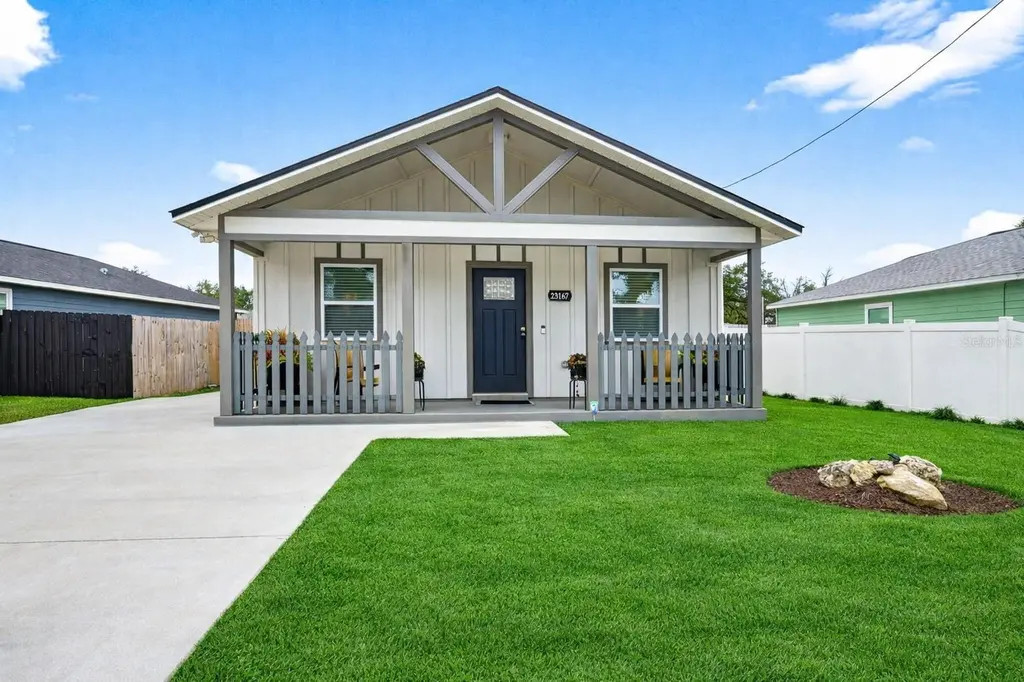
Built in 2023, this well-kept, like-new home offers modern finishes, efficient design, and easy living - all at an incredible price. The open layout flows comfortably from living to dining, with granite tops, stainless steel appliances, soft-closing cabinets, luxury vinyl plank floors and natural light throughout. Step outside to a FULLY FENCED YARD —ideal for pets, play, or private outdoor time - plus a storage shed - with electrical - for tools, bikes, or extra gear. The concrete driveway and low-maintenance exterior add everyday convenience. Located just minutes from local parks, playgrounds, and world-famous freshwater springs, with quick access to shopping, dining, and downtown High Springs. A great option for anyone seeking a newer home with outdoor space and a central location.
Key facts
- Storage shed
- Fully fenced yard
- Concrete driveway
Tags
Neighborhood map
What this means for you Summary
Snapshot
- This is a 3-bed/2.0-bath single-family listed at $245k.
Deal economics
- At list price, monthly cash flow is $264 ($3k/yr) — positive.
- The deal already cash-flows at list — no discount required.
- To meet the 1% rule (rent ≥ 1% of price), the offer needs to be $239k (2.5% below list).
- Recommended offer: $216k (12.0% below list) — sets the bar for market timing.
- Cap rate 7.6% vs local median 4.0% in High Springs — top-decile yield for the area; either an underpriced asset or a hidden risk that comps aren't pricing in. Stress-test before assuming the spread holds.
Location & tenants
- Location reads 68/100 on livability (#506 in FL) — a middle-class / working-renter tenant base. Strengths: cost of living A+, housing A+, crime B+; Watch: health & safety D, amenities F, commute F.
- Alachua (urban): math 49% / reading 54% proficiency, ranked #30 of 73 in FL (top 41%) — acceptable for families but not a draw, mixed tenant base, ~2y average lease.
- Market conditions: 189 active listings in the ZIP; 3 comparable units currently listed for rent nearby; rentals at typical pace (median 22d on market — plan ~3-4 weeks tenant-placement turnaround); solid renter incomes; 1,774 units permitted in Alachua County in 2024 (984 in 5+ unit buildings).
- This rent runs 34% of the median local income ($83k/yr) — at the standard rent-burdened threshold; future hikes will face affordability resistance.
Forward outlook
- Local home prices are declining (-3.0%/yr); year-one equity from $2k of loan paydown is wiped out by about $7k of value loss. Plan a longer hold.
- Alachua County population projected at +26% by 2050 — long-run rental-demand tailwind backs the buy-and-hold thesis.
Negotiation context
- It's been on market 135 days — a 12% lower offer ($216k) is reasonable based on typical stale-listing flexibility.
- 2 sale attempts with the ask held roughly flat each time — persistent listings suggest the price (not the market) is what's stuck; bring a comps-based counter.
Risks & watch-outs
- Climate carrying-cost: severe wind risk, 99% chance of damaging wind over 30y; extreme-heat days projected 7→21/yr by 2055 (HVAC capex compounding) — expect insurance premiums to compound above CPI over the hold.
Questions for the listing agent
- It's been on market 135 days. Have you received any prior offers? Is the seller open to a 12% concession, seller financing, or rate buy-down credit?
- Why hasn't it sold? Are there any deal-killer items the seller is aware of (foundation, flood, title, zoning, code violations)?
- Is there a deadline driving the sale (1031 exchange, divorce, estate, relocation)? That informs how much negotiation room exists.
- Schools are B-rated — typically a magnet for longer-tenancy family renters. What's the average tenant stay here, and is there a school-zone premium baked into asking?
- What's the average days-on-market for RENTAL listings here right now (not sales)? A rising rental-DOM trend means longer vacancies and softer asking-rent achievability than the comps imply.
- What's the recent tenant-quality profile in this submarket — average credit score on applications, eviction rate, late-payment / NSF rate, and stable-employment percentage? A property-management company in the area should have these aggregated.
- How much new for-sale + rental construction is in the pipeline within 1–3 miles? Heavy new supply typically softens prices + rents 12–24 months out; constrained supply supports both.
Investment metrics
- 1% rule
- 0.97% ✗
- Cap rate
- 7.59%
- Cash-on-cash
- 4.63%
- DSCR
- 1.21
- GRM
- 8.6
CMA / ARV
No comps found within radius.
Projected returns pro-forma
-3.0% appreciation · 3.0% rent growth · sell at horizon
- IRR
- -9.1%
- Equity multiple
- 0.67×
- Total profit
- $-22,849
- Equity at exit
- $36,515
- IRR
- 0.4%
- Equity multiple
- 1.03×
- Total profit
- $1,760
- Equity at exit
- $21,174
Cash invested: $68,572 (down + closing). Projections, not guarantees.
Landlord ↔ Tenant lean methodology
- Overall (STATE)
- 87 Strongly Landlord-Friendly
- State Florida
- 87 Strongly Landlord-Friendly · R+3
- County
- — inherits STATE
- City
- — inherits STATE
ZIP-level market 32643
- Home prices YoY
- -5.5%
- Active inventory
- 189
- Price-to-rent
- 8.6×
Monthly cashflow live
- Estimated rent
- $2,387 medium interval (Pro) →
- Mortgage (P&I)
- −$1,284
- Tax from tax record
- −$235 /mo · $2,819/yr
- Insurance
- −$102
- HOA
- −$0
- Vacancy / Maint / Mgmt
- −$501
- Net cashflow
- $264
Break-even live
Sensitivity live
| Price | -10% $403 | -5% $334 | +0% $264 | +5% $195 | +10% $126 |
|---|---|---|---|---|---|
| Rent | -10% $76 | -5% $170 | +0% $264 | +5% $359 | +10% $453 |
| Rate | -1.0pp $388 | -0.5pp $327 | base $264 | +0.5pp $201 | +1.0pp $136 |
UW: 25.0% down · 7.5% · 30yr · 1.5% tax · 5.0% vac · 8.0% maint · 8.0% mgmt
Financing live
Cash to close
- Down payment
- $61,225
- Closing costs
- $7,347
- Reserves months
- —
- Total cash needed
- —
Loan-product check · same deal, 3 products live
Conventional
25% down · 7.5% · 30yr
- Down + closing
- —
- Monthly P&I
- —
- Monthly cashflow
- —
- DSCR
- —
- Eligible?
- —
Personal DTI + credit; lowest rate.
DSCR
20% down · 8.5% · 30yr
- Down + closing
- —
- Monthly P&I
- —
- Monthly cashflow
- —
- DSCR
- —
- Eligible?
- —
No personal income docs; deal must DSCR.
Hard money
10% down · 12.0% · 12mo
- Down + closing
- —
- Monthly P&I
- —
- Monthly cashflow
- —
- DSCR
- —
- Eligible?
- —
Short-term bridge; refi at stabilization.
Rent comps 3 comps
| Address | Beds | Baths | Sqft | Rent | $/sqft | DOM | Units | Dist |
|---|---|---|---|---|---|---|---|---|
| 18160 High Springs Main St Unit 1359107P High Springs, FL | 2.0 | 1.0 | 990 | $2,646 | $2.67 | 21d | 1 | 0.73mi |
| 17451 Southside Ct High Springs, FL | 2.0 | 1.0 | 1132 | $1,800 | $1.59 | 21d | 1 | 0.82mi |
| 25042 W US Highway 27 High Springs, FL | 3.0 | 1.0 | 864 | $1,500 | $1.74 | 21d | 1 | 1.49mi |
Listing history 17 events
-
2026-06-13status $244,900 Pending 135 DOM
-
2026-06-10days on market $244,900 Active 135 DOM
-
2026-06-09days on market $244,900 Active 134 DOM
-
2026-06-08days on market $244,900 Active 133 DOM
-
2026-06-07days on market $244,900 Active 132 DOM
-
2026-06-05days on market $244,900 Active 129 DOM
-
2026-06-03days on market $244,900 Active 128 DOM
-
2026-06-02days on market $244,900 Active 127 DOM
-
2026-06-01days on market $244,900 Active 126 DOM
-
2026-05-31days on market $244,900 Active 125 DOM
-
2026-05-30days on market $244,900 Active 124 DOM
-
2026-01-26$244,900 Active 801-char remark
Show marketing remark (801 chars)
Built in 2023, this well-kept, like-new home offers modern finishes, efficient design, and easy living - all at an incredible price. The open layout flows comfortably from living to dining, with granite tops, stainless steel appliances, soft-closing cabinets, luxury vinyl plank floors and natural light throughout. Step outside to a FULLY FENCED YARD —ideal for pets, play, or private outdoor time - plus a storage shed - with electrical - for tools, bikes, or extra gear. The concrete driveway and low-maintenance exterior add everyday convenience. Located just minutes from local parks, playgrounds, and world-famous freshwater springs, with quick access to shopping, dining, and downtown High Springs. A great option for anyone seeking a newer home with outdoor space and a central location.
-
2025-07-15historical
-
2025-06-04$250,000 Active
-
2023-11-01soldstatus $240,000
-
2022-05-20soldstatus $24,600
-
2007-02-13soldstatus $12,000
ⓘ Source: listings_history table (triggers on properties + properties_extension) + one-shot
backfill from property_details.listing_events for pre-trigger history.
Tax reassessment forecast FL · Resets to sale price
- Current annual tax
- $2,819 · $235/mo
- Projected year-2 tax
- $2,819 · $235/mo
- Expected delta
- $0/yr ($0/mo · 0.0%)
ⓘ Screening estimate from a state-policy table — verify with the county assessor before closing.
Climate risk First Street
- Flood 1/10 Low FEMA zone X (unshaded) · 0% chance over 30 yrs
- Wildfire 4/10 Moderate
- Heat 8/10 Severe 7 d/yr ≥109°F today · 21 d/yr by 30 yrs out
- Wind 9/10 Extreme 99% chance of damaging wind over 30 yrs
- Air quality 4/10 Moderate 4 unhealthy d/yr today · 5 by 30 yrs out
Nearby sold comps map
Loading sold comps map…
Walkable amenities ~0.75 mi
Loading nearby amenities…
Taxation est. · year 1
- Rental income
- $28,643
- − Mortgage interest
- −$13,718
- − Property taxes
- −$2,819
- − Insurance
- −$1,224
- − Repairs & maintenance
- −$2,291
- − Management
- −$2,291
- − Depreciation
- −$7,124
- Taxable loss
- −$826
- Est. tax savings @ 24.0%
- +$198
- After-tax cash flow
- $3,372/yr
For passive investors: Depreciation is non-cash, so a rental often shows a tax loss while cash-flowing — sheltering income. Rental losses are passive: they offset passive income freely, and up to $25,000/yr can offset ordinary (W-2) income if you actively participate and your MAGI is under $100k (phasing out to $0 by $150k); unused losses carry forward. On sale, claimed depreciation is recaptured at up to 25%, and gains may owe capital-gains tax (a 1031 exchange can defer both). Figures are a year-1 estimate at your 24.0% rate — not tax advice; consult a CPA.
Schools (NCES district)
- District
- Alachua
- NCES district ID
- 1200030
- Math proficiency
- 49% ▼ -9.00%
- Reading proficiency
- 54% ▼ -3.00%
- Median HH income
- $42,683
- Composite
- 43.31/100
- National rank
- #3038
- State rank
- #30 of 73 in FL
Livability — High Springs
- Score
- 68/100
- State rank
- #506
- US rank
- #9346
Category grades
Schools grade is shown separately in the Schools card above.
Census & demographics
- Census place
- High Springs, FL
- County
- Alachua County · 218,005 people
- City population
- 11,953
- Metro
- Gainesville, FL
- Population (ZIP)
- 11,953
- Household income
- $83,386
- Rent vs Own
- Severe rent burden
- 150.0
Population outlook (Alachua County) Hauer SSP2
- Today (2025)
- 289,834 people
- By 2030
- 305,873 · +5.5%
- By 2040
- 335,246 · +15.7%
- By 2050
- 364,719 · +25.8%
- By 2075
- 436,665 · +50.7%
- By 2100
- 482,920 · +66.6%
Race, ethnicity, and origin ACS 2023
- Neighborhood character
- Predominantly White (77%)
- Race & ethnicity
- White 77% Black 11% Hispanic / Latino 8% Two or more races 5%
- Hispanic origin (detail)
- Mexican 1% Cuban 1%
- Common ancestry
- Slovak 5% Italian 3% Lithuanian 3%
- Foreign-born
- 3% · Canada
- Languages at home
- 94% English-only · Spanish 4% Other Indo-European 1% Other Asian/Pacific 1%
Political lean MEDSL · Alachua
- 2024 margin
- Strong D (+21.0) · D 59.7% · R 38.8% · Other 1.5%
- 2008→2024 swing
- -0.6pp no change · 2008: 21.6pp · 2024: 21.0pp
- All cycles
- 2024: D+21.0 2020: D+27.2 2016: D+22.5 2012: D+17.3 2008: D+21.6
Not yet ingested
- Civics
- —
Market trends
- HPI YoY
- ▼ -18.02%
- Current HPI
- 308.0178
- Rent YoY
- —
- Metro
- Gainesville, FL
- State GDP YoY
- ▲ 3.28%
- F500 in state
- 36
Industry mix (Fortune 500 HQ in FL)
| Industry | F500 HQs | Revenue |
|---|---|---|
| Industrial Technology | 2 | $29B |
|
||
| Insurance | 2 | $17B |
|
||
| Retail | 1 | $60B |
|
||
| Technology Distribution | 1 | $58B |
|
||
| Homebuilding | 1 | $35B |
|
||
| Technology Manufacturing | 1 | $35B |
|
||
Price history
+1940.8% since first listed6 events — show timeline
- 2026-01-26 Listed $244,900 Stellar MLS as Distributed by MLS Grid
- 2025-07-15 Listing Removed — Stellar MLS as Distributed by MLS Grid
- 2025-06-04 Listed $250,000 Stellar MLS as Distributed by MLS Grid
- 2023-11-01 Sold (Public Records) $240,000 Public Records
- 2022-05-20 Sold (Public Records) $24,600 Public Records
- 2007-02-13 Sold (Public Records) $12,000 Public Records
Property tax history
+38.9%/yrLatest (2025): $2,819 · +5.1% YoY. Source: county tax records.
Cash-flow waterfall
monthlySold comps — $/sqft
last 12 mo · ≤1 miLoading sold comps…