6003 SW Messenger Ave · Bentonville, AR
Flood risk No data
- FEMA flood zone
- —
- Chance of flooding over 30 yrs
- —
- Est. flood insurance / yr
- —
Fire risk No data
- Est. fire insurance / yr
- —
Heat risk No data
- Hot days now (above threshold)
- —
- Hot days in 30 yrs
- —
Wind risk No data
- Chance of severe wind over 30 yrs
- —
Air-quality risk No data
- Unhealthy air days now
- —
- Unhealthy air days in 30 yrs
- —
Risk factors via First Street. Map © Google.
Why this score? — see what drove the D- grade
The composite is a weighted blend of 9 inputs, each scored 0–100. Each bar is that input's sub-score; the figure is the points it added to the 100-point composite (weight × sub-score).
- Appreciation +10.0/10.0
- ARV discount +7.5/15.0
- Cash flow +6.6/30.0
- Schools +5.2/10.0
- Livability +4.2/5.0
- Rent growth +2.6/5.0
- Condition / age +2.5/5.0
- DSCR +0.8/10.0
- 1% rule +0.4/10.0
$391,900
🖨 Deal sheet 📄 Offer letter ✓ Due diligence
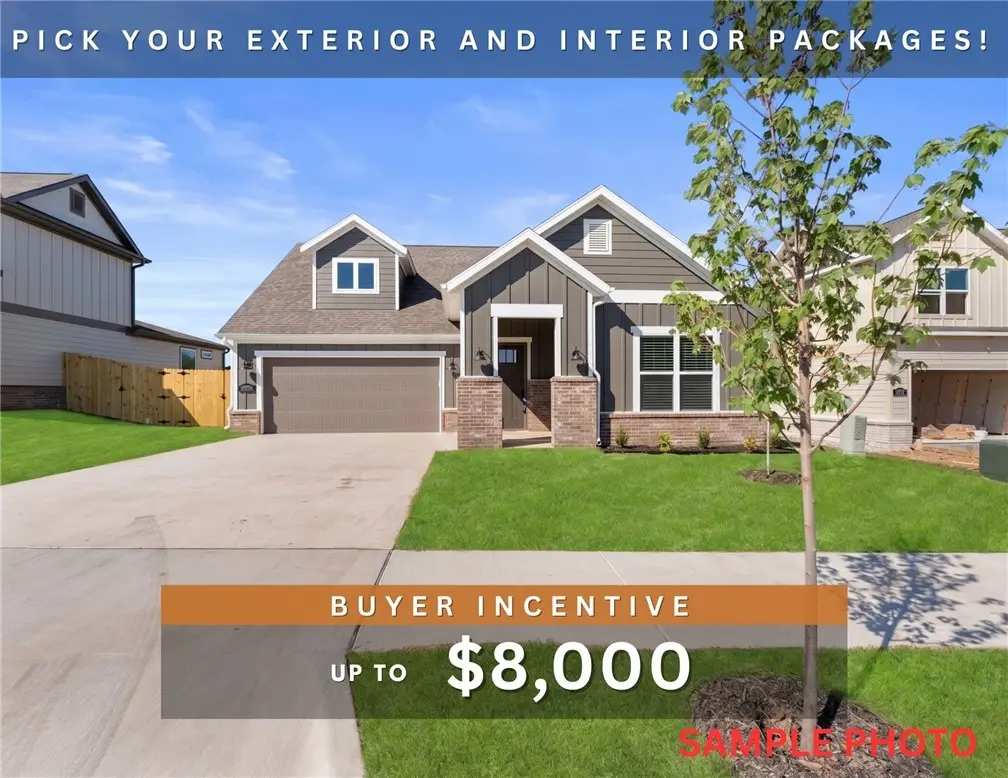
Listing remarks
Fence, blinds and gutters included! Discover your dream home in the sought-after Osage Hills neighborhood. Emmet plan with garage on the right and North facing! Pick your interior packages! 9 ft ceilings, linear electric fireplace in the living room, LVP flooring throughout the main living areas and primary bedroom, quartz countertops and more. Chef's kitchen boasting frigidaire stainless steel appliances, gas range, pantry, quartz countertops, bar pull handles and large island, all complemented by gorgeous backsplash. Luxurious primary bedroom features abundant natural light, while the spa-like primary bathroom offers a walk-in shower, tub, double sinks, and spacious walk-in closets. Addit
Key facts
- Covered patio
- Walk-in shower
- Chef's kitchen
Tags
Property features AI
Finance
- HOA & community: Homeowners association with an annual fee of $150; Community features include curbs, sidewalks, nearby schools, park and shopping
Exterior
- Parking: Attached garage with garage door opener; Two covered parking spaces
- Security: Smoke detector(s)
- Utilities: Cable available; Electricity available; Natural gas available; Public sewer; Public water
- Home design: Two-story home; New construction; Faces north; Slab foundation
- Construction: Brick and concrete construction; Architectural shingle roof; Home warranty included
- Exterior features: Concrete driveway; Covered patio; Patio; Privacy wood fencing around back yard; Landscaped, level, cleared lot; Corner lot in a subdivision, near park
Interior
- Kitchen: Dishwasher; Gas range; Microwave; Disposal; Plumbed for ice maker; Quartz counters; Pantry; Eat-in kitchen
- Bedrooms: Three bedrooms on main and second levels (rooms listed include bedrooms on both main and second levels)
- Flooring: Carpet; Luxury vinyl plank; Tile
- Bathrooms: Three full bathrooms
- Heating & cooling: Central heating (gas); Central air (electric)
- Interior features: Attic; Ceiling fan(s); Eat-in kitchen; Pantry; Quartz counters; Split bedrooms; Storage; Walk-in closet(s); Window treatments; Blinds
- Laundry & utility: Washer hookup; Dryer hookup; Electric water heater
Neighborhood map
What this means for you Summary
Snapshot
- This is a 4-bed/3.0-bath land listed at $392k.
Deal economics
- At list price, monthly cash flow is $-648 ($-8k/yr) — negative.
- To cash-flow at today's rent, offer at most $277k (29.2% below list).
- To meet the 1% rule (rent ≥ 1% of price), the offer needs to be $211k (46.3% below list).
- Recommended offer: $211k (46.3% below list) — sets the bar for 1% rule.
- Cap rate 4.3% vs local median 2.6% in Bentonville — top-decile yield for the area; either an underpriced asset or a hidden risk that comps aren't pricing in. Stress-test before assuming the spread holds.
Location & tenants
- Location reads 83/100 on livability (#2 in AR, #864 nationally) — a professional / high-income tenant draw. Strengths: employment A+, housing A+, health & safety A+; Watch: amenities F.
- Bentonville School District (urban): math 59% / reading 59% proficiency, ranked #3 of 238 in AR (top 1%) — acceptable for families but not a draw, mixed tenant base, ~2y average lease.
- Market conditions: Rents flat; 690 active listings in the ZIP; 17 comparable units currently listed for rent nearby; rentals at typical pace (median 24d on market — plan ~3-4 weeks tenant-placement turnaround); high-income renter base; 4,359 units permitted in Benton County in 2024 (402 in 5+ unit buildings).
Forward outlook
- In year one you build about $42k of equity ($3k loan paydown + $39k appreciation (10.0% local appreciation)).
- Benton County population projected at +56% by 2050 — long-run rental-demand tailwind backs the buy-and-hold thesis.
- By year 2, paydown + projected appreciation supports a ~$67k cash-out refi (75% LTV) — recoverable capital for the next deal without selling this one.
Negotiation context
- It's been on market 34 days — a 3% lower offer ($380k) is reasonable based on typical stale-listing flexibility.
Questions for the listing agent
- What do current leases actually rent for vs. the listed asking? Can we see a recent rent roll and the last 12 months of T-12 income?
- It's been on market 34 days. Have you received any prior offers? Is the seller open to a 46% concession, seller financing, or rate buy-down credit?
- What does the HOA fee cover, when was the last increase, and are there any pending special assessments or reserve-fund shortfalls?
- Is there a deadline driving the sale (1031 exchange, divorce, estate, relocation)? That informs how much negotiation room exists.
- Schools are A-rated — typically a magnet for longer-tenancy family renters. What's the average tenant stay here, and is there a school-zone premium baked into asking?
- The area grade is low — what's the realistic commute time and amenity access for the typical tenant pool here? Any planned neighborhood developments (good or bad) we should know about?
- What's the average days-on-market for RENTAL listings here right now (not sales)? A rising rental-DOM trend means longer vacancies and softer asking-rent achievability than the comps imply.
- What's the recent tenant-quality profile in this submarket — average credit score on applications, eviction rate, late-payment / NSF rate, and stable-employment percentage? A property-management company in the area should have these aggregated.
- How much new for-sale + rental construction is in the pipeline within 1–3 miles? Heavy new supply typically softens prices + rents 12–24 months out; constrained supply supports both.
Investment metrics
- 1% rule
- 0.54% ✗
- Cap rate
- 4.31%
- Cash-on-cash
- -7.09%
- DSCR
- 0.68
- GRM
- 15.5
CMA / ARV
No comps found within radius.
Projected returns pro-forma
10.0% appreciation · 0.39% rent growth · sell at horizon
- IRR
- 18.7%
- Equity multiple
- 2.52×
- Total profit
- $166,538
- Equity at exit
- $353,055
- IRR
- 17.0%
- Equity multiple
- 5.67×
- Total profit
- $512,672
- Equity at exit
- $761,376
Cash invested: $109,732 (down + closing). Projections, not guarantees.
Landlord ↔ Tenant lean methodology
- Overall (STATE)
- 92 Strongly Landlord-Friendly
- State Arkansas
- 92 Strongly Landlord-Friendly · R+14
- County
- — inherits STATE
- City
- — inherits STATE
ZIP-level market 72713
- Home prices YoY
- 3.5%
- Rents YoY
- 0.4%
- Active inventory
- 690
- Price-to-rent
- 15.5×
Monthly cashflow live
- Estimated rent
- $2,106 high interval (Pro) →
- Mortgage (P&I)
- −$2,055
- Tax from tax record
- −$81 /mo · $967/yr
- Insurance
- −$163
- HOA
- −$13
- Vacancy / Maint / Mgmt
- −$442
- Net cashflow
- $-648
Break-even live
UW: 25.0% down · 7.5% · 30yr · 1.5% tax · 5.0% vac · 8.0% maint · 8.0% mgmt
Financing live
Cash to close
- Down payment
- $97,975
- Closing costs
- $11,757
- Reserves months
- —
- Total cash needed
- —
Loan-product check · same deal, 3 products live
Conventional
25% down · 7.5% · 30yr
- Down + closing
- —
- Monthly P&I
- —
- Monthly cashflow
- —
- DSCR
- —
- Eligible?
- —
Personal DTI + credit; lowest rate.
DSCR
20% down · 8.5% · 30yr
- Down + closing
- —
- Monthly P&I
- —
- Monthly cashflow
- —
- DSCR
- —
- Eligible?
- —
No personal income docs; deal must DSCR.
Hard money
10% down · 12.0% · 12mo
- Down + closing
- —
- Monthly P&I
- —
- Monthly cashflow
- —
- DSCR
- —
- Eligible?
- —
Short-term bridge; refi at stabilization.
Rent comps 17 comps
| Address | Beds | Baths | Sqft | Rent | $/sqft | DOM | Units | Dist |
|---|---|---|---|---|---|---|---|---|
| 5809 SW Macasin Ave Bentonville, AR | 4.0 | 2.0 | 1745 | $2,100 | $1.20 | 23d | 1 | 0.12mi |
| 4301 SW Pawhuska St Bentonville, AR | 3.0 | 2.0 | 1782 | $1,980 | $1.11 | 23d | 1 | 0.19mi |
| 6000 SW Desert Ave Bentonville, AR | 3.0 | 2.0 | 1669 | $2,050 | $1.23 | 14d | 1 | 0.21mi |
| 5805 SW Teppee Ave Bentonville, AR | 4.0 | 2.5 | 1854 | $2,145 | $1.16 | 23d | 1 | 0.21mi |
| 3401 SW Endearment St Bentonville, AR | 4.0 | 2.5 | 2065 | $2,000 | $0.97 | 23d | 1 | 0.80mi |
| 6812 Memphis Bentonville, AR | 3.0 | 2.5 | 1599 | $1,550 | $0.97 | 23d | 1 | 0.81mi |
| 6604 SW Dignity Ave Bentonville, AR | 3.0 | 3.0 | 1430 | $1,550 | $1.08 | 14d | 1 | 0.83mi |
| 621-623 Cosmos St Centerton, AR | 3.0 | 2.0 | 1475 | $1,795 | $1.22 | 14d | 1 | 0.85mi |
| 221 Williams Ct Bentonville, AR | 3.0 | 2.0 | 1410 | $1,725 | $1.22 | 23d | 1 | 0.88mi |
| 6800 SW Dignity Ave Bentonville, AR | 3.0 | 2.5 | 1599 | $1,895 | $1.19 | 14d | 1 | 0.91mi |
| 6802 SW Dignity Ave Bentonville, AR | 3.0 | 2.5 | 1599 | $1,895 | $1.19 | 23d | 1 | 0.91mi |
| 231 Palm St Bentonville, AR | 3.0 | 2.0 | 1828 | $2,050 | $1.12 | 23d | 1 | 1.05mi |
| 3406 SW Lucretia Rd Bentonville, AR | 4.0 | 3.0 | 2393 | $2,800 | $1.17 | 23d | 1 | 1.14mi |
| 3600 SW Willowbrook Rd Bentonville, AR | 4.0 | 3.0 | 2612 | $2,600 | $1.00 | 23d | 1 | 1.28mi |
| 3800 SW Mistletoe Ave Unit 1221819P Bentonville, AR | 3.0 | 2.0 | 1593 | $5,861 | $3.68 | 14d | 1 | 1.40mi |
| 6708 SW Shady Rd Bentonville, AR | 4.0 | 2.0 | 1500 | $1,800 | $1.20 | 23d | 1 | 1.47mi |
| 890 Tennessee Ave Bentonville, AR | 3.0 | 2.5 | 1250 | $1,595 | $1.28 | 21d | 1 | 1.49mi |
HOA detail
- Monthly dues
- $13 · $156/yr
- Likely covers
- gaselectric
Listing history 16 events
-
2026-06-18days on market $391,900 Active 34 DOM
-
2026-06-17days on market $391,900 Active 33 DOM
-
2026-06-16days on market $391,900 Active 32 DOM
-
2026-06-15days on market $391,900 Active 31 DOM
-
2026-06-14days on market $391,900 Active 29 DOM
-
2026-06-10days on market $391,900 Active 26 DOM
-
2026-06-09days on market $391,900 Active 25 DOM
-
2026-06-08days on market $391,900 Active 24 DOM
-
2026-06-07days on market $391,900 Active 23 DOM
-
2026-06-05days on market $391,900 Active 20 DOM
-
2026-06-03days on market $391,900 Active 19 DOM
-
2026-06-02days on market $391,900 Active 18 DOM
-
2026-06-01days on market $391,900 Active 17 DOM
-
2026-05-31days on market $391,900 Active 16 DOM
-
2026-05-31days on market $391,900 Active 15 DOM
-
2026-05-15$391,900 Active
ⓘ Source: listings_history table (triggers on properties + properties_extension) + one-shot
backfill from property_details.listing_events for pre-trigger history.
Tax reassessment forecast AR · Resets to sale price
- Current annual tax
- $967 · $81/mo
- Projected year-2 tax
- $2,508 · $209/mo
- Expected delta
- +$1,541/yr (+$128/mo · 159.3%)
ⓘ Screening estimate from a state-policy table — verify with the county assessor before closing.
Nearby sold comps map
Loading sold comps map…
Walkable amenities ~0.75 mi
Loading nearby amenities…
Taxation est. · year 1
- Rental income
- $25,270
- − Mortgage interest
- −$21,952
- − Property taxes
- −$967
- − Insurance
- −$1,960
- − Repairs & maintenance
- −$2,022
- − Management
- −$2,022
- − HOA
- −$156
- − Depreciation
- −$11,401
- Taxable loss
- −$15,209
- Est. tax savings @ 24.0%
- +$3,650
- After-tax cash flow
- $-4,131/yr
For passive investors: Depreciation is non-cash, so a rental often shows a tax loss while cash-flowing — sheltering income. Rental losses are passive: they offset passive income freely, and up to $25,000/yr can offset ordinary (W-2) income if you actively participate and your MAGI is under $100k (phasing out to $0 by $150k); unused losses carry forward. On sale, claimed depreciation is recaptured at up to 25%, and gains may owe capital-gains tax (a 1031 exchange can defer both). Figures are a year-1 estimate at your 24.0% rate — not tax advice; consult a CPA.
Schools (NCES district)
- District
- Bentonville School District
- NCES district ID
- 0503060
- Math proficiency
- 59% ▼ -8.00%
- Reading proficiency
- 59% ▼ -6.00%
- Median HH income
- $66,721
- Composite
- 51.85/100
- National rank
- #1661
- State rank
- #3 of 238 in AR
Livability — Bentonville
- Score
- 83/100
- State rank
- #2
- US rank
- #864
Category grades
Schools grade is shown separately in the Schools card above.
Census & demographics
- Census place
- Bentonville, AR
- County
- Benton County · 259,241 people
- City population
- 67,689
- Metro
- Fayetteville-Springdale-Rogers, AR
- Population (ZIP)
- 28,999
- Household income
- $119,853
- Rent vs Own
- Severe rent burden
- 508.0
Population outlook (Benton County) Hauer SSP2
- Today (2025)
- 318,683 people
- By 2030
- 353,481 · +10.9%
- By 2040
- 425,280 · +33.4%
- By 2050
- 497,239 · +56.0%
- By 2075
- 662,114 · +107.8%
- By 2100
- 776,431 · +143.6%
Race, ethnicity, and origin ACS 2023
- Neighborhood character
- Diverse neighborhood (Simpson 0.66)
- Race & ethnicity
- White 54% Asian 20% Two or more races 16% Hispanic / Latino 11% Black 3%
- Hispanic origin (detail)
- Mexican 8%
- Common ancestry
- Italian 2% Slovak 2% Romanian 1%
- Foreign-born
- 22% · Canada, China, Vietnam
- Languages at home
- 79% English-only · Other Asian/Pacific 8% Spanish 6% Other Indo-European 5%
Political lean MEDSL · Benton
- 2024 margin
- Strong R (+27.0) · D 35.2% · R 62.1% · Other 2.7%
- 2008→2024 swing
- +9.6pp toward D · 2008: -36.5pp · 2024: -27.0pp
- All cycles
- 2024: R+27.0 2020: R+26.4 2016: R+34.9 2012: R+40.4 2008: R+36.5
Not yet ingested
- Civics
- —
Market trends
- HPI YoY
- ▲ 10.77%
- Current HPI
- 319.3081
- Rent YoY
- ▲ 0.39%
- Metro
- Fayetteville-Springdale-Rogers, AR
- State GDP YoY
- ▲ 3.80%
- F500 in state
- 10
Industry mix (Fortune 500 HQ in AR)
| Industry | F500 HQs | Revenue |
|---|---|---|
| Retail | 1 | $681B |
|
||
| Food / Agriculture | 1 | $53B |
|
||
| Retail / Energy | 1 | $22B |
|
||
| Transportation / Logistics | 1 | $12B |
|
||
| Energy | 1 | $4B |
|
||
Price history
1 event — show timeline
- 2026-05-15 Listed $391,900 NWARMLS
Cash-flow waterfall
monthlySold comps — $/sqft
last 12 mo · ≤1 miLoading sold comps…