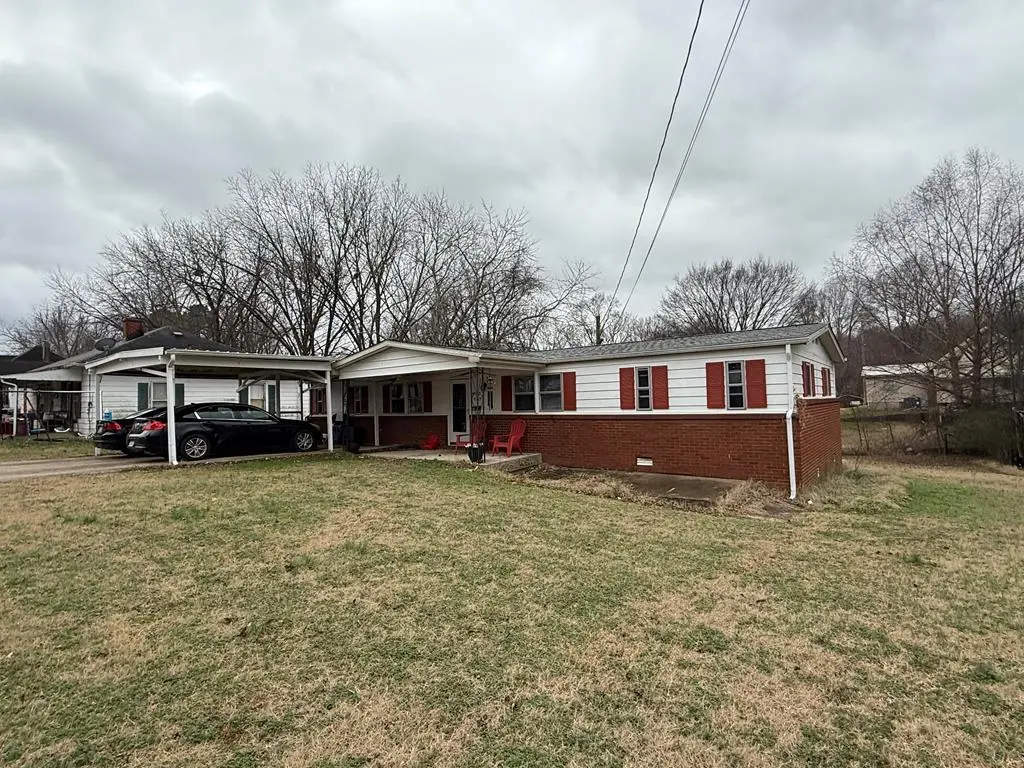
1206 Brown St · Paris, TN
Flood risk 1/10 · Minimal
- FEMA flood zone
- X (unshaded)
- Chance of flooding over 30 yrs
- 0.0%
- Est. flood insurance / yr
- $507 – $1,088
Fire risk 3/10 · Minor
- Est. fire insurance / yr
- $949 – $1,763
Heat risk 6/10 · Moderate
- Hot days now (above 107°F)
- 7 days/yr
- Hot days in 30 yrs
- 20 days/yr
Wind risk 4/10 · Minor
- Chance of severe wind over 30 yrs
- 10.0%
Air-quality risk 1/10 · Minimal
- Unhealthy air days now
- 0 days/yr
- Unhealthy air days in 30 yrs
- 0 days/yr
Risk factors via First Street. Map © Google.
Why this score? — see what drove the C grade
The composite is a weighted blend of 9 inputs, each scored 0–100. Each bar is that input's sub-score; the figure is the points it added to the 100-point composite (weight × sub-score).
- Cash flow +24.0/30.0
- DSCR +7.7/10.0
- ARV discount +7.5/15.0
- 1% rule +4.9/10.0
- Livability +3.8/5.0
- Schools +3.0/10.0
- Rent growth +2.5/5.0
- Condition / age +2.5/5.0
- Appreciation +0.0/10.0
$109,500
🖨 Deal sheet 📄 Offer letter ✓ Due diligence
Listing remarks MLS
Convenient Location! Spacious back yard featuring 3 bedrooms, 2 baths. Master has walk-in closet and full bath. Den could be used at formal dining room. Home has permanent foundation and brick on front and was installed on site 1996 according to records. Small fenced area off deck that can stay or be removed. Water lines to house have been replaced and HVAC compressor is approx. 4 yrs. old. Priced to sell.
Key facts
- Walk-in closet
- Spacious back yard
- Permanent foundation
Tags
Property features AI
Exterior
- Parking: 2 total parking spaces; 2 covered spaces; Attached carport; Open parking; Concrete parking surfaces
- Utilities: Public water; Public sewer; Cable available
- Home design: Residential mobile home (double wide)
- Construction: Brick and vinyl siding exterior; Metal roof; Built as a double wide mobile home
- Exterior features: Rear porch; Deck; Fenced (other); Paved road access; City lot
Interior
- Kitchen: Electric oven; Electric range; Dishwasher; Range hood
- Bedrooms: 3 bedrooms on the main level
- Flooring: Vinyl flooring; Laminate flooring
- Bathrooms: 2 full bathrooms (both on the main level)
- Heating & cooling: Central air; Ceiling fan(s); Has heating
- Interior features: Ceiling fan(s)
- Laundry & utility: Laundry on the main level; Crawl space basement
Neighborhood map
What this means for you Summary
Snapshot
- This is a 3-bed/2.0-bath other listed at $110k.
Deal economics
- At list price, monthly cash flow is $215 ($3k/yr) — positive.
- The deal already cash-flows at list — no discount required.
- To meet the 1% rule (rent ≥ 1% of price), the offer needs to be $109k (0.7% below list).
- Recommended offer: $109k (0.7% below list) — sets the bar for 1% rule.
Location & tenants
- Location reads 75/100 on livability (#13 in TN, #4,115 nationally) — a middle-class / working-renter tenant base. Strengths: cost of living A+, housing A+, health & safety A+; Watch: amenities C-, commute F, employment F.
- Paris (town): math 42% / reading 32% proficiency, ranked #28 of 139 in TN (top 20%) — families likely to look elsewhere, expect single-tenant / working-renter base with shorter leases.
- Zoned schools: W O Inman Middle School (math 36% / reading 28%, grade F, #87 of 333 statewide, top 26%, 507 students, 0% FRL) — zoned schools average 0% FRL vs 53% district-wide (53 pts lower); this property's tenant base skews higher-income than the district average.
- Market conditions: 186 active listings in the ZIP; 19 units permitted in Henry County in 2024 (0 in 5+ unit buildings).
Forward outlook
- Local home prices are declining (-3.0%/yr); year-one equity from $757 of loan paydown is wiped out by about $3k of value loss. Plan a longer hold.
- Henry County population projected to shrink 10% by 2050 — rents likely to lag national; underwrite the cash flow, not the appreciation.
Negotiation context
- Only 3 days on market — expect competitive offers; lowballing is unlikely to land.
- 5 sale attempts since 6y ago with the ask held roughly flat each time — persistent listings suggest the price (not the market) is what's stuck; bring a comps-based counter.
- Current owner paid $76k; 44% above their basis — modest negotiation headroom, anchor on the comps not their cost.
Risks & watch-outs
- Climate carrying-cost: extreme-heat days projected 7→20/yr by 2055 (HVAC capex compounding) — expect insurance premiums to compound above CPI over the hold.
Questions for the listing agent
- Built in 1976 — when were the roof, HVAC, electrical panel, plumbing, and water heater last replaced?
- Is there a deadline driving the sale (1031 exchange, divorce, estate, relocation)? That informs how much negotiation room exists.
- Schools are D-rated, which usually means shorter tenancies and higher turnover. Who's the typical renter profile here, and what's been the actual vacancy rate?
- What's the average days-on-market for RENTAL listings here right now (not sales)? A rising rental-DOM trend means longer vacancies and softer asking-rent achievability than the comps imply.
- What's the recent tenant-quality profile in this submarket — average credit score on applications, eviction rate, late-payment / NSF rate, and stable-employment percentage? A property-management company in the area should have these aggregated.
- How much new for-sale + rental construction is in the pipeline within 1–3 miles? Heavy new supply typically softens prices + rents 12–24 months out; constrained supply supports both.
Investment metrics
- 1% rule
- 0.99% ✗
- Cap rate
- 8.64%
- Cash-on-cash
- 8.40%
- DSCR
- 1.37
- GRM
- 8.4
CMA / ARV
No comps found within radius.
Projected returns pro-forma
-3.0% appreciation · 3.0% rent growth · sell at horizon
- IRR
- -3.6%
- Equity multiple
- 0.87×
- Total profit
- $-4,128
- Equity at exit
- $16,327
- IRR
- 6.1%
- Equity multiple
- 1.45×
- Total profit
- $13,791
- Equity at exit
- $9,468
Cash invested: $30,660 (down + closing). Projections, not guarantees.
Landlord ↔ Tenant lean methodology
- Overall (STATE)
- 87 Strongly Landlord-Friendly
- State Tennessee
- 87 Strongly Landlord-Friendly · R+13
- County
- — inherits STATE
- City
- — inherits STATE
ZIP-level market 38242
- Home prices YoY
- -17.6%
- Active inventory
- 186
- Price-to-rent
- 8.4×
Monthly cashflow live
- Estimated rent
- $1,087 medium interval (Pro) →
- Mortgage (P&I)
- −$574
- Tax from tax record
- −$24 /mo · $293/yr
- Insurance
- −$46
- HOA
- −$0
- Vacancy / Maint / Mgmt
- −$228
- Net cashflow
- $215
Break-even live
UW: 25.0% down · 7.5% · 30yr · 1.5% tax · 5.0% vac · 8.0% maint · 8.0% mgmt
Financing live
Cash to close
- Down payment
- $27,375
- Closing costs
- $3,285
- Reserves months
- —
- Total cash needed
- —
Loan-product check · same deal, 3 products live
Conventional
25% down · 7.5% · 30yr
- Down + closing
- —
- Monthly P&I
- —
- Monthly cashflow
- —
- DSCR
- —
- Eligible?
- —
Personal DTI + credit; lowest rate.
DSCR
20% down · 8.5% · 30yr
- Down + closing
- —
- Monthly P&I
- —
- Monthly cashflow
- —
- DSCR
- —
- Eligible?
- —
No personal income docs; deal must DSCR.
Hard money
10% down · 12.0% · 12mo
- Down + closing
- —
- Monthly P&I
- —
- Monthly cashflow
- —
- DSCR
- —
- Eligible?
- —
Short-term bridge; refi at stabilization.
Listing history 3 events
-
2026-06-07statusdays on market $109,500 Pending 3 DOM
-
2026-06-04remarks 599-char remark
-
2026-06-04$109,500 Active 1 DOM
ⓘ Source: listings_history table (triggers on properties + properties_extension) + one-shot
backfill from property_details.listing_events for pre-trigger history.
Tax reassessment forecast TN · Resets to sale price
- Current annual tax
- $293 · $24/mo
- Projected year-2 tax
- $777 · $65/mo
- Expected delta
- +$484/yr (+$40/mo · 165.3%)
ⓘ Screening estimate from a state-policy table — verify with the county assessor before closing.
Climate risk First Street
- Flood 1/10 Low FEMA zone X (unshaded) · 0% chance over 30 yrs
- Wildfire 3/10 Moderate
- Heat 6/10 Major 7 d/yr ≥107°F today · 20 d/yr by 30 yrs out
- Wind 4/10 Moderate 10% chance of damaging wind over 30 yrs
- Air quality 1/10 Low 0 unhealthy d/yr today · 0 by 30 yrs out
Nearby sold comps map
Loading sold comps map…
Walkable amenities ~0.75 mi
Loading nearby amenities…
Taxation est. · year 1
- Rental income
- $13,046
- − Mortgage interest
- −$6,134
- − Property taxes
- −$293
- − Insurance
- −$548
- − Repairs & maintenance
- −$1,044
- − Management
- −$1,044
- − Depreciation
- −$3,185
- Taxable income
- $799
- Est. tax owed @ 24.0%
- −$192
- After-tax cash flow
- $2,383/yr
For passive investors: Depreciation is non-cash, so a rental often shows a tax loss while cash-flowing — sheltering income. Rental losses are passive: they offset passive income freely, and up to $25,000/yr can offset ordinary (W-2) income if you actively participate and your MAGI is under $100k (phasing out to $0 by $150k); unused losses carry forward. On sale, claimed depreciation is recaptured at up to 25%, and gains may owe capital-gains tax (a 1031 exchange can defer both). Figures are a year-1 estimate at your 24.0% rate — not tax advice; consult a CPA.
Schools (NCES district)
- District
- Paris
- NCES district ID
- 4703360
- Math proficiency
- 42% ▼ -4.00%
- Reading proficiency
- 32% ▼ -2.00%
- Median HH income
- $30,045
- Composite
- 30.15/100
- National rank
- #6330
- State rank
- #28 of 139 in TN
Livability — Paris
- Score
- 75/100
- State rank
- #13
- US rank
- #4115
Category grades
Schools grade is shown separately in the Schools card above.
Census & demographics
- Census place
- Paris, TN
- City population
- 19,619
- Population (ZIP)
- 19,619
Population outlook (Henry County) Hauer SSP2
- Today (2025)
- 31,750 people
- By 2030
- 31,277 · -1.5%
- By 2040
- 30,064 · -5.3%
- By 2050
- 28,675 · -9.7%
- By 2075
- 25,767 · -18.8%
- By 2100
- 22,318 · -29.7%
Race, ethnicity, and origin ACS 2023
- Neighborhood character
- Predominantly White (84%)
- Race & ethnicity
- White 84% Black 10% Two or more races 4% Hispanic / Latino 2%
- Common ancestry
- Slovak 2% Italian 1% Serbian 1%
- Foreign-born
- 1% · Canada
- Languages at home
- 96% English-only · German/W. Germanic 2% Spanish 2%
Political lean MEDSL · Henry
- 2024 margin
- Solid R (+55.3) · D 21.8% · R 77.1% · Other 1.1%
- 2008→2024 swing
- -33.0pp toward R · 2008: -22.4pp · 2024: -55.3pp
- All cycles
- 2024: R+55.3 2020: R+51.1 2016: R+49.8 2012: R+30.2 2008: R+22.4
Not yet ingested
- Civics
- —
Market trends
- HPI YoY
- ▼ -49.93%
- Current HPI
- 234.3442
- Rent YoY
- —
- Metro
- —
- State GDP YoY
- ▲ 2.78%
- F500 in state
- 22
Industry mix (Fortune 500 HQ in TN)
| Industry | F500 HQs | Revenue |
|---|---|---|
| Healthcare | 3 | $91B |
|
||
| Retail | 3 | $72B |
|
||
| Transportation / Logistics | 1 | $88B |
|
||
| Paper / Packaging | 1 | $19B |
|
||
| Insurance | 1 | $13B |
|
||
| Energy | 1 | $12B |
|
||
Price history
+397.7% since first listed12 events — show timeline
- 2026-06-03 Listed $109,500 TVAR
- 2025-01-24 Price Changed $84,500 TVAR
- 2025-01-14 Relisted — TVAR
- 2025-01-09 Contingent — TVAR
- 2025-01-01 Listed $89,500 TVAR
- 2023-08-14 Sold (Public Records) $76,000 Public Records
- 2023-08-14 Sold (MLS) $76,000 TVAR
- 2023-04-27 Listed $78,000 TVAR
- 2021-04-01 Sold (Public Records) $60,000 Public Records
- 2021-03-31 Sold (MLS) $60,000 TVAR
- 2020-11-10 Listed $69,500 TVAR
- 1996-09-05 Sold (Public Records) $22,000 Public Records
Property tax history
+2.9%/yrLatest (2025): $293 · +6.2% YoY. Source: county tax records.
Cash-flow waterfall
monthlySold comps — $/sqft
last 12 mo · ≤1 miLoading sold comps…