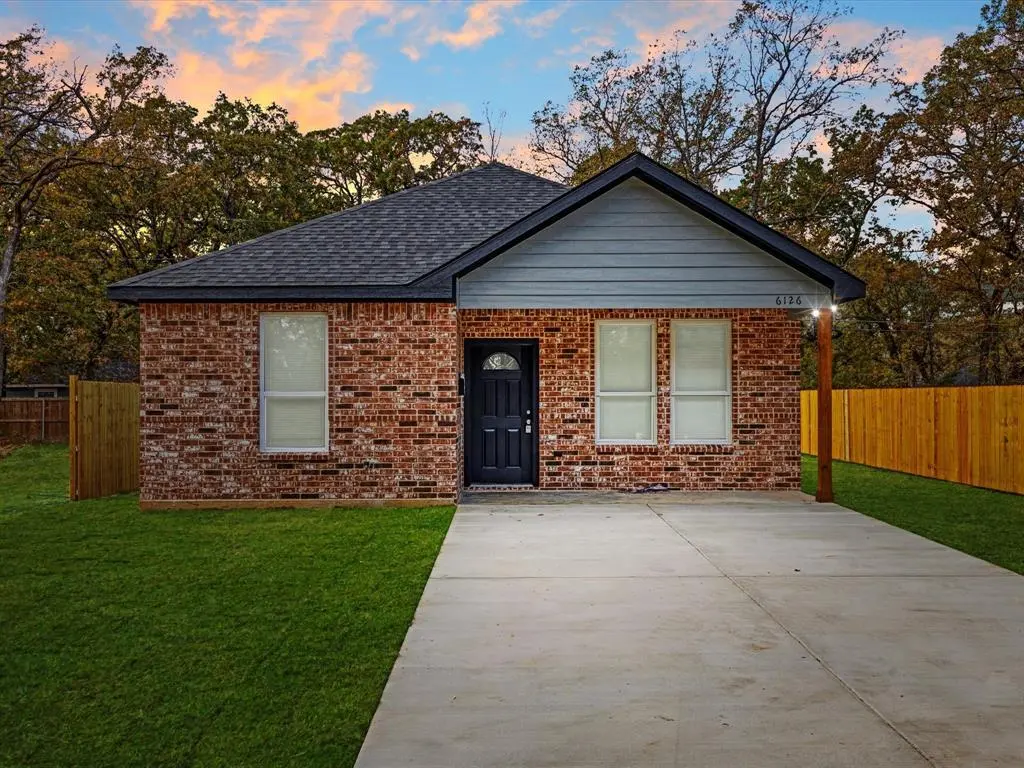
6126 Inca Dr · Enchanted Oaks, TX
Flood risk 1/10 · Minimal
- FEMA flood zone
- X (unshaded)
- Chance of flooding over 30 yrs
- 0.0%
- Est. flood insurance / yr
- $507 – $1,088
Fire risk 3/10 · Minor
- Est. fire insurance / yr
- $1,222 – $2,270
Heat risk 7/10 · Major
- Hot days now (above 109°F)
- 7 days/yr
- Hot days in 30 yrs
- 25 days/yr
Wind risk 6/10 · Moderate
- Chance of severe wind over 30 yrs
- 61.0%
Air-quality risk 2/10 · Minimal
- Unhealthy air days now
- 0 days/yr
- Unhealthy air days in 30 yrs
- 1 days/yr
Risk factors via First Street. Map © Google.
Why this score? — see what drove the D grade
The composite is a weighted blend of 9 inputs, each scored 0–100. Each bar is that input's sub-score; the figure is the points it added to the 100-point composite (weight × sub-score).
- Cash flow +11.8/30.0
- ARV discount +11.0/15.0
- Condition / age +4.8/5.0
- 1% rule +3.5/10.0
- DSCR +3.5/10.0
- Schools +3.2/10.0
- Livability +3.0/5.0
- Rent growth +1.1/5.0
- Appreciation +0.0/10.0
$189,999
🖨 Deal sheet (PDF) 📄 Offer letter ✓ Due diligence
Listing remarks MLS
Discover this charming new construction home in the heart of Mabank, TX—designed with comfort, style, and affordability in mind. Step inside to an inviting open floor plan that seamlessly blends the living, dining, and kitchen areas, creating a bright and spacious atmosphere perfect for everyday living or entertaining guests. This cozy home offers modern finishes, energy-efficient features, and thoughtful details throughout. The kitchen includes contemporary cabinetry, quality countertops, and a layout that makes cooking and gathering a breeze. Large windows fill the home with natural light, while the open design allows you to enjoy easy flow and connection between rooms. The bedrooms are well-sized and comfortable, providing the ideal retreat after a long day. Outside, you’ll find a relaxing yard space—great for family time, gardening, or quiet evenings outdoors. Whether you’re a first-time homeowner, downsizing, or looking for a smart investment property, this affordable new construction home offers exceptional value in a growing community. Experience peaceful living with modern comfort in beautiful Mabank, TX.
Key facts
- 5,009 sq ft lot
- Built 2025
- Listed 117 days
Neighborhood map
What this means for you Summary
Snapshot
- This is a 3-bed/2.0-bath single-family listed at $190k. Condition is rated excellent.
Deal economics
- At list price, monthly cash flow is $-51 ($-614/yr) — negative.
- To cash-flow at today's rent, offer at most $183k (3.9% below list).
- To meet the 1% rule (rent ≥ 1% of price), the offer needs to be $161k (15.2% below list).
- Recommended offer: $161k (15.2% below list) — sets the bar for 1% rule.
- Cap rate 6.0% vs local median 2.2% in Enchanted Oaks — top-decile yield for the area; either an underpriced asset or a hidden risk that comps aren't pricing in. Stress-test before assuming the spread holds.
Location & tenants
- Location reads 60/100 on livability (#1,103 in TX) — a middle-class / working-renter tenant base. Strengths: cost of living A+, crime A, housing A; Watch: amenities F, commute F, health & safety F.
- Eustace ISD (rural): math 32% / reading 45% proficiency, ranked #455 of 826 in TX (top 55%) — families likely to look elsewhere, expect single-tenant / working-renter base with shorter leases; 62% free/reduced lunch — lower-income household profile, screen leases tightly.
- Zoned schools: Eustace Pri (497 students, 74% FRL); Eustace Middle (math 34% / reading 44%, grade F, #690 of 1,662 statewide, top 42%, 382 students, 63% FRL); Eustace H S (math 22% / reading 57%, grade F, #821 of 1,632 statewide, top 53%, 473 students, 56% FRL) — zoned schools at 64% FRL track the district average.
- Market conditions: Rents falling (-5.8%/yr); 705 active listings in the ZIP; 1 comparable units currently listed for rent nearby; 263 units permitted in Henderson County in 2024 (0 in 5+ unit buildings).
- This rent runs 32% of the median local income ($61k/yr) — at the standard rent-burdened threshold; future hikes will face affordability resistance.
Forward outlook
- Local home prices are declining (-3.0%/yr); year-one equity from $1k of loan paydown is wiped out by about $6k of value loss. Plan a longer hold.
Negotiation context
- It's been on market 118 days — a 9% lower offer ($173k) is reasonable based on typical stale-listing flexibility.
- 2 sale attempts with the ask held roughly flat each time — persistent listings suggest the price (not the market) is what's stuck; bring a comps-based counter.
Risks & watch-outs
- Climate carrying-cost: major wind risk, 61% chance of damaging wind over 30y; extreme-heat days projected 7→25/yr by 2055 (HVAC capex compounding) — expect insurance premiums to compound above CPI over the hold.
Questions for the listing agent
- What do current leases actually rent for vs. the listed asking? Can we see a recent rent roll and the last 12 months of T-12 income?
- It's been on market 118 days. Have you received any prior offers? Is the seller open to a 15% concession, seller financing, or rate buy-down credit?
- What does the HOA fee cover, when was the last increase, and are there any pending special assessments or reserve-fund shortfalls?
- Why hasn't it sold? Are there any deal-killer items the seller is aware of (foundation, flood, title, zoning, code violations)?
- Is there a deadline driving the sale (1031 exchange, divorce, estate, relocation)? That informs how much negotiation room exists.
- Schools are F-rated, which usually means shorter tenancies and higher turnover. Who's the typical renter profile here, and what's been the actual vacancy rate?
- The area grade is low — what's the realistic commute time and amenity access for the typical tenant pool here? Any planned neighborhood developments (good or bad) we should know about?
- What's the average days-on-market for RENTAL listings here right now (not sales)? A rising rental-DOM trend means longer vacancies and softer asking-rent achievability than the comps imply.
- What's the recent tenant-quality profile in this submarket — average credit score on applications, eviction rate, late-payment / NSF rate, and stable-employment percentage? A property-management company in the area should have these aggregated.
- How much new for-sale + rental construction is in the pipeline within 1–3 miles? Heavy new supply typically softens prices + rents 12–24 months out; constrained supply supports both.
Investment metrics
- 1% rule
- 0.85% ✗
- Cap rate
- 5.97%
- Cash-on-cash
- -1.15%
- DSCR
- 0.95
- GRM
- 9.8
CMA / ARV
- ARV (median comp)
- $206,067
- List price
- $189,999
- Delta
- -7.80%
- Verdict
- FAIR
- Comps
- 20 within 1.0 mi
Show comp detail 12 sales within ~0.75 mi
| Address | Dist | Beds/Ba | Sqft | Sold | Price | $/sf | Match |
|---|---|---|---|---|---|---|---|
| 6142 Inca Dr | 0.08mi | 3/2.0 | 1,248 (+4%) | 8mo | $213,000 | $171 | 83 |
| 6130 Inca Dr | 0.02mi | 3/2.0 | 1,250 (+4%) | 10mo | $202,000 | $162 | 83 |
| 106 Comanche Dr | 0.36mi | 3/2.0 | 1,200 (0%) | 7mo | $190,000 | $158 | 77 |
| 6105 Chickasaw Dr | 0.09mi | 3/2.0 | 1,350 (+12%) | 2mo | $196,500 | $146 | 73 |
| 112 Pierce Dr | 0.21mi | 3/2.0 | 1,296 (+8%) | 7mo | $149,000 | $115 | 70 |
| 116 Navajo Dr | 0.16mi | 3/2.0 | 1,080 (-10%) | 7mo | $174,900 | $162 | 70 |
| 6114 Inca Dr | 0.05mi | 3/2.0 | 1,364 (+14%) | 11mo | $215,000 | $158 | 66 |
| 140 Mohican Trl | 0.56mi | 3/2.0 | 1,200 (0%) | 11mo | $180,000 | $150 | 65 |
| 106 Ute Trl | 0.65mi | 3/2.0 | 1,250 (+4%) | 3mo | $209,000 | $167 | 60 |
| 162 Aztec Dr | 0.36mi | 3/2.0 | 1,377 (+15%) | 4mo | $539,000 | $391 | 56 |
| 6141 Shawnee | 0.29mi | 3/1.5 | 1,353 (+13%) | 12mo | $149,990 | $111 | 53 |
| 6185 Apache Dr | 0.43mi | 2/2.0 (-1) | 1,056 (-12%) | 6mo | $349,900 | $331 | 50 |
Match score weights: distance 35% · size 25% · config 20% · recency 20%. Top-matched comps best support the ARV.
Projected returns pro-forma
-3.0% appreciation · 0.0% rent growth · sell at horizon
- IRR
- -21.6%
- Equity multiple
- 0.27×
- Total profit
- $-38,740
- Equity at exit
- $28,329
- IRR
- -24.9%
- Equity multiple
- -0.05×
- Total profit
- $-56,054
- Equity at exit
- $16,428
Cash invested: $53,200 (down + closing). Projections, not guarantees.
Landlord ↔ Tenant lean methodology
- Overall (STATE)
- 87 Strongly Landlord-Friendly
- State Texas
- 87 Strongly Landlord-Friendly · R+5
- County
- — inherits STATE
- City
- — inherits STATE
ZIP-level market 75156
- Rents YoY
- -5.8%
- Active inventory
- 705
- Price-to-rent
- 9.8×
Monthly cashflow live
- Estimated rent
- $1,611 medium interval (Pro) →
- Mortgage (P&I)
- −$996
- Tax est. 1.5%
- −$237 /mo · $2,850/yr
- Insurance
- −$79
- HOA
- −$11
- Vacancy / Maint / Mgmt
- −$338
- Net cashflow
- $-51
Break-even live
Sensitivity live
| Price | -10% $80 | -5% $14 | +0% $-51 | +5% $-117 | +10% $-183 |
|---|---|---|---|---|---|
| Rent | -10% $-178 | -5% $-115 | +0% $-51 | +5% $12 | +10% $76 |
| Rate | -1.0pp $44 | -0.5pp $-3 | base $-51 | +0.5pp $-100 | +1.0pp $-151 |
UW: 25.0% down · 7.5% · 30yr · 1.5% tax · 5.0% vac · 8.0% maint · 8.0% mgmt
Financing live
Cash to close
- Down payment
- $47,500
- Closing costs
- $5,700
- Reserves months
- —
- Total cash needed
- —
Loan-product check · same deal, 3 products live
Conventional
25% down · 7.5% · 30yr
- Down + closing
- —
- Monthly P&I
- —
- Monthly cashflow
- —
- DSCR
- —
- Eligible?
- —
Personal DTI + credit; lowest rate.
DSCR
20% down · 8.5% · 30yr
- Down + closing
- —
- Monthly P&I
- —
- Monthly cashflow
- —
- DSCR
- —
- Eligible?
- —
No personal income docs; deal must DSCR.
Hard money
10% down · 12.0% · 12mo
- Down + closing
- —
- Monthly P&I
- —
- Monthly cashflow
- —
- DSCR
- —
- Eligible?
- —
Short-term bridge; refi at stabilization.
Rent comps 1 comps
| Address | Beds | Baths | Sqft | Rent | $/sqft | DOM | Units | Dist |
|---|---|---|---|---|---|---|---|---|
| 114 Sierra Madre St Mabank, TX | 3.0 | 2.0 | 1268 | $1,800 | $1.42 | 45d | 1 | 1.36mi |
HOA detail
- Monthly dues
- $11 · $132/yr
Listing history 19 events
-
2026-06-22days on market $189,999 Active 118 DOM
-
2026-06-19days on market $189,999 Active 115 DOM
-
2026-06-18days on market $189,999 Active 114 DOM
-
2026-06-17days on market $189,999 Active 113 DOM
-
2026-06-16days on market $189,999 Active 112 DOM
-
2026-06-15days on market $189,999 Active 111 DOM
-
2026-06-14days on market $189,999 Active 109 DOM
-
2026-06-12days on market $189,999 Active 108 DOM
-
2026-06-09days on market $189,999 Active 105 DOM
-
2026-06-08days on market $189,999 Active 104 DOM
-
2026-06-07days on market $189,999 Active 103 DOM
-
2026-06-05days on market $189,999 Active 100 DOM
-
2026-06-02days on market $189,999 Active 98 DOM
-
2026-06-01days on market $189,999 Active 97 DOM
-
2026-05-31days on market $189,999 Active 96 DOM
-
2026-05-30days on market $189,999 Active 95 DOM
-
2026-02-24$189,999 Active 1157-char remark
Show marketing remark (1157 chars)
Discover this charming new construction home in the heart of Mabank, TX—designed with comfort, style, and affordability in mind. Step inside to an inviting open floor plan that seamlessly blends the living, dining, and kitchen areas, creating a bright and spacious atmosphere perfect for everyday living or entertaining guests. This cozy home offers modern finishes, energy-efficient features, and thoughtful details throughout. The kitchen includes contemporary cabinetry, quality countertops, and a layout that makes cooking and gathering a breeze. Large windows fill the home with natural light, while the open design allows you to enjoy easy flow and connection between rooms. The bedrooms are well-sized and comfortable, providing the ideal retreat after a long day. Outside, you’ll find a relaxing yard space—great for family time, gardening, or quiet evenings outdoors. Whether you’re a first-time homeowner, downsizing, or looking for a smart investment property, this affordable new construction home offers exceptional value in a growing community. Experience peaceful living with modern comfort in beautiful Mabank, TX.
-
2026-02-12historical
-
2025-11-24$195,000 Active
ⓘ Source: listings_history table (triggers on properties + properties_extension) + one-shot
backfill from property_details.listing_events for pre-trigger history.
Climate risk First Street
- Flood 1/10 Low FEMA zone X (unshaded) · 0% chance over 30 yrs
- Wildfire 3/10 Moderate
- Heat 7/10 Severe 7 d/yr ≥109°F today · 25 d/yr by 30 yrs out
- Wind 6/10 Major 61% chance of damaging wind over 30 yrs
- Air quality 2/10 Low 0 unhealthy d/yr today · 1 by 30 yrs out
Nearby sold comps map
Loading sold comps map…
Walkable amenities ~0.75 mi
Loading nearby amenities…
Taxation est. · year 1
- Rental income
- $19,334
- − Mortgage interest
- −$10,643
- − Property taxes
- −$2,850
- − Insurance
- −$950
- − Repairs & maintenance
- −$1,547
- − Management
- −$1,547
- − HOA
- −$132
- − Depreciation
- −$5,527
- Taxable loss
- −$3,861
- Est. tax savings @ 24.0%
- +$927
- After-tax cash flow
- $312/yr
For passive investors: Depreciation is non-cash, so a rental often shows a tax loss while cash-flowing — sheltering income. Rental losses are passive: they offset passive income freely, and up to $25,000/yr can offset ordinary (W-2) income if you actively participate and your MAGI is under $100k (phasing out to $0 by $150k); unused losses carry forward. On sale, claimed depreciation is recaptured at up to 25%, and gains may owe capital-gains tax (a 1031 exchange can defer both). Figures are a year-1 estimate at your 24.0% rate — not tax advice; consult a CPA.
Condition & rehab AI · 12 photos
This charming new construction home in Mabank, TX is move-in ready with excellent condition and modern finishes. It offers a bright and spacious open floor plan, modern kitchen, and well-maintained exterior. Additional updates like fresh paint and smart home devices can further enhance its value.
Value-add opportunities
- Resale Paint interior walls — Fresh paint enhances curb appeal
- Both Install smart home devices — Improves convenience and marketability
- Both Add outdoor lighting — Enhances curb appeal and safety
Renovation cost estimate screening
Value-add ROI direction
- Resale Paint interior walls — Fresh paint enhances curb appeal ↑
- Both Install smart home devices — Improves convenience and marketability ↑
- Both Add outdoor lighting — Enhances curb appeal and safety ↑
ⓘ Cost ranges are severity-bucket heuristics (US national rule-of-thumb). Get contractor quotes + a written scope before underwriting a rehab budget.
Schools (NCES district)
- District
- Eustace ISD
- NCES district ID
- 4818720
- Math proficiency
- 32% ▼ -18.00%
- Reading proficiency
- 45% ▼ -7.00%
- Median HH income
- $42,425
- Composite
- 32.48/100
- National rank
- #5711
- State rank
- #455 of 826 in TX
Livability — Enchanted Oaks
- Score
- 60/100
- State rank
- #1103
- US rank
- #19536
Category grades
Schools grade is shown separately in the Schools card above.
Census & demographics
- County
- Henderson County · 34,977 people
- Metro
- Athens, TX
- Population (ZIP)
- 16,333
- Household income
- $60,867
- Rent vs Own
- Severe rent burden
- 400.0
Population outlook (Henderson County) Hauer SSP2
- Today (2025)
- 80,471 people
- By 2030
- 80,608 · +0.2%
- By 2040
- 80,087 · -0.5%
- By 2050
- 78,208 · -2.8%
- By 2075
- 72,423 · -10.0%
- By 2100
- 61,012 · -24.2%
Race, ethnicity, and origin ACS 2023
- Neighborhood character
- Predominantly White (85%)
- Race & ethnicity
- White 85% Hispanic / Latino 7% Two or more races 7% Black 1%
- Hispanic origin (detail)
- Mexican 5%
- Common ancestry
- Slovak 3% Serbian 2% European 2%
- Foreign-born
- 4% · Canada, Jamaica
- Languages at home
- 94% English-only · Spanish 4% Other Indo-European 1%
Political lean MEDSL · Henderson
- 2024 margin
- Solid R (+63.5) · D 18.0% · R 81.4%
- 2008→2024 swing
- -18.8pp toward R · 2008: -44.6pp · 2024: -63.5pp
- All cycles
- 2024: R+63.5 2020: R+60.2 2016: R+60.0 2012: R+54.8 2008: R+44.6
Not yet ingested
- Civics
- —
Market trends
- HPI YoY
- ▼ -216.77%
- Current HPI
- 199.8108
- Rent YoY
- ▼ -5.76%
- Metro
- Athens, TX
- State GDP YoY
- ▲ 3.95%
- F500 in state
- 110
Industry mix (Fortune 500 HQ in TX)
| Industry | F500 HQs | Revenue |
|---|---|---|
| Energy | 16 | $1,198B |
|
||
| Technology | 5 | $198B |
|
||
| Engineering / Construction | 4 | $72B |
|
||
| Energy Services | 3 | $60B |
|
||
| Utilities | 3 | $41B |
|
||
| Healthcare | 2 | $330B |
|
||
Price history
-2.6% since first listed3 events — show timeline
- 2026-02-24 Listed $189,999 NTREIS
- 2026-02-12 Listing Removed — NTREIS
- 2025-11-24 Listed $195,000 NTREIS
Cash-flow waterfall
monthlySold comps — $/sqft
last 12 mo · ≤1 miLoading sold comps…