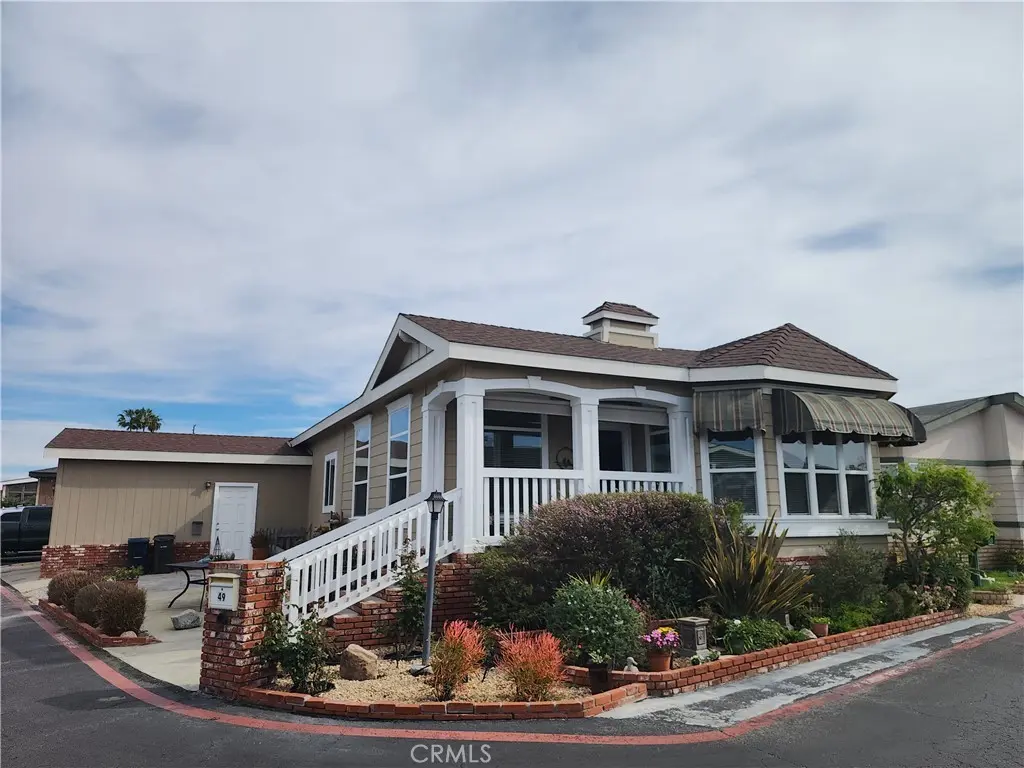
19361 Brookhurst #49 · Huntington Beach, CA
Flood risk 5/10 · Moderate
- FEMA flood zone
- X
- Chance of flooding over 30 yrs
- 0.24%
- Est. flood insurance / yr
- $507 – $1,088
Fire risk 1/10 · Minimal
- Est. fire insurance / yr
- $659 – $1,223
Heat risk 5/10 · Moderate
- Hot days now (above 85°F)
- 7 days/yr
- Hot days in 30 yrs
- 23 days/yr
Wind risk 1/10 · Minimal
- Chance of severe wind over 30 yrs
- —
Air-quality risk 4/10 · Minor
- Unhealthy air days now
- 5 days/yr
- Unhealthy air days in 30 yrs
- 7 days/yr
Risk factors via First Street. Map © Google.
Why this score? — see what drove the C+ grade
The composite is a weighted blend of 9 inputs, each scored 0–100. Each bar is that input's sub-score; the figure is the points it added to the 100-point composite (weight × sub-score).
- Cash flow +30.0/30.0
- DSCR +10.0/10.0
- 1% rule +7.8/10.0
- Schools +6.5/10.0
- Livability +3.4/5.0
- Rent growth +2.8/5.0
- Condition / age +2.5/5.0
- ARV discount +0.0/15.0
- Appreciation +0.0/10.0
$335,000
🖨 Deal sheet (PDF) 📄 Offer letter ✓ Due diligence
Listing remarks
2-car GARAGE * * * 3 bedroom 2 bath * * * Open floor plan * * * Island kitchen * * * wood flooring * * * corner lot * * * central A/C * * * Front porch * * * Tons of cabinets and storage * * * Walk-in closet * * * inside laundry room * * * high ceilings with crown molding * * * all-ages community * * * swimming & clubhouse.
Key facts
- Wood flooring
- Open floor plan
- Island kitchen
Tags
Property features AI
Finance
- Other: Lot size source: Assessor's data; Elevation units in feet; Directions: enter community and make a right at the clubhouse, stay to the right; the home is on the right on the corner
- Financial info: Monthly land lease of $2,815 paid to the park
- HOA & community: Located in a suburban community; Park name: Rancho Huntington; Manager approval required
Exterior
- Parking: Attached garage; 2 garage spaces (2 total parking spaces)
- Utilities: Public sewer; District/Public water
- Home design: Single-story home; Mobile home remains on site; Living area is estimated
- Construction: Year built is estimated; Mobile dimensions approximately 27 ft wide by 60 ft long
- Exterior features: Community pool; Level with street lot
Interior
- Bathrooms: 2 full bathrooms
- Interior features: Entry at ground level; Entry located on the first floor
- Laundry & utility: Laundry area inside the home
Neighborhood map
What this means for you Summary
Snapshot
- This is a 3-bed/2.0-bath manufactured listed at $335k.
Deal economics
- At list price, monthly cash flow is $1k ($17k/yr) — positive.
- The deal already cash-flows at list — no discount required.
- Meets the 1% rule at list price ($4k rent vs $335k).
- Cap rate 11.4% vs local median 1.6% in Huntington Beach — top-decile yield for the area; either an underpriced asset or a hidden risk that comps aren't pricing in. Stress-test before assuming the spread holds.
Location & tenants
- Location reads 67/100 on livability (#306 in CA) — a middle-class / working-renter tenant base. Strengths: employment A+, commute A-, schools B+; Watch: amenities C-, cost of living F, health & safety F.
- Huntington Beach Union High (suburban): math 65% / reading 82% proficiency, ranked #39 of 517 in CA (top 8%) — strong family-tenant draw, lease renewals of 3-5y typical.
- Market conditions: Rents rising (+1.2%/yr); 116 active listings in the ZIP; 26 comparable units currently listed for rent nearby; rentals leasing fast (median 3d on market — plan ~1-2 weeks tenant-placement turnaround); high-income renter base; 6,974 units permitted in Orange County in 2024 (3,839 in 5+ unit buildings).
- This rent runs 39% of the median local income ($131k/yr) — at the standard rent-burdened threshold; future hikes will face affordability resistance.
Forward outlook
- Local home prices are declining (-3.0%/yr); year-one equity from $2k of loan paydown is wiped out by about $10k of value loss. Plan a longer hold.
- Orange County population projected at +14% by 2050 — modest demand growth; plan on rents tracking national, not racing it.
- At projected returns (-3.0% appreciation + 1.2% rent growth), your $94k cash investment doubles in ~8 years — after that, you're playing with house money.
Negotiation context
- Only 9 days on market — expect competitive offers; lowballing is unlikely to land.
- 2 sale attempts since 14y ago with the ask held roughly flat each time — persistent listings suggest the price (not the market) is what's stuck; bring a comps-based counter.
Risks & watch-outs
- Climate carrying-cost: moderate flood risk; extreme-heat days projected 7→23/yr by 2055 (HVAC capex compounding) — expect insurance premiums to compound above CPI over the hold.
Questions for the listing agent
- Is there a deadline driving the sale (1031 exchange, divorce, estate, relocation)? That informs how much negotiation room exists.
- Schools are B-rated — typically a magnet for longer-tenancy family renters. What's the average tenant stay here, and is there a school-zone premium baked into asking?
- What's the average days-on-market for RENTAL listings here right now (not sales)? A rising rental-DOM trend means longer vacancies and softer asking-rent achievability than the comps imply.
- What's the recent tenant-quality profile in this submarket — average credit score on applications, eviction rate, late-payment / NSF rate, and stable-employment percentage? A property-management company in the area should have these aggregated.
- How much new for-sale + rental construction is in the pipeline within 1–3 miles? Heavy new supply typically softens prices + rents 12–24 months out; constrained supply supports both.
Investment metrics
- 1% rule
- 1.28% ✓
- Cap rate
- 11.42%
- Cash-on-cash
- 18.31%
- DSCR
- 1.81
- GRM
- 6.5
CMA / ARV
- ARV (on-the-fly)
- $237,600
- Comps found
- 12
Show comp detail 12 sales within ~0.75 mi
| Address | Dist | Beds/Ba | Sqft | Sold | Price | $/sf | Match |
|---|---|---|---|---|---|---|---|
| 19361 Brookhurst St #33 | 0.00mi | 3/2.0 | 1,680 (+2%) | 4mo | $277,365 | $165 | 93 |
| 19361 Brookhurst St #51 | 0.00mi | 3/2.0 | 1,536 (-7%) | 12mo | $161,000 | $105 | 79 |
| 9850 Garfield Ave #74 | 0.30mi | 3/2.0 | 1,750 (+6%) | 1mo | $312,500 | $179 | 75 |
| 9850 Garfield #129 | 0.30mi | 3/2.0 | 1,560 (-6%) | 2mo | $285,000 | $183 | 75 |
| 19361 Brookhurst #101 | 0.00mi | 3/2.0 | 1,440 (-13%) | 5mo | $208,000 | $144 | 75 |
| 19251 Brookhurst St #71 | 0.20mi | 2/2.0 (-1) | 1,608 (-2%) | 10mo | $125,000 | $78 | 73 |
| 19361 Brookhurst St #120 | 0.00mi | 2/2.0 (-1) | 1,500 (-9%) | 11mo | $138,000 | $92 | 71 |
| 9850 Garfield #35 | 0.30mi | 3/2.0 | 1,831 (+11%) | 0mo | $250,000 | $137 | 67 |
| 9850 Garfield Ave #130 | 0.30mi | 3/2.0 | 1,800 (+9%) | 8mo | $335,000 | $186 | 65 |
| 19361 Brookhurst St #34 | 0.07mi | 2/2.0 (-1) | 1,404 (-15%) | 11mo | $156,000 | $111 | 57 |
| 19251 Brookhurst St #95 | 0.23mi | 2/2.0 (-1) | 1,440 (-13%) | 11mo | $103,000 | $72 | 54 |
| 19350 Ward St #57 | 0.67mi | 3/2.0 | 1,548 (-6%) | 6mo | $319,500 | $206 | 53 |
Match score weights: distance 35% · size 25% · config 20% · recency 20%. Top-matched comps best support the ARV.
Projected returns pro-forma
-3.0% appreciation · 1.2% rent growth · sell at horizon
- IRR
- 8.1%
- Equity multiple
- 1.31×
- Total profit
- $29,082
- Equity at exit
- $49,950
- IRR
- 15.8%
- Equity multiple
- 2.19×
- Total profit
- $111,839
- Equity at exit
- $28,965
Cash invested: $93,800 (down + closing). Projections, not guarantees.
Landlord ↔ Tenant lean methodology
- Overall (STATE)
- 18 Strongly Tenant-Friendly
- State California
- 18 Strongly Tenant-Friendly · D+13
- County
- — inherits STATE
- City
- — inherits STATE
ZIP-level market 92646
- Rents YoY
- 1.2%
- Active inventory
- 116
- Price-to-rent
- 6.5×
Monthly cashflow live
- Estimated rent
- $4,297 high interval (Pro) →
- Mortgage (P&I)
- −$1,757
- Tax from tax record
- −$67 /mo · $802/yr
- Insurance
- −$140
- HOA
- −$0
- Vacancy / Maint / Mgmt
- −$902
- Net cashflow
- $1,431
Break-even live
Sensitivity live
| Price | -10% $1,621 | -5% $1,526 | +0% $1,431 | +5% $1,337 | +10% $1,242 |
|---|---|---|---|---|---|
| Rent | -10% $1,092 | -5% $1,262 | +0% $1,431 | +5% $1,601 | +10% $1,771 |
| Rate | -1.0pp $1,600 | -0.5pp $1,517 | base $1,431 | +0.5pp $1,345 | +1.0pp $1,256 |
UW: 25.0% down · 7.5% · 30yr · 1.5% tax · 5.0% vac · 8.0% maint · 8.0% mgmt
Financing live
Cash to close
- Down payment
- $83,750
- Closing costs
- $10,050
- Reserves months
- —
- Total cash needed
- —
Loan-product check · same deal, 3 products live
Conventional
25% down · 7.5% · 30yr
- Down + closing
- —
- Monthly P&I
- —
- Monthly cashflow
- —
- DSCR
- —
- Eligible?
- —
Personal DTI + credit; lowest rate.
DSCR
20% down · 8.5% · 30yr
- Down + closing
- —
- Monthly P&I
- —
- Monthly cashflow
- —
- DSCR
- —
- Eligible?
- —
No personal income docs; deal must DSCR.
Hard money
10% down · 12.0% · 12mo
- Down + closing
- —
- Monthly P&I
- —
- Monthly cashflow
- —
- DSCR
- —
- Eligible?
- —
Short-term bridge; refi at stabilization.
Rent comps 26 comps
| Address | Beds | Baths | Sqft | Rent | $/sqft | DOM | Units | Dist |
|---|---|---|---|---|---|---|---|---|
| 19754 Kingswood Ln Huntington Beach, CA | 4.0 | 1.5 | 1254 | $3,595 | $2.87 | 1d | 1 | 0.36mi |
| 19775 Cambridge Ln Huntington Beach, CA | 3.0 | 2.5 | 1122 | $3,495 | $3.11 | 1d | 1 | 0.38mi |
| 19844 Inverness Ln Huntington Beach, CA | 4.0 | 1.5 | 1254 | $3,675 | $2.93 | 1d | 1 | 0.46mi |
| 10107 Holburn Dr Huntington Beach, CA | 3.0 | 1.5 | 1122 | $3,500 | $3.12 | 1d | 1 | 0.47mi |
| 9552 Bickley Dr #7 Huntington Beach, CA | 3.0 | 1.5 | 1100 | $3,500 | $3.18 | 1d | 1 | 0.47mi |
| 9582 Pettswood Dr Huntington Beach, CA | 3.0 | 1.5 | 1178 | $3,700 | $3.14 | 19d | 1 | 0.53mi |
| 9582 Pettswood Dr Huntington Beach, CA | 3.0 | 1.5 | 1174 | $3,700 | $3.15 | 17d | 1 | 0.53mi |
| 9727 Adams Ave Huntington Beach, CA | 3.0 | 2.5 | 1122 | $3,300 | $2.94 | 1d | 1 | 0.58mi |
| 19901 Sheffield Ln Huntington Beach, CA | 4.0 | 1.5 | 1254 | $3,795 | $3.03 | 17d | 1 | 0.60mi |
| 10172 Ascot Cir Huntington Beach, CA | 3.0 | 1.5 | 1122 | $4,500 | $4.01 | 1d | 1 | 0.63mi |
| 9111 Warfield Dr Huntington Beach, CA | 4.0 | 2.5 | 1812 | $5,500 | $3.04 | 24d | 1 | 0.79mi |
| 19343 McLaren Ln Huntington Beach, CA | 3.0 | 2.0 | 1654 | $4,000 | $2.42 | 24d | 1 | 0.87mi |
| 9022 Hyde Park Dr Huntington Beach, CA | 4.0 | 2.5 | 1868 | $4,995 | $2.67 | 25d | 1 | 0.88mi |
| 9021 Hyde Park Dr Huntington Beach, CA | 4.0 | 2.5 | 1818 | $5,750 | $3.16 | 1d | 1 | 0.89mi |
| 9704 Lark Cir Fountain Valley, CA | 4.0 | 2.5 | 1528 | $4,600 | $3.01 | 22d | 1 | 0.97mi |
| 9891 Hot Springs Dr Huntington Beach, CA | 3.0 | 2.0 | 1494 | $7,000 | $4.69 | 1d | 1 | 1.05mi |
| 8831 Sailport Dr Huntington Beach, CA | 4.0 | 2.5 | 2224 | $6,095 | $2.74 | 18d | 1 | 1.07mi |
| 8831 Sailport Dr Huntington Beach, CA | 4.0 | 3.0 | 2224 | $6,095 | $2.74 | 1d | 1 | 1.07mi |
| 9595 Toucan Ave Fountain Valley, CA | 3.0 | 2.5 | 1548 | $4,200 | $2.71 | 17d | 1 | 1.18mi |
| 18236 Sanmian Ct Fountain Valley, CA | 3.0 | 3.0 | 1690 | $4,100 | $2.43 | 22d | 1 | 1.20mi |
| 18229 Olympic Ct Fountain Valley, CA | 3.0 | 2.0 | 1144 | $4,300 | $3.76 | 1d | 1 | 1.27mi |
| 2932 Pemba Dr Costa Mesa, CA | 4.0 | 2.0 | 1775 | $7,500 | $4.23 | 11d | 1 | 1.44mi |
| 9272 Sunridge Dr Huntington Beach, CA | 4.0 | 2.0 | 1684 | $6,000 | $3.56 | 1d | 1 | 1.46mi |
| 8521 Afton Cir Huntington Beach, CA | 4.0 | 3.0 | 1950 | $5,500 | $2.82 | 3d | 1 | 1.49mi |
| 8933 Modesto Cir Unit 1215B Huntington Beach, CA | 2.0 | 2.0 | 1091 | $3,200 | $2.93 | 1d | 1 | 1.49mi |
| 8933 Modesto Cir Unit 1215B Huntington Beach, CA | 2.0 | 2.0 | 1091 | $3,200 | $2.93 | 18d | 1 | 1.49mi |
Listing history 8 events
-
2026-06-18days on market $335,000 Active 9 DOM
-
2026-06-17days on market $335,000 Active 8 DOM
-
2026-06-16days on market $335,000 Active 7 DOM
-
2026-06-15days on market $335,000 Active 6 DOM
-
2026-06-13days on market $335,000 Active 4 DOM
-
2026-06-13days on market $335,000 Active 3 DOM
-
2026-06-10remarks 379-char remark
-
2026-06-10$335,000 Active 1 DOM
ⓘ Source: listings_history table (triggers on properties + properties_extension) + one-shot
backfill from property_details.listing_events for pre-trigger history.
Tax reassessment forecast CA · Resets to sale price
- Current annual tax
- $802 · $67/mo
- Projected year-2 tax
- $2,546 · $212/mo
- Expected delta
- +$1,744/yr (+$145/mo · 217.6%)
ⓘ Screening estimate from a state-policy table — verify with the county assessor before closing.
Climate risk First Street
- Flood 5/10 Major FEMA zone X · 24% chance over 30 yrs
- Wildfire 1/10 Low
- Heat 5/10 Major 7 d/yr ≥85°F today · 23 d/yr by 30 yrs out
- Wind 1/10 Low
- Air quality 4/10 Moderate 5 unhealthy d/yr today · 7 by 30 yrs out
Nearby sold comps map
Loading sold comps map…
Walkable amenities ~0.75 mi
Loading nearby amenities…
Taxation est. · year 1
- Rental income
- $51,562
- − Mortgage interest
- −$18,765
- − Property taxes
- −$802
- − Insurance
- −$1,675
- − Repairs & maintenance
- −$4,125
- − Management
- −$4,125
- − Depreciation
- −$9,745
- Taxable income
- $12,325
- Est. tax owed @ 24.0%
- −$2,958
- After-tax cash flow
- $14,218/yr
For passive investors: Depreciation is non-cash, so a rental often shows a tax loss while cash-flowing — sheltering income. Rental losses are passive: they offset passive income freely, and up to $25,000/yr can offset ordinary (W-2) income if you actively participate and your MAGI is under $100k (phasing out to $0 by $150k); unused losses carry forward. On sale, claimed depreciation is recaptured at up to 25%, and gains may owe capital-gains tax (a 1031 exchange can defer both). Figures are a year-1 estimate at your 24.0% rate — not tax advice; consult a CPA.
Schools (NCES district)
- District
- Huntington Beach Union High
- NCES district ID
- 0618060
- Math proficiency
- 65% ▲ 17.00%
- Reading proficiency
- 82% ▲ 8.00%
- Median HH income
- $78,159
- Composite
- 64.9/100
- National rank
- #511
- State rank
- #39 of 517 in CA
Livability — Huntington Beach
- Score
- 67/100
- State rank
- #306
- US rank
- #10298
Category grades
Schools grade is shown separately in the Schools card above.
Census & demographics
- Census place
- Huntington Beach, CA
- County
- Orange County · 3,096,323 people
- City population
- 194,835
- Metro
- Los Angeles-Long Beach-Anaheim, CA
- Population (ZIP)
- 54,615
- Household income
- $130,672
- Rent vs Own
- Severe rent burden
- 1226.0
Population outlook (Orange County) Hauer SSP2
- Today (2025)
- 3,477,456 people
- By 2030
- 3,613,117 · +3.9%
- By 2040
- 3,835,945 · +10.3%
- By 2050
- 3,968,736 · +14.1%
- By 2075
- 4,097,053 · +17.8%
- By 2100
- 3,903,633 · +12.3%
Race, ethnicity, and origin ACS 2023
- Neighborhood character
- Diverse neighborhood (Simpson 0.56)
- Race & ethnicity
- White 63% Hispanic / Latino 16% Asian 13% Two or more races 13%
- Hispanic origin (detail)
- Mexican 11%
- Common ancestry
- Italian 3% Romanian 2% Lithuanian 2%
- Foreign-born
- 15% · Vietnam, Canada, China
- Languages at home
- 80% English-only · Spanish 7% Vietnamese 5% Chinese 2%
Political lean MEDSL · Orange
- 2024 margin
- Toss-up / Even · D 49.7% · R 47.1% · Other 3.2%
- 2008→2024 swing
- +5.2pp toward D · 2008: -2.6pp · 2024: 2.6pp
- All cycles
- 2024: D+2.6 2020: D+9.0 2016: D+7.7 2012: R+8.3 2008: R+2.6
Not yet ingested
- Civics
- —
Market trends
- HPI YoY
- ▼ -1082.92%
- Current HPI
- 459.3987
- Rent YoY
- ▲ 1.20%
- Metro
- Los Angeles-Long Beach-Anaheim, CA
- State GDP YoY
- ▲ 3.21%
- F500 in state
- 116
Industry mix (Fortune 500 HQ in CA)
| Industry | F500 HQs | Revenue |
|---|---|---|
| Technology | 27 | $1,492B |
|
||
| Financial Services | 3 | $174B |
|
||
| Retail | 3 | $44B |
|
||
| Insurance | 3 | $26B |
|
||
| Media / Entertainment | 2 | $115B |
|
||
| Pharmaceuticals / Biotech | 2 | $62B |
|
||
Price history
+461.1% since first listed3 events — show timeline
- 2026-06-09 Listed $335,000 CRMLS
- 2013-01-19 Listing Removed — CRMLS
- 2012-08-22 Listed $59,700 CRMLS
Property tax history
-3.4%/yrLatest (2025): $802 · -0.4% YoY. Source: county tax records.
Cash-flow waterfall
monthlySold comps — $/sqft
last 12 mo · ≤1 miLoading sold comps…