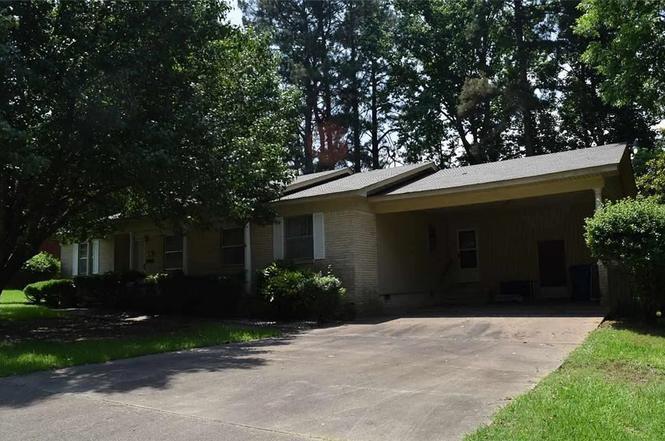
921 Willow · Malvern, AR
Flood risk 1/10 · Minimal
- FEMA flood zone
- X (unshaded)
- Chance of flooding over 30 yrs
- 0.0%
- Est. flood insurance / yr
- $507 – $1,088
Fire risk 4/10 · Minor
- Est. fire insurance / yr
- $1,499 – $2,785
Heat risk 6/10 · Moderate
- Hot days now (above 110°F)
- 7 days/yr
- Hot days in 30 yrs
- 20 days/yr
Wind risk 4/10 · Minor
- Chance of severe wind over 30 yrs
- 17.0%
Air-quality risk 2/10 · Minimal
- Unhealthy air days now
- 0 days/yr
- Unhealthy air days in 30 yrs
- 1 days/yr
Risk factors via First Street. Map © Google.
Why this score? — see what drove the C- grade
The composite is a weighted blend of 9 inputs, each scored 0–100. Each bar is that input's sub-score; the figure is the points it added to the 100-point composite (weight × sub-score).
- Cash flow +19.4/30.0
- ARV discount +15.0/15.0
- DSCR +6.1/10.0
- 1% rule +4.3/10.0
- Livability +3.1/5.0
- Rent growth +2.5/5.0
- Condition / age +2.5/5.0
- Schools +1.8/10.0
- Appreciation +0.0/10.0
$145,000
🖨 Deal sheet (PDF) 📄 Offer letter ✓ Due diligence
Listing remarks MLS
If you are searching for a quality built brick home near I-30 with easy access to Lake Catherine, DeGray Lake, and Lake Hamilton-then you need to take a tour of this 3 Bedroom 2 Bath home in Malvern, Arkansas! This one owner home offers a peace of mind with new roof, newer appliances, etc. Formal Living, Formal Dining, Large Master Suite and master bath offering double vanity; Spacious backyard boasting a unique spring feed pond and large storage building. Perfect for family barbecues and outdoor entertaining!
Key facts
- Extra storage
- Storage building
- New water heater
Tags
Property features AI
Finance
- HOA & community: Monthly association fee
Exterior
- Parking: Attached garage with automatic door opener; 2 covered parking spaces; Asphalt driveway
- Security: Fire sprinkler system; Smoke detectors
- Utilities: Electricity available; Natural gas available; Public water; Water service available
- Home design: Single-story property; Brick exterior; Built 25+ years ago; Asphalt shingle roof; Brick/mortar foundation
- Construction: Brick construction
- Exterior features: Split-possible lot; Public road frontage
Interior
- Flooring: Luxury vinyl plank flooring
- Bathrooms: 2 full bathrooms
- Heating & cooling: Central heating; Central air conditioning; Electric water heater
- Interior features: No additional interior features listed
Neighborhood map
What this means for you Summary
Snapshot
- This is a 3-bed/2.0-bath single-family listed at $145k.
Deal economics
- At list price, monthly cash flow is $161 ($2k/yr) — positive.
- The deal already cash-flows at list — no discount required.
- To meet the 1% rule (rent ≥ 1% of price), the offer needs to be $135k (6.9% below list).
- Recommended offer: $135k (6.9% below list) — sets the bar for 1% rule.
- Cap rate 7.6% vs local median 5.1% in Malvern — top-decile yield for the area; either an underpriced asset or a hidden risk that comps aren't pricing in. Stress-test before assuming the spread holds.
Location & tenants
- Location reads 62/100 on livability (#215 in AR) — a middle-class / working-renter tenant base. Strengths: cost of living A+, housing A+, health & safety A-; Watch: crime F, amenities F, commute F.
- Malvern School District (town): math 21% / reading 22% proficiency, ranked #207 of 238 in AR (top 87%) — low school quality limits family demand, transient renter base, plan for 1-2y turnover; 64% free/reduced lunch — lower-income household profile, screen leases tightly.
- Zoned schools: Malvern Elementary School (math 28% / reading 20%, grade F, #359 of 454 statewide, top 79%, 701 students, 77% FRL); Malvern Junior High School (math 24% / reading 24%, grade F, #170 of 201 statewide, top 86%, 299 students, 75% FRL); Malvern High School (math 14% / reading 25%, grade F, #239 of 292 statewide, top 85%, 575 students, 66% FRL).
- Market conditions: 171 active listings in the ZIP; 1 comparable units currently listed for rent nearby; 4 units permitted in Hot Spring County in 2024 (0 in 5+ unit buildings).
Forward outlook
- Local home prices are declining (-3.0%/yr); year-one equity from $1k of loan paydown is wiped out by about $4k of value loss. Plan a longer hold.
- Hot Spring County population projected to shrink 3% by 2050 — rents likely to lag national; underwrite the cash flow, not the appreciation.
Negotiation context
- Only 2 days on market — expect competitive offers; lowballing is unlikely to land.
- 7 sale attempts since 10y ago with the ask held roughly flat each time — persistent listings suggest the price (not the market) is what's stuck; bring a comps-based counter.
- Current owner paid $100k; 45% above their basis — modest negotiation headroom, anchor on the comps not their cost.
Risks & watch-outs
- Climate carrying-cost: extreme-heat days projected 7→20/yr by 2055 (HVAC capex compounding) — expect insurance premiums to compound above CPI over the hold.
Questions for the listing agent
- Built in 1965 — when were the roof, HVAC, electrical panel, plumbing, and water heater last replaced?
- Is there a deadline driving the sale (1031 exchange, divorce, estate, relocation)? That informs how much negotiation room exists.
- Schools are D-rated, which usually means shorter tenancies and higher turnover. Who's the typical renter profile here, and what's been the actual vacancy rate?
- Crime grade is F in this area — have there been break-ins, vandalism, or insurance claims at this property in the last 3 years? What carrier currently insures it and at what premium?
- What's the average days-on-market for RENTAL listings here right now (not sales)? A rising rental-DOM trend means longer vacancies and softer asking-rent achievability than the comps imply.
- What's the recent tenant-quality profile in this submarket — average credit score on applications, eviction rate, late-payment / NSF rate, and stable-employment percentage? A property-management company in the area should have these aggregated.
- How much new for-sale + rental construction is in the pipeline within 1–3 miles? Heavy new supply typically softens prices + rents 12–24 months out; constrained supply supports both.
Investment metrics
- 1% rule
- 0.93% ✗
- Cap rate
- 7.63%
- Cash-on-cash
- 4.76%
- DSCR
- 1.21
- GRM
- 9.0
CMA / ARV
- ARV (on-the-fly)
- $200,850
- Comps found
- 12
Show comp detail 12 sales within ~0.75 mi
| Address | Dist | Beds/Ba | Sqft | Sold | Price | $/sf | Match |
|---|---|---|---|---|---|---|---|
| 1700 Texas St | 0.13mi | 3/2.0 | 1,928 (-1%) | 7mo | $175,000 | $91 | 87 |
| 819 Hall St | 0.29mi | 3/2.0 | 1,948 (-0%) | 4mo | $236,000 | $121 | 83 |
| 1117 Pine Bluff St | 0.46mi | 3/2.0 | 2,012 (+3%) | 2mo | $105,000 | $52 | 71 |
| 718 Mcbee St | 0.55mi | 3/2.0 | 1,841 (-6%) | 1mo | $42,000 | $23 | 64 |
| 1616 Pine Bluff St | 0.64mi | 3/2.0 | 1,912 (-2%) | 6mo | $250,000 | $131 | 61 |
| 1521 Locust St | 0.62mi | 3/3.0 | 1,947 (-0%) | 11mo | $200,000 | $103 | 57 |
| 2106 Taylor St | 0.55mi | 2/1.5 (-1) | 1,860 (-5%) | 4mo | $196,000 | $105 | 56 |
| 722 Pine Bluff St | 0.49mi | 4/2.0 (+1) | 2,182 (+12%) | 5mo | $120,000 | $55 | 48 |
| 1503 Dogwood Trl | 0.70mi | 3/2.0 | 2,136 (+10%) | 4mo | $64,500 | $30 | 48 |
| 816 Pine Bluff St | 0.48mi | 3/2.0 | 2,212 (+13%) | 11mo | $235,000 | $106 | 46 |
| 2139 S Main St St | 0.55mi | 4/2.0 (+1) | 1,740 (-11%) | 13mo | $198,000 | $114 | 40 |
| 1625 Circle Dr | 0.67mi | 4/3.0 (+1) | 2,228 (+14%) | 4mo | $169,000 | $76 | 33 |
Match score weights: distance 35% · size 25% · config 20% · recency 20%. Top-matched comps best support the ARV.
Projected returns pro-forma
-3.0% appreciation · 3.0% rent growth · sell at horizon
- IRR
- -8.9%
- Equity multiple
- 0.67×
- Total profit
- $-13,276
- Equity at exit
- $21,620
- IRR
- 0.5%
- Equity multiple
- 1.04×
- Total profit
- $1,491
- Equity at exit
- $12,537
Cash invested: $40,600 (down + closing). Projections, not guarantees.
Landlord ↔ Tenant lean methodology
- Overall (STATE)
- 92 Strongly Landlord-Friendly
- State Arkansas
- 92 Strongly Landlord-Friendly · R+14
- County
- — inherits STATE
- City
- — inherits STATE
ZIP-level market 72104
- Home prices YoY
- -7.3%
- Active inventory
- 171
- Price-to-rent
- 9.0×
Monthly cashflow live
- Estimated rent
- $1,350 medium interval (Pro) →
- Mortgage (P&I)
- −$760
- Tax from tax record
- −$85 /mo · $1,015/yr
- Insurance
- −$60
- HOA
- −$0
- Vacancy / Maint / Mgmt
- −$284
- Net cashflow
- $161
Break-even live
Sensitivity live
| Price | -10% $243 | -5% $202 | +0% $161 | +5% $120 | +10% $79 |
|---|---|---|---|---|---|
| Rent | -10% $54 | -5% $108 | +0% $161 | +5% $214 | +10% $268 |
| Rate | -1.0pp $234 | -0.5pp $198 | base $161 | +0.5pp $124 | +1.0pp $85 |
UW: 25.0% down · 7.5% · 30yr · 1.5% tax · 5.0% vac · 8.0% maint · 8.0% mgmt
Financing live
Cash to close
- Down payment
- $36,250
- Closing costs
- $4,350
- Reserves months
- —
- Total cash needed
- —
Loan-product check · same deal, 3 products live
Conventional
25% down · 7.5% · 30yr
- Down + closing
- —
- Monthly P&I
- —
- Monthly cashflow
- —
- DSCR
- —
- Eligible?
- —
Personal DTI + credit; lowest rate.
DSCR
20% down · 8.5% · 30yr
- Down + closing
- —
- Monthly P&I
- —
- Monthly cashflow
- —
- DSCR
- —
- Eligible?
- —
No personal income docs; deal must DSCR.
Hard money
10% down · 12.0% · 12mo
- Down + closing
- —
- Monthly P&I
- —
- Monthly cashflow
- —
- DSCR
- —
- Eligible?
- —
Short-term bridge; refi at stabilization.
Rent comps 1 comps
| Address | Beds | Baths | Sqft | Rent | $/sqft | DOM | Units | Dist |
|---|---|---|---|---|---|---|---|---|
| 22767 U.S. 67 Malvern, AR | 3.0 | 2.0 | 1894 | $1,350 | $0.71 | 46d | 1 | 1.01mi |
Listing history 2 events
-
2026-06-22remarks 548-char remark
-
2026-06-22$145,000 Active 2 DOM
ⓘ Source: listings_history table (triggers on properties + properties_extension) + one-shot
backfill from property_details.listing_events for pre-trigger history.
Tax reassessment forecast AR · Resets to sale price
- Current annual tax
- $1,015 · $85/mo
- Projected year-2 tax
- $1,015 · $85/mo
- Expected delta
- $0/yr ($0/mo · 0.0%)
ⓘ Screening estimate from a state-policy table — verify with the county assessor before closing.
Climate risk First Street
- Flood 1/10 Low FEMA zone X (unshaded) · 0% chance over 30 yrs
- Wildfire 4/10 Moderate
- Heat 6/10 Major 7 d/yr ≥110°F today · 20 d/yr by 30 yrs out
- Wind 4/10 Moderate 17% chance of damaging wind over 30 yrs
- Air quality 2/10 Low 0 unhealthy d/yr today · 1 by 30 yrs out
Nearby sold comps map
Loading sold comps map…
Walkable amenities ~0.75 mi
Loading nearby amenities…
Taxation est. · year 1
- Rental income
- $16,200
- − Mortgage interest
- −$8,122
- − Property taxes
- −$1,015
- − Insurance
- −$725
- − Repairs & maintenance
- −$1,296
- − Management
- −$1,296
- − Depreciation
- −$4,218
- Taxable loss
- −$473
- Est. tax savings @ 24.0%
- +$113
- After-tax cash flow
- $2,046/yr
For passive investors: Depreciation is non-cash, so a rental often shows a tax loss while cash-flowing — sheltering income. Rental losses are passive: they offset passive income freely, and up to $25,000/yr can offset ordinary (W-2) income if you actively participate and your MAGI is under $100k (phasing out to $0 by $150k); unused losses carry forward. On sale, claimed depreciation is recaptured at up to 25%, and gains may owe capital-gains tax (a 1031 exchange can defer both). Figures are a year-1 estimate at your 24.0% rate — not tax advice; consult a CPA.
Schools (NCES district)
- District
- Malvern School District
- NCES district ID
- 0509240
- Math proficiency
- 21% ▼ -11.00%
- Reading proficiency
- 22% ▼ -9.00%
- Median HH income
- $35,370
- Composite
- 17.76/100
- National rank
- #9017
- State rank
- #207 of 238 in AR
Livability — Malvern
- Score
- 62/100
- State rank
- #215
- US rank
- #16632
Category grades
Schools grade is shown separately in the Schools card above.
Census & demographics
- Census place
- Malvern, AR
- Population (ZIP)
- 23,222
Population outlook (Hot Spring County) Hauer SSP2
- Today (2025)
- 34,464 people
- By 2030
- 34,659 · +0.6%
- By 2040
- 34,486 · +0.1%
- By 2050
- 33,419 · -3.0%
- By 2075
- 28,702 · -16.7%
- By 2100
- 21,415 · -37.9%
Race, ethnicity, and origin ACS 2023
- Neighborhood character
- Predominantly White (75%)
- Race & ethnicity
- White 75% Black 16% Two or more races 5% Hispanic / Latino 4%
- Common ancestry
- Serbian 2% Slovak 1% Iranian 1%
- Foreign-born
- 1% · Canada
- Languages at home
- 97% English-only · Spanish 3%
Political lean MEDSL · Hot Spring
- 2024 margin
- Solid R (+52.2) · D 22.9% · R 75.1% · Other 1.9%
- 2008→2024 swing
- -27.7pp toward R · 2008: -24.4pp · 2024: -52.2pp
- All cycles
- 2024: R+52.2 2020: R+48.7 2016: R+42.5 2012: R+29.0 2008: R+24.4
Not yet ingested
- Civics
- —
Market trends
- HPI YoY
- ▼ -16.79%
- Current HPI
- 211.6419
- Rent YoY
- —
- Metro
- —
- State GDP YoY
- ▲ 3.80%
- F500 in state
- 10
Industry mix (Fortune 500 HQ in AR)
| Industry | F500 HQs | Revenue |
|---|---|---|
| Retail | 1 | $681B |
|
||
| Food / Agriculture | 1 | $53B |
|
||
| Retail / Energy | 1 | $22B |
|
||
| Transportation / Logistics | 1 | $12B |
|
||
| Energy | 1 | $4B |
|
||
Price history
+12.4% since first listed21 events — show timeline
- 2026-06-17 Listed $145,000 NWARMLS
- 2019-02-12 Sold (Public Records) $100,000 Public Records
- 2019-02-11 Sold (MLS) $100,000 CARMLS
- 2018-12-17 Pending — CARMLS
- 2018-06-02 Listed $109,923 CARMLS
- 2017-10-28 Listing Removed — CARMLS
- 2017-09-22 Price Changed $96,500 CARMLS
- 2017-07-28 Listed $99,990 CARMLS
- 2017-06-17 Listing Removed — CARMLS
- 2017-05-18 Price Changed $99,990 CARMLS
- 2017-03-10 Price Changed $109,900 CARMLS
- 2017-03-10 Relisted — CARMLS
- 2017-02-17 Listing Removed — CARMLS
- 2016-11-18 Listed $114,900 CARMLS
- 2016-10-29 Listing Removed — CARMLS
- 2016-09-01 Price Changed $119,950 CARMLS
- 2016-07-19 Price Changed $124,500 CARMLS
- 2016-05-26 Relisted — CARMLS
- 2016-05-26 Listing Removed — CARMLS
- 2016-05-12 Price Changed $126,500 CARMLS
- 2016-03-03 Listed $129,000 CARMLS
Property tax history
+0.8%/yrLatest (2025): $1,015 · +0.0% YoY. Source: county tax records.
Cash-flow waterfall
monthlySold comps — $/sqft
last 12 mo · ≤1 miLoading sold comps…