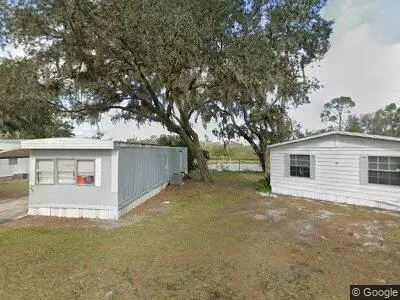
8535 Mathews Rd · Lakeland, FL
Flood risk 8/10 · Major
- FEMA flood zone
- X (unshaded)
- Chance of flooding over 30 yrs
- 0.99%
- Est. flood insurance / yr
- $507 – $1,088
Fire risk 4/10 · Minor
- Est. fire insurance / yr
- $947 – $1,759
Heat risk 8/10 · Major
- Hot days now (above 108°F)
- 7 days/yr
- Hot days in 30 yrs
- 21 days/yr
Wind risk 9/10 · Severe
- Chance of severe wind over 30 yrs
- 99.0%
Air-quality risk 2/10 · Minimal
- Unhealthy air days now
- 1 days/yr
- Unhealthy air days in 30 yrs
- 1 days/yr
Risk factors via First Street. Map © Google.
Why this score? — see what drove the D grade
The composite is a weighted blend of 9 inputs, each scored 0–100. Each bar is that input's sub-score; the figure is the points it added to the 100-point composite (weight × sub-score).
- Cash flow +15.0/30.0
- ARV discount +7.5/15.0
- 1% rule +5.0/10.0
- DSCR +5.0/10.0
- Livability +3.9/5.0
- Schools +3.5/10.0
- Rent growth +2.7/5.0
- Condition / age +2.5/5.0
- Appreciation +0.0/10.0
$37,500
🖨 Deal sheet (PDF) 📄 Offer letter ✓ Due diligence
Listing remarks
ocated on a desirable corner lot within a family-friendly community, this well-maintained 1984 mobile home offers 840 square feet of comfortable living space with 2 bedrooms and 2 bathrooms. The home features laminate flooring throughout, newer stainless steel appliances, and a functional layout designed for everyday living. A durable metal roof adds long-term value and peace of mind. The monthly lot rent includes water, sewer, trash, and lawn care with no pass-through taxes, making ownership both simple and affordable. Conveniently located near shopping, restaurants, schools, and major roadways, this property offers comfortable Florida living in a welcoming community.
Key facts
- Durable metal roof
- Laminate flooring
- Corner lot
Tags
Neighborhood map
What this means for you Summary
Snapshot
- This is a 3-bed/2.0-bath manufactured listed at $38k.
Deal economics
- At list price, monthly cash flow is $1k ($14k/yr) — positive.
- The deal already cash-flows at list — no discount required.
- Meets the 1% rule at list price ($2k rent vs $38k).
- Recommended offer: $36k (3.0% below list) — sets the bar for market timing.
Location & tenants
- Location reads 77/100 on livability (#206 in FL, #3,179 nationally) — a middle-class / working-renter tenant base. Strengths: cost of living A+, housing A+, health & safety A+; Watch: employment D+, amenities F, commute F.
- Polk (suburban): math 39% / reading 43% proficiency, ranked #62 of 73 in FL (top 85%) — families likely to look elsewhere, expect single-tenant / working-renter base with shorter leases.
- Market conditions: Rents flat; 259 active listings in the ZIP; 4 comparable units currently listed for rent nearby; rentals leasing fast (median 12d on market — plan ~1-2 weeks tenant-placement turnaround); 10,384 units permitted in Polk County in 2024 (1,716 in 5+ unit buildings).
- This rent runs 32% of the median local income ($70k/yr) — at the standard rent-burdened threshold; future hikes will face affordability resistance.
Forward outlook
- Local home prices are declining (-3.0%/yr); year-one equity from $259 of loan paydown is wiped out by about $1k of value loss. Plan a longer hold.
- Polk County population projected at +33% by 2050 — long-run rental-demand tailwind backs the buy-and-hold thesis.
- At projected returns (-3.0% appreciation + 0.7% rent growth), your $10k cash investment doubles in ~1 year — after that, you're playing with house money.
Negotiation context
- It's been on market 33 days — a 3% lower offer ($36k) is reasonable based on typical stale-listing flexibility.
- 5 sale attempts since 2y ago; this cycle's ask has dropped $3k (7%) from the opening price — seller is motivated, your offer sets the floor, not the list.
Risks & watch-outs
- Watch-outs: flood insurance adds $66/mo.
- Climate carrying-cost: severe flood risk; severe wind risk, 99% chance of damaging wind over 30y; extreme-heat days projected 7→21/yr by 2055 (HVAC capex compounding) — expect insurance premiums to compound above CPI over the hold.
Questions for the listing agent
- It's been on market 33 days. Have you received any prior offers? Is the seller open to a 3% concession, seller financing, or rate buy-down credit?
- What's the actual annual flood-insurance premium (NFIP or private), and is the property in a SFHA with mandatory coverage?
- Is there a deadline driving the sale (1031 exchange, divorce, estate, relocation)? That informs how much negotiation room exists.
- The area grade is low — what's the realistic commute time and amenity access for the typical tenant pool here? Any planned neighborhood developments (good or bad) we should know about?
- What's the average days-on-market for RENTAL listings here right now (not sales)? A rising rental-DOM trend means longer vacancies and softer asking-rent achievability than the comps imply.
- What's the recent tenant-quality profile in this submarket — average credit score on applications, eviction rate, late-payment / NSF rate, and stable-employment percentage? A property-management company in the area should have these aggregated.
- How much new for-sale + rental construction is in the pipeline within 1–3 miles? Heavy new supply typically softens prices + rents 12–24 months out; constrained supply supports both.
Investment metrics
- 1% rule
- 5.04% ✓
- Cap rate
- 45.82%
- Cash-on-cash
- 141.18%
- DSCR
- 7.28
- GRM
- 1.7
CMA / ARV
No comps found within radius.
Projected returns pro-forma
-3.0% appreciation · 0.65% rent growth · sell at horizon
- IRR
- —
- Equity multiple
- 7.10×
- Total profit
- $64,067
- Equity at exit
- $5,591
- IRR
- —
- Equity multiple
- 13.84×
- Total profit
- $134,820
- Equity at exit
- $3,242
Cash invested: $10,500 (down + closing). Projections, not guarantees.
Landlord ↔ Tenant lean methodology
- Overall (STATE)
- 87 Strongly Landlord-Friendly
- State Florida
- 87 Strongly Landlord-Friendly · R+3
- County
- — inherits STATE
- City
- — inherits STATE
ZIP-level market 33809
- Home prices YoY
- -20.9%
- Rents YoY
- 0.7%
- Active inventory
- 259
- Price-to-rent
- 1.7×
Monthly cashflow live
- Estimated rent
- $1,892 medium interval (Pro) →
- Mortgage (P&I)
- −$197
- Tax est. 1.5%
- −$47 /mo · $562/yr
- Insurance
- −$16
- Flood insurance flood zone
- −$66 /mo · $798/yr
- HOA
- −$0
- Vacancy / Maint / Mgmt
- −$397
- Net cashflow
- $1,169
Break-even live
Sensitivity live
| Price | -10% $1,195 | -5% $1,182 | +0% $1,169 | +5% $1,156 | +10% $1,143 |
|---|---|---|---|---|---|
| Rent | -10% $1,019 | -5% $1,094 | +0% $1,169 | +5% $1,244 | +10% $1,318 |
| Rate | -1.0pp $1,188 | -0.5pp $1,178 | base $1,169 | +0.5pp $1,159 | +1.0pp $1,149 |
UW: 25.0% down · 7.5% · 30yr · 1.5% tax · 5.0% vac · 8.0% maint · 8.0% mgmt
Financing live
Cash to close
- Down payment
- $9,375
- Closing costs
- $1,125
- Reserves months
- —
- Total cash needed
- —
Loan-product check · same deal, 3 products live
Conventional
25% down · 7.5% · 30yr
- Down + closing
- —
- Monthly P&I
- —
- Monthly cashflow
- —
- DSCR
- —
- Eligible?
- —
Personal DTI + credit; lowest rate.
DSCR
20% down · 8.5% · 30yr
- Down + closing
- —
- Monthly P&I
- —
- Monthly cashflow
- —
- DSCR
- —
- Eligible?
- —
No personal income docs; deal must DSCR.
Hard money
10% down · 12.0% · 12mo
- Down + closing
- —
- Monthly P&I
- —
- Monthly cashflow
- —
- DSCR
- —
- Eligible?
- —
Short-term bridge; refi at stabilization.
Rent comps 4 comps
| Address | Beds | Baths | Sqft | Rent | $/sqft | DOM | Units | Dist |
|---|---|---|---|---|---|---|---|---|
| 8006 Brookeshire Dr Lakeland, FL | 3.0 | 2.0 | 1301 | $1,890 | $1.45 | 20d | 1 | 0.92mi |
| 8039 Ridgeglen Cir E Lakeland, FL | 3.0 | 2.0 | 1384 | $1,895 | $1.37 | 11d | 1 | 1.28mi |
| 858 Fox Lake Dr Unit 858 Lakeland, FL | 3.0 | 2.0 | 1302 | $1,495 | $1.15 | 11d | 1 | 1.37mi |
| 734 Fox Lake Dr Lakeland, FL | 3.0 | 2.0 | 1337 | $1,910 | $1.43 | 4d | 1 | 1.48mi |
Listing history 26 events
-
2026-06-18days on market $37,500 Active 33 DOM
-
2026-06-17days on market $37,500 Active 32 DOM
-
2026-06-16pricedays on market $37,500 Active 31 DOM
-
2026-06-15days on market $40,500 Active 30 DOM
-
2026-06-13days on market $40,500 Active 28 DOM
-
2026-06-10days on market $40,500 Active 25 DOM
-
2026-06-09days on market $40,500 Active 24 DOM
-
2026-06-08days on market $40,500 Active 23 DOM
-
2026-06-07days on market $40,500 Active 22 DOM
-
2026-06-05days on market $40,500 Active 19 DOM
-
2026-06-03days on market $40,500 Active 17 DOM
-
2026-06-01days on market $40,500 Active 16 DOM
-
2026-05-31days on market $40,500 Active 15 DOM
-
2026-05-16$40,500 Active
-
2024-11-13historical $950
-
2024-11-10historical $950
-
2024-11-08$950
-
2024-11-08$1,050
-
2024-09-27historical $1,100
-
2024-09-25$1,100
-
2024-09-25historical $1,350
-
2024-09-24$1,350
-
2015-11-23soldstatus $1,125,000
-
2005-01-21soldstatus $1,300,000
-
1984-04-01soldstatus $228,300
-
1983-09-01soldstatus $28,100
ⓘ Source: listings_history table (triggers on properties + properties_extension) + one-shot
backfill from property_details.listing_events for pre-trigger history.
Climate risk First Street
- Flood 8/10 Severe FEMA zone X (unshaded) · 99% chance over 30 yrs
- Wildfire 4/10 Moderate
- Heat 8/10 Severe 7 d/yr ≥108°F today · 21 d/yr by 30 yrs out
- Wind 9/10 Extreme 99% chance of damaging wind over 30 yrs
- Air quality 2/10 Low 1 unhealthy d/yr today · 1 by 30 yrs out
Nearby sold comps map
Loading sold comps map…
Walkable amenities ~0.75 mi
Loading nearby amenities…
Taxation est. · year 1
- Rental income
- $22,701
- − Mortgage interest
- −$2,101
- − Property taxes
- −$562
- − Insurance
- −$985
- − Repairs & maintenance
- −$1,816
- − Management
- −$1,816
- − Depreciation
- −$1,091
- Taxable income
- $14,330
- Est. tax owed @ 24.0%
- −$3,439
- After-tax cash flow
- $10,587/yr
For passive investors: Depreciation is non-cash, so a rental often shows a tax loss while cash-flowing — sheltering income. Rental losses are passive: they offset passive income freely, and up to $25,000/yr can offset ordinary (W-2) income if you actively participate and your MAGI is under $100k (phasing out to $0 by $150k); unused losses carry forward. On sale, claimed depreciation is recaptured at up to 25%, and gains may owe capital-gains tax (a 1031 exchange can defer both). Figures are a year-1 estimate at your 24.0% rate — not tax advice; consult a CPA.
Schools (NCES district)
- District
- Polk
- NCES district ID
- 1201590
- Math proficiency
- 39% ▼ -11.00%
- Reading proficiency
- 43% ▼ -4.00%
- Median HH income
- $43,979
- Composite
- 34.74/100
- National rank
- #5132
- State rank
- #62 of 73 in FL
Livability — Lakeland
- Score
- 77/100
- State rank
- #206
- US rank
- #3179
Category grades
Schools grade is shown separately in the Schools card above.
Census & demographics
- County
- Polk County · 740,051 people
- City population
- 277,690
- Metro
- Lakeland-Winter Haven, FL
- Population (ZIP)
- 30,797
- Household income
- $70,066
- Rent vs Own
- Severe rent burden
- 924.0
Population outlook (Polk County) Hauer SSP2
- Today (2025)
- 752,975 people
- By 2030
- 804,621 · +6.9%
- By 2040
- 906,117 · +20.3%
- By 2050
- 1,000,476 · +32.9%
- By 2075
- 1,197,520 · +59.0%
- By 2100
- 1,271,518 · +68.9%
Race, ethnicity, and origin ACS 2023
- Neighborhood character
- Diverse neighborhood (Simpson 0.55)
- Race & ethnicity
- White 63% Hispanic / Latino 18% Black 11% Two or more races 11% Asian 3%
- Hispanic origin (detail)
- Puerto Rican 9% Cuban 1% Dominican 2%
- Common ancestry
- Lithuanian 2% Italian 2% Romanian 2%
- Foreign-born
- 11% · Canada, Jamaica
- Languages at home
- 81% English-only · Spanish 15% Other Asian/Pacific 2% Other Indo-European 1%
Political lean MEDSL · Polk
- 2024 margin
- Strong R (+20.7) · D 39.2% · R 59.9%
- 2008→2024 swing
- -14.6pp toward R · 2008: -6.1pp · 2024: -20.7pp
- All cycles
- 2024: R+20.7 2020: R+14.4 2016: R+14.1 2012: R+6.8 2008: R+6.1
Not yet ingested
- Civics
- —
Market trends
- HPI YoY
- ▼ -79.46%
- Current HPI
- 301.3054
- Rent YoY
- ▲ 0.65%
- Metro
- Lakeland-Winter Haven, FL
- State GDP YoY
- ▲ 3.28%
- F500 in state
- 36
Industry mix (Fortune 500 HQ in FL)
| Industry | F500 HQs | Revenue |
|---|---|---|
| Industrial Technology | 2 | $29B |
|
||
| Insurance | 2 | $17B |
|
||
| Retail | 1 | $60B |
|
||
| Technology Distribution | 1 | $58B |
|
||
| Homebuilding | 1 | $35B |
|
||
| Technology Manufacturing | 1 | $35B |
|
||
Price history
+44.1% since first listed13 events — show timeline
- 2026-05-16 Listed $40,500 FSBO.com
- 2024-11-13 Rental Removed $950 RENTALBEAST
- 2024-11-10 Rental Removed $950 RENTALBEAST
- 2024-11-08 Listed for Rent $950 RENTALBEAST
- 2024-11-08 Listed for Rent $1,050 RENTALBEAST
- 2024-09-27 Rental Removed $1,100 RENTALBEAST
- 2024-09-25 Listed for Rent $1,100 RENTALBEAST
- 2024-09-25 Rental Removed $1,350 RENTALBEAST
- 2024-09-24 Listed for Rent $1,350 RENTALBEAST
- 2015-11-23 Sold (Public Records) $1,125,000 Public Records
- 2005-01-21 Sold (Public Records) $1,300,000 Public Records
- 1984-04-01 Sold (Public Records) $228,300 Public Records
- 1983-09-01 Sold (Public Records) $28,100 Public Records
Property tax history
+5.8%/yrLatest (2025): $32,069 · +17.7% YoY. Source: county tax records.
Cash-flow waterfall
monthlySold comps — $/sqft
last 12 mo · ≤1 miLoading sold comps…