1504 Martin St · Indianapolis city (balance), IN
Flood risk 1/10 · Minimal
- FEMA flood zone
- X (unshaded)
- Chance of flooding over 30 yrs
- 0.0%
- Est. flood insurance / yr
- $507 – $1,088
Fire risk 1/10 · Minimal
- Est. fire insurance / yr
- $717 – $1,331
Heat risk 3/10 · Minor
- Hot days now (above 101°F)
- 7 days/yr
- Hot days in 30 yrs
- 19 days/yr
Wind risk 2/10 · Minimal
- Chance of severe wind over 30 yrs
- 1.0%
Air-quality risk 3/10 · Minor
- Unhealthy air days now
- 2 days/yr
- Unhealthy air days in 30 yrs
- 3 days/yr
Risk factors via First Street. Map © Google.
Why this score? — see what drove the C+ grade
The composite is a weighted blend of 9 inputs, each scored 0–100. Each bar is that input's sub-score; the figure is the points it added to the 100-point composite (weight × sub-score).
- Cash flow +24.2/30.0
- ARV discount +15.0/15.0
- DSCR +7.8/10.0
- 1% rule +5.5/10.0
- Rent growth +3.1/5.0
- Livability +2.5/5.0
- Condition / age +2.5/5.0
- Schools +1.4/10.0
- Appreciation +0.0/10.0
$110,000
🖨 Deal sheet (PDF) 📄 Offer letter ✓ Due diligence
Listing remarks
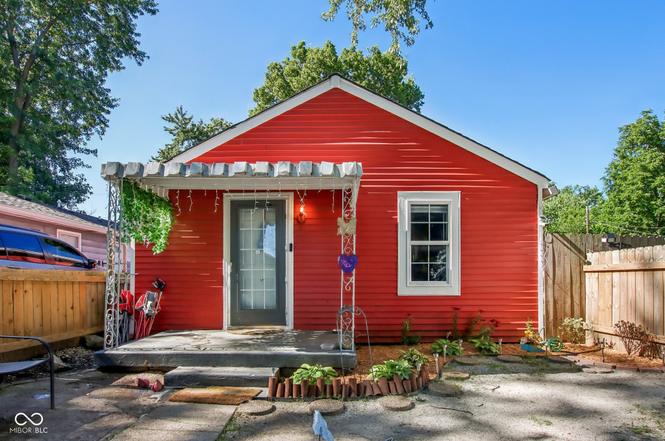
Opportunity is knocking. .. Loudly. This charming red bungalow in Perry Township is priced at just $110,000 and ready for its next chapter. Open living area, 2 bedrooms, a full bath, and a fantastic private space in back. Yes, it needs some work, but at this price you have room to make it your own and still come out ahead. Investors, first-time buyers, and flippers take note: deals like this don't last. Schedule your showing today!
Key facts
- Open living area
- 5,271 sq ft lot
- Garage
Tags
Property features AI
Exterior
- Parking: Assigned outside parking on gravel
- Utilities: Public water; Municipal sewer connected; Natural gas connected; Solid waste service available
- Home design: Single-family residence; One story; Residential property; Property condition: fixer
- Construction: Vinyl siding; Block foundation
- Exterior features: Deck; Full fencing with gate (front yard); Mature trees; Located on a cul-de-sac; Not in a subdivision
Interior
- Kitchen: Electric oven; Refrigerator; Eat-in kitchen
- Bedrooms: 2 bedrooms (both on the main level)
- Bathrooms: 1 full bathroom with a tub and shower
- Heating & cooling: Forced air heating (natural gas); Central air conditioning
- Interior features: Attic access; Eat-in kitchen; Laundry in unit
- Laundry & utility: Washer and dryer included; Main-level laundry room
Neighborhood map
What this means for you Summary
Snapshot
- This is a 2-bed/1.0-bath single-family listed at $110k.
Deal economics
- At list price, monthly cash flow is $220 ($3k/yr) — positive.
- The deal already cash-flows at list — no discount required.
- Meets the 1% rule at list price ($1k rent vs $110k).
- Cap rate 8.7% vs local median 4.4% in Indianapolis city (balance) — top-decile yield for the area; either an underpriced asset or a hidden risk that comps aren't pricing in. Stress-test before assuming the spread holds.
Location & tenants
- Location reads: area grade C — affects rentability + tenant quality, not the cash-flow math above.
- Indianapolis Public Schools (urban): math 14% / reading 20% proficiency, ranked #286 of 301 in IN (top 95%) — low school quality limits family demand, transient renter base, plan for 1-2y turnover; 77% free/reduced lunch — lower-income household profile, screen leases tightly.
- Zoned schools: Raymond F Brandes School 65 (math 17% / reading 17%, grade F, #837 of 994 statewide, top 86%, 150 students, 83% FRL); H L Harshman Middle School (math 3% / reading 16%, grade F, #316 of 330 statewide, top 96%, 549 students, 84% FRL); Emmerich Manual High School (math 8% / reading 32%, grade F, #345 of 369 statewide, top 95%, 83 students, 64% FRL) — zoned schools at 77% FRL track the district average.
- Market conditions: Rents rising (+2.5%/yr); 248 active listings in the ZIP; 40 comparable units currently listed for rent nearby; rentals leasing fast (median 13d on market — plan ~1-2 weeks tenant-placement turnaround); 1,906 units permitted in Marion County in 2024 (621 in 5+ unit buildings).
Forward outlook
- Local home prices are declining (-3.0%/yr); year-one equity from $761 of loan paydown is wiped out by about $3k of value loss. Plan a longer hold.
- Marion County population projected at +18% by 2050 — long-run rental-demand tailwind backs the buy-and-hold thesis.
Negotiation context
- Only 6 days on market — expect competitive offers; lowballing is unlikely to land.
- 12 sale attempts since 24y ago with the ask held roughly flat each time — persistent listings suggest the price (not the market) is what's stuck; bring a comps-based counter.
- Current owner paid $45k; list at $110k implies a 144% gain — meaningful room to come down on a strong offer.
Risks & watch-outs
- Watch-outs: built in 1936 — expect roof / HVAC / electrical / plumbing capex.
Questions for the listing agent
- Built in 1936 — when were the roof, HVAC, electrical panel, plumbing, and water heater last replaced?
- Is there a deadline driving the sale (1031 exchange, divorce, estate, relocation)? That informs how much negotiation room exists.
- What's the average days-on-market for RENTAL listings here right now (not sales)? A rising rental-DOM trend means longer vacancies and softer asking-rent achievability than the comps imply.
- What's the recent tenant-quality profile in this submarket — average credit score on applications, eviction rate, late-payment / NSF rate, and stable-employment percentage? A property-management company in the area should have these aggregated.
- How much new for-sale + rental construction is in the pipeline within 1–3 miles? Heavy new supply typically softens prices + rents 12–24 months out; constrained supply supports both.
Investment metrics
- 1% rule
- 1.05% ✓
- Cap rate
- 8.70%
- Cash-on-cash
- 8.58%
- DSCR
- 1.38
- GRM
- 7.9
CMA / ARV
- ARV (on-the-fly)
- $151,866
- Comps found
- 12
Show comp detail 12 sales within ~0.75 mi
| Address | Dist | Beds/Ba | Sqft | Sold | Price | $/sf | Match |
|---|---|---|---|---|---|---|---|
| 1120 Bacon St | 0.35mi | 2/1.0 | 832 (-3%) | 2mo | $103,950 | $125 | 77 |
| 1124 E Murry St | 0.33mi | 3/1.0 (+1) | 840 (-2%) | 1mo | $93,000 | $111 | 76 |
| 3033 Asbury St | 0.25mi | 3/1.0 (+1) | 912 (+6%) | 0mo | $139,900 | $153 | 72 |
| 2876 Tindall St | 0.38mi | 2/1.0 | 912 (+6%) | 2mo | $75,000 | $82 | 71 |
| 2822 Tindall St | 0.47mi | 3/1.0 (+1) | 864 (+1%) | 5mo | $185,000 | $214 | 68 |
| 3057 Dawson St | 0.36mi | 3/1.0 (+1) | 936 (+9%) | 1mo | $185,000 | $198 | 62 |
| 1620 Norton Ave | 0.42mi | 3/1.0 (+1) | 928 (+8%) | 2mo | $119,900 | $129 | 60 |
| 1901 Martin St | 0.27mi | 3/1.0 (+1) | 975 (+14%) | 5mo | $173,000 | $177 | 56 |
| 1820 Martin St | 0.24mi | 3/1.0 (+1) | 975 (+14%) | 8mo | $153,000 | $157 | 55 |
| 2343 Cameron St | 0.73mi | 2/1.0 | 768 (-10%) | 3mo | $150,000 | $195 | 46 |
| 2301 Cameron St | 0.67mi | 2/1.0 | 768 (-10%) | 8mo | $165,000 | $215 | 45 |
| 711 E Perry St | 0.72mi | 2/1.0 | 740 (-14%) | 4mo | $155,000 | $209 | 40 |
Match score weights: distance 35% · size 25% · config 20% · recency 20%. Top-matched comps best support the ARV.
Projected returns pro-forma
-3.0% appreciation · 2.46% rent growth · sell at horizon
- IRR
- -3.9%
- Equity multiple
- 0.86×
- Total profit
- $-4,446
- Equity at exit
- $16,401
- IRR
- 5.2%
- Equity multiple
- 1.38×
- Total profit
- $11,559
- Equity at exit
- $9,511
Cash invested: $30,800 (down + closing). Projections, not guarantees.
Landlord ↔ Tenant lean methodology
- Overall (STATE)
- 90 Strongly Landlord-Friendly
- State Indiana
- 90 Strongly Landlord-Friendly · R+11
- County
- — inherits STATE
- City
- — inherits STATE
ZIP-level market 46227
- Rents YoY
- 2.5%
- Active inventory
- 248
- Price-to-rent
- 7.9×
Monthly cashflow live
- Estimated rent
- $1,154 high interval (Pro) →
- Mortgage (P&I)
- −$577
- Tax from tax record
- −$69 /mo · $827/yr
- Insurance
- −$46
- HOA
- −$0
- Vacancy / Maint / Mgmt
- −$242
- Net cashflow
- $220
Break-even live
Sensitivity live
| Price | -10% $283 | -5% $251 | +0% $220 | +5% $189 | +10% $158 |
|---|---|---|---|---|---|
| Rent | -10% $129 | -5% $175 | +0% $220 | +5% $266 | +10% $311 |
| Rate | -1.0pp $276 | -0.5pp $248 | base $220 | +0.5pp $192 | +1.0pp $163 |
UW: 25.0% down · 7.5% · 30yr · 1.5% tax · 5.0% vac · 8.0% maint · 8.0% mgmt
Financing live
Cash to close
- Down payment
- $27,500
- Closing costs
- $3,300
- Reserves months
- —
- Total cash needed
- —
Loan-product check · same deal, 3 products live
Conventional
25% down · 7.5% · 30yr
- Down + closing
- —
- Monthly P&I
- —
- Monthly cashflow
- —
- DSCR
- —
- Eligible?
- —
Personal DTI + credit; lowest rate.
DSCR
20% down · 8.5% · 30yr
- Down + closing
- —
- Monthly P&I
- —
- Monthly cashflow
- —
- DSCR
- —
- Eligible?
- —
No personal income docs; deal must DSCR.
Hard money
10% down · 12.0% · 12mo
- Down + closing
- —
- Monthly P&I
- —
- Monthly cashflow
- —
- DSCR
- —
- Eligible?
- —
Short-term bridge; refi at stabilization.
Rent comps 40 comps
| Address | Beds | Baths | Sqft | Rent | $/sqft | DOM | Units | Dist |
|---|---|---|---|---|---|---|---|---|
| 3146 Asbury St Indianapolis, IN | 2.0 | 1.0 | 728 | $850 | $1.17 | 9d | 1 | 0.20mi |
| 3311 Linden St Indianapolis, IN | 3.0 | 1.0 | 1056 | $1,150 | $1.09 | 45d | 1 | 0.24mi |
| 3334 Laurel St Indianapolis, IN | 3.0 | 1.0 | 1068 | $1,200 | $1.12 | 21d | 1 | 0.25mi |
| 3312 Olive St Indianapolis, IN | 3.0 | 2.0 | 1000 | $1,395 | $1.40 | 25d | 1 | 0.33mi |
| 2948 Shelby St Unit D Indianapolis, IN | 2.0 | 1.0 | 750 | $1,025 | $1.37 | 45d | 1 | 0.42mi |
| 1620 Norton Ave Indianapolis, IN | 3.0 | 1.0 | 928 | $1,395 | $1.50 | 0d | 1 | 0.43mi |
| 1620 Norton Ave Indianapolis, IN | 3.0 | 1.0 | 928 | $1,395 | $1.50 | 19d | 1 | 0.43mi |
| 1320 1/2 Norton Ave Indianapolis, IN | 2.0 | 1.0 | 785 | $920 | $1.17 | 23d | 1 | 0.43mi |
| 1144 McDougal St Indianapolis, IN | 3.0 | 1.0 | 876 | $1,500 | $1.71 | 23d | 1 | 0.51mi |
| 3765 S State Ave Indianapolis, IN | 2.0 | 1.0 | 700 | $995 | $1.42 | 25d | 1 | 0.55mi |
| 1549 Nelson Ave Indianapolis, IN | 3.0 | 1.0 | 950 | $1,380 | $1.45 | 45d | 1 | 0.57mi |
| 2714 Dawson St Indianapolis, IN | 3.0 | 1.0 | 912 | $1,500 | $1.64 | 0d | 1 | 0.65mi |
| 2633 S Randolph St Unit b Indianapolis, IN | 2.0 | 1.0 | 900 | $995 | $1.11 | 25d | 1 | 0.76mi |
| 2633 S Randolph St Indianapolis, IN | 2.0 | 1.0 | 900 | $995 | $1.11 | 12d | 1 | 0.76mi |
| 3206 S Temple Ave Indianapolis, IN | 2.0 | 1.0 | 784 | $1,080 | $1.38 | 25d | 1 | 0.77mi |
| 2555 Shelby St Unit 2559 Indianapolis, IN | 1.0 | 1.0 | 717 | $1,250 | $1.74 | 45d | 1 | 0.80mi |
| 1637 Hoefgen St Indianapolis, IN | 2.0 | 1.0 | 780 | $1,000 | $1.28 | 45d | 1 | 0.83mi |
| 2525 Shelby St Unit 1 Indianapolis, IN | 1.0 | 1.0 | 600 | $865 | $1.44 | 4d | 1 | 0.87mi |
| 2525 Shelby St Unit 4 Indianapolis, IN | 1.0 | 1.0 | 600 | $775 | $1.29 | 25d | 1 | 0.87mi |
| 2525 Shelby St Unit 4 Indianapolis, IN | 1.0 | 1.0 | 600 | $775 | $1.29 | 0d | 1 | 0.87mi |
| 2469 Dawson St Indianapolis, IN | 2.0 | 1.0 | 700 | $949 | $1.36 | 5d | 4 | 0.92mi |
| 2830 S East St Indianapolis, IN | 2.0 | 1.0 | 656 | $1,200 | $1.83 | 45d | 1 | 0.96mi |
| 2760 S East St Indianapolis, IN | 2.0–3.0 | 2.0 | 1072 | $895 | $0.83 | 5d | 3 | 0.99mi |
| 360 Sandra Ln Unit 110-062 Indianapolis, IN | 2.0 | 1.0 | 621 | $949 | $1.53 | 9d | 1 | 1.05mi |
| 360 Sandra Ln Unit 109-013 Indianapolis, IN | 2.0 | 1.0 | 621 | $1,029 | $1.66 | 6d | 1 | 1.05mi |
| 360 Sandra Ln Unit 314-D59 Indianapolis, IN | 2.0 | 1.0 | 621 | $1,011 | $1.63 | 5d | 1 | 1.05mi |
| 360 Sandra Ln Unit 319-D126 Indianapolis, IN | 2.0 | 1.0 | 621 | $960 | $1.55 | 4d | 1 | 1.05mi |
| 360 Sandra Ln Unit 110-064 Indianapolis, IN | 2.0 | 1.0 | 621 | $961 | $1.55 | 4d | 1 | 1.05mi |
| 360 Sandra Ln Unit 115-044 Indianapolis, IN | 2.0 | 1.0 | 621 | $999 | $1.61 | 5d | 1 | 1.05mi |
| 360 Sandra Ln Indianapolis, IN | 1.0–2.0 | 1.0 | 562 | $1,494 | $2.66 | 13d | 9 | 1.05mi |
| 1051 E Edwards Ave Indianapolis, IN | 2.0 | 1.0 | 896 | $1,150 | $1.28 | 45d | 1 | 1.07mi |
| 1604 E Kelly St Indianapolis, IN | 2.0 | 1.0 | 750 | $1,025 | $1.37 | 19d | 1 | 1.12mi |
| 1604 E Kelly St Indianapolis, IN | 2.0 | 1.0 | 800 | $1,025 | $1.28 | 12d | 1 | 1.12mi |
| 1409 E Tabor St Indianapolis, IN | 1.0 | 1.0 | 528 | $775 | $1.47 | 25d | 1 | 1.15mi |
| 3714 Bartlett Ave Indianapolis, IN | 1.0 | 1.0 | 576 | $969 | $1.68 | 6d | 4 | 1.17mi |
| 265 E Southern Ave Indianapolis, IN | 1.0–2.0 | 1.0 | 800 | $1,150 | $1.44 | 4d | 2 | 1.18mi |
| 1706 E Tabor St Unit 1708 Indianapolis, IN | 3.0 | 1.0 | 1000 | $1,300 | $1.30 | 9d | 1 | 1.19mi |
| 920 E Markwood Ave Indianapolis, IN | 1.0–2.0 | 1.0 | 838 | $949 | $1.13 | 9d | 2 | 1.19mi |
| 2315 Bischoff Dr Beech Grove, IN | 2.0 | 1.0 | 1065 | $848 | $0.80 | 25d | 2 | 1.22mi |
| 2430 Albany St Apt 01 Beech Grove, IN | 2.0 | 1.0 | 800 | $899 | $1.12 | 9d | 1 | 1.24mi |
Listing history 5 events
-
2026-06-21days on market $110,000 Active 6 DOM
-
2026-06-18days on market $110,000 Active 3 DOM
-
2026-06-17days on market $110,000 Active 2 DOM
-
2026-06-15remarks 435-char remark
-
2026-06-15$110,000 Active 1 DOM
ⓘ Source: listings_history table (triggers on properties + properties_extension) + one-shot
backfill from property_details.listing_events for pre-trigger history.
Tax reassessment forecast IN · Partial reset (capped growth)
- Current annual tax
- $827 · $69/mo
- Projected year-2 tax
- $881 · $73/mo
- Expected delta
- +$54/yr (+$4/mo · 6.5%)
ⓘ Screening estimate from a state-policy table — verify with the county assessor before closing.
Climate risk First Street
- Flood 1/10 Low FEMA zone X (unshaded) · 0% chance over 30 yrs
- Wildfire 1/10 Low
- Heat 3/10 Moderate 7 d/yr ≥101°F today · 19 d/yr by 30 yrs out
- Wind 2/10 Low 100% chance of damaging wind over 30 yrs
- Air quality 3/10 Moderate 2 unhealthy d/yr today · 3 by 30 yrs out
Nearby sold comps map
Loading sold comps map…
Walkable amenities ~0.75 mi
Loading nearby amenities…
Taxation est. · year 1
- Rental income
- $13,851
- − Mortgage interest
- −$6,162
- − Property taxes
- −$827
- − Insurance
- −$550
- − Repairs & maintenance
- −$1,108
- − Management
- −$1,108
- − Depreciation
- −$3,200
- Taxable income
- $896
- Est. tax owed @ 24.0%
- −$215
- After-tax cash flow
- $2,428/yr
For passive investors: Depreciation is non-cash, so a rental often shows a tax loss while cash-flowing — sheltering income. Rental losses are passive: they offset passive income freely, and up to $25,000/yr can offset ordinary (W-2) income if you actively participate and your MAGI is under $100k (phasing out to $0 by $150k); unused losses carry forward. On sale, claimed depreciation is recaptured at up to 25%, and gains may owe capital-gains tax (a 1031 exchange can defer both). Figures are a year-1 estimate at your 24.0% rate — not tax advice; consult a CPA.
Schools (NCES district)
- District
- Indianapolis Public Schools
- NCES district ID
- 1804770
- Math proficiency
- 14% ▼ -7.00%
- Reading proficiency
- 20% ▼ -3.00%
- Median HH income
- $32,034
- Composite
- 13.69/100
- National rank
- #9499
- State rank
- #286 of 301 in IN
Livability — Indianapolis city (balance)
No livability data for this city. (Only ~50 U.S. cities are tracked.)
Census & demographics
- Census place
- Indianapolis city (balance), IN
- County
- Marion County · 998,460 people
- City population
- 881,119
- Metro
- Indianapolis-Carmel-Anderson, IN
- Population (ZIP)
- 57,587
- Household income
- $53,629
- Rent vs Own
- Severe rent burden
- 3583.0
Population outlook (Marion County) Hauer SSP2
- Today (2025)
- 1,025,572 people
- By 2030
- 1,065,727 · +3.9%
- By 2040
- 1,141,577 · +11.3%
- By 2050
- 1,208,920 · +17.9%
- By 2075
- 1,367,288 · +33.3%
- By 2100
- 1,438,201 · +40.2%
Race, ethnicity, and origin ACS 2023
- Neighborhood character
- Diverse neighborhood (Simpson 0.59)
- Race & ethnicity
- White 61% Asian 12% Black 11% Hispanic / Latino 10% Two or more races 8%
- Hispanic origin (detail)
- Mexican 8%
- Common ancestry
- Italian 2% Slovak 2% Lithuanian 1%
- Foreign-born
- 17% · Philippines, Canada, Vietnam
- Languages at home
- 79% English-only · Other Asian/Pacific 9% Spanish 7% Other Indo-European 1%
Political lean MEDSL · Marion
- 2024 margin
- Strong D (+27.7) · D 63.0% · R 35.3% · Other 1.7%
- 2008→2024 swing
- -0.7pp no change · 2008: 28.4pp · 2024: 27.7pp
- All cycles
- 2024: D+27.7 2020: D+29.1 2016: D+22.8 2012: D+22.2 2008: D+28.4
Not yet ingested
- Civics
- —
Market trends
- HPI YoY
- ▼ -260.49%
- Current HPI
- 276.8271
- Rent YoY
- ▲ 2.46%
- Metro
- Indianapolis-Carmel-Anderson, IN
- State GDP YoY
- ▲ 2.90%
- F500 in state
- 18
Industry mix (Fortune 500 HQ in IN)
| Industry | F500 HQs | Revenue |
|---|---|---|
| Industrial Machinery | 2 | $37B |
|
||
| Healthcare | 1 | $177B |
|
||
| Pharmaceuticals | 1 | $45B |
|
||
| Metals / Steel | 1 | $18B |
|
||
| Agriculture | 1 | $17B |
|
||
| Packaging | 1 | $12B |
|
||
Price history
+120.4% since first listed25 events — show timeline
- 2026-06-15 Listed $110,000 MIBOR as Distributed by MLS Grid
- 2025-04-09 Listing Removed — MIBOR as Distributed by MLS Grid
- 2025-03-18 Price Changed $135,000 MIBOR as Distributed by MLS Grid
- 2025-03-04 Price Changed $145,000 MIBOR as Distributed by MLS Grid
- 2025-01-10 Listed $150,000 MIBOR as Distributed by MLS Grid
- 2019-02-11 Sold (Public Records) $45,000 Public Records
- 2010-11-02 Listing Removed — MIBOR as Distributed by MLS Grid
- 2010-06-25 Listed $40,000 MIBOR as Distributed by MLS Grid
- 2010-06-19 Listing Removed — MIBOR as Distributed by MLS Grid
- 2010-01-14 Listed $40,000 MIBOR as Distributed by MLS Grid
- 2008-02-20 Listing Removed — MIBOR as Distributed by MLS Grid
- 2007-07-03 Listed $39,900 MIBOR as Distributed by MLS Grid
- 2007-04-12 Listing Removed — MIBOR as Distributed by MLS Grid
- 2006-11-29 Listed $52,900 MIBOR as Distributed by MLS Grid
- 2006-06-01 Listed — MIBOR as Distributed by MLS Grid
- 2006-02-01 Listing Removed — MIBOR as Distributed by MLS Grid
- 2005-11-14 Listed $36,000 MIBOR as Distributed by MLS Grid
- 2005-10-01 Listing Removed — MIBOR as Distributed by MLS Grid
- 2005-06-13 Listed $42,900 MIBOR as Distributed by MLS Grid
- 2004-09-08 Listing Removed — MIBOR as Distributed by MLS Grid
- 2004-09-08 Listing Removed — MIBOR as Distributed by MLS Grid
- 2004-06-15 Listed $44,900 MIBOR as Distributed by MLS Grid
- 2003-09-29 Listed $49,900 MIBOR as Distributed by MLS Grid
- 2003-02-14 Listing Removed — MIBOR as Distributed by MLS Grid
- 2002-08-14 Listed $49,900 MIBOR as Distributed by MLS Grid
Property tax history
-1.0%/yrLatest (2025): $827 · +18.8% YoY. Source: county tax records.
Cash-flow waterfall
monthlySold comps — $/sqft
last 12 mo · ≤1 miLoading sold comps…