27459 Mary Kinchen Rd · Albany, LA
Flood risk No data
- FEMA flood zone
- —
- Chance of flooding over 30 yrs
- —
- Est. flood insurance / yr
- —
Fire risk No data
- Est. fire insurance / yr
- —
Heat risk No data
- Hot days now (above threshold)
- —
- Hot days in 30 yrs
- —
Wind risk No data
- Chance of severe wind over 30 yrs
- —
Air-quality risk No data
- Unhealthy air days now
- —
- Unhealthy air days in 30 yrs
- —
Risk factors via First Street. Map © Google.
Why this score? — see what drove the C- grade
The composite is a weighted blend of 9 inputs, each scored 0–100. Each bar is that input's sub-score; the figure is the points it added to the 100-point composite (weight × sub-score).
- Cash flow +19.0/30.0
- ARV discount +7.5/15.0
- DSCR +6.0/10.0
- 1% rule +5.1/10.0
- Schools +4.0/10.0
- Condition / age +4.0/5.0
- Livability +3.9/5.0
- Rent growth +2.5/5.0
- Appreciation +0.0/10.0
$159,800
🖨 Deal sheet 📄 Offer letter ✓ Due diligence
Listing remarks MLS
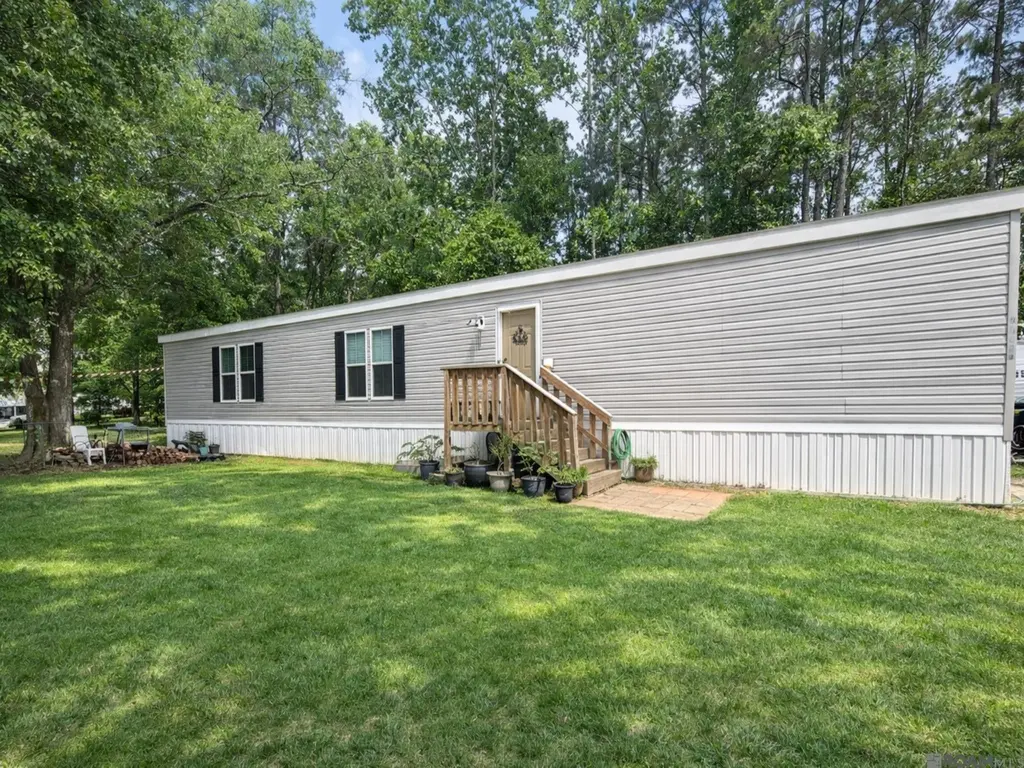
Welcome home to this beautifully maintained 3-year-old mobile home, perfectly situated on nearly one acre! Nestled on a quiet street, this property offers both privacy and space, with mature trees lining much of the lot for a peaceful setting. Inside, the open floor plan creates a welcoming atmosphere with plenty of room for entertaining family and friends. Step outside and enjoy the expansive yard--ideal for adding a shop, creating your dream outdoor space, or simply relaxing and taking in the surroundings. Don't miss the opportunity to own a move-in ready home with room to grow!
Key facts
- 0.77 acre lot
- 4 parking spots
- Built 2023
Neighborhood map
What this means for you Summary
Snapshot
- This is a 3-bed/2.0-bath manufactured listed at $160k. Condition is rated good.
Deal economics
- At list price, monthly cash flow is $165 ($2k/yr) — positive.
- The deal already cash-flows at list — no discount required.
- Meets the 1% rule at list price ($2k rent vs $160k).
- Recommended offer: $155k (3.0% below list) — sets the bar for market timing.
- Cap rate 7.5% vs local median 4.5% in Albany — top-decile yield for the area; either an underpriced asset or a hidden risk that comps aren't pricing in. Stress-test before assuming the spread holds.
Location & tenants
- Location reads 77/100 on livability (#12 in LA, #3,099 nationally) — a middle-class / working-renter tenant base. Strengths: schools A+, cost of living A+, housing A+; Watch: amenities F, commute F.
- Livingston Parish (suburban): math 40% / reading 52% proficiency, ranked #13 of 98 in LA (top 13%) — families likely to look elsewhere, expect single-tenant / working-renter base with shorter leases.
- Market conditions: 40 active listings in the ZIP; 794 units permitted in Livingston Parish in 2024 (99 in 5+ unit buildings).
Forward outlook
- Local home prices are declining (-3.0%/yr); year-one equity from $1k of loan paydown is wiped out by about $5k of value loss. Plan a longer hold.
- Livingston County population projected at +27% by 2050 — long-run rental-demand tailwind backs the buy-and-hold thesis.
Negotiation context
- It's been on market 45 days — a 3% lower offer ($155k) is reasonable based on typical stale-listing flexibility.
- 2 sale attempts with the ask held roughly flat each time — persistent listings suggest the price (not the market) is what's stuck; bring a comps-based counter.
Questions for the listing agent
- It's been on market 45 days. Have you received any prior offers? Is the seller open to a 3% concession, seller financing, or rate buy-down credit?
- Is there a deadline driving the sale (1031 exchange, divorce, estate, relocation)? That informs how much negotiation room exists.
- Schools are A-rated — typically a magnet for longer-tenancy family renters. What's the average tenant stay here, and is there a school-zone premium baked into asking?
- What's the average days-on-market for RENTAL listings here right now (not sales)? A rising rental-DOM trend means longer vacancies and softer asking-rent achievability than the comps imply.
- What's the recent tenant-quality profile in this submarket — average credit score on applications, eviction rate, late-payment / NSF rate, and stable-employment percentage? A property-management company in the area should have these aggregated.
- How much new for-sale + rental construction is in the pipeline within 1–3 miles? Heavy new supply typically softens prices + rents 12–24 months out; constrained supply supports both.
Investment metrics
- 1% rule
- 1.01% ✓
- Cap rate
- 7.54%
- Cash-on-cash
- 4.44%
- DSCR
- 1.20
- GRM
- 8.3
CMA / ARV
No comps found within radius.
Projected returns pro-forma
-3.0% appreciation · 3.0% rent growth · sell at horizon
- IRR
- -9.4%
- Equity multiple
- 0.66×
- Total profit
- $-15,334
- Equity at exit
- $23,827
- IRR
- 0.1%
- Equity multiple
- 1.01×
- Total profit
- $313
- Equity at exit
- $13,817
Cash invested: $44,744 (down + closing). Projections, not guarantees.
Landlord ↔ Tenant lean methodology
- Overall (STATE)
- 90 Strongly Landlord-Friendly
- State Louisiana
- 90 Strongly Landlord-Friendly · R+12
- County
- — inherits STATE
- City
- — inherits STATE
ZIP-level market 70711
- Home prices YoY
- -11.3%
- Active inventory
- 40
- Price-to-rent
- 8.3×
Monthly cashflow live
- Estimated rent
- $1,607 medium interval (Pro) →
- Mortgage (P&I)
- −$838
- Tax est. 1.5%
- −$200 /mo · $2,397/yr
- Insurance
- −$67
- HOA
- −$0
- Vacancy / Maint / Mgmt
- −$338
- Net cashflow
- $165
Break-even live
UW: 25.0% down · 7.5% · 30yr · 1.5% tax · 5.0% vac · 8.0% maint · 8.0% mgmt
Financing live
Cash to close
- Down payment
- $39,950
- Closing costs
- $4,794
- Reserves months
- —
- Total cash needed
- —
Loan-product check · same deal, 3 products live
Conventional
25% down · 7.5% · 30yr
- Down + closing
- —
- Monthly P&I
- —
- Monthly cashflow
- —
- DSCR
- —
- Eligible?
- —
Personal DTI + credit; lowest rate.
DSCR
20% down · 8.5% · 30yr
- Down + closing
- —
- Monthly P&I
- —
- Monthly cashflow
- —
- DSCR
- —
- Eligible?
- —
No personal income docs; deal must DSCR.
Hard money
10% down · 12.0% · 12mo
- Down + closing
- —
- Monthly P&I
- —
- Monthly cashflow
- —
- DSCR
- —
- Eligible?
- —
Short-term bridge; refi at stabilization.
Listing history 5 events
-
2026-06-01days on market $159,800 Active 45 DOM
-
2026-05-31days on market $159,800 Active 44 DOM
-
2026-05-31days on market $159,800 Active 43 DOM
-
2026-04-18$159,900 Active 587-char remark
Show marketing remark (587 chars)
Welcome home to this beautifully maintained 3-year-old mobile home, perfectly situated on nearly one acre! Nestled on a quiet street, this property offers both privacy and space, with mature trees lining much of the lot for a peaceful setting. Inside, the open floor plan creates a welcoming atmosphere with plenty of room for entertaining family and friends. Step outside and enjoy the expansive yard--ideal for adding a shop, creating your dream outdoor space, or simply relaxing and taking in the surroundings. Don't miss the opportunity to own a move-in ready home with room to grow!
-
2026-04-17$159,900 Active 598-char remark
Show marketing remark (598 chars)
Welcome home to this beautifully maintained 3-year-old mobile home, perfectly situated on nearly one acre! Nestled on a quiet street, this property offers both privacy and space, with mature trees lining much of the lot for a peaceful setting. Inside, the open floor plan creates a welcoming atmosphere with plenty of room for entertaining family and friends. Step outside and enjoy the expansive yard—ideal for adding a shop, creating your dream outdoor space, or simply relaxing and taking in the surroundings. Don’t miss the opportunity to own a move-in ready home with room to grow!
ⓘ Source: listings_history table (triggers on properties + properties_extension) + one-shot
backfill from property_details.listing_events for pre-trigger history.
Nearby sold comps map
Loading sold comps map…
Walkable amenities ~0.75 mi
Loading nearby amenities…
Taxation est. · year 1
- Rental income
- $19,288
- − Mortgage interest
- −$8,951
- − Property taxes
- −$2,397
- − Insurance
- −$799
- − Repairs & maintenance
- −$1,543
- − Management
- −$1,543
- − Depreciation
- −$4,649
- Taxable loss
- −$594
- Est. tax savings @ 24.0%
- +$143
- After-tax cash flow
- $2,128/yr
For passive investors: Depreciation is non-cash, so a rental often shows a tax loss while cash-flowing — sheltering income. Rental losses are passive: they offset passive income freely, and up to $25,000/yr can offset ordinary (W-2) income if you actively participate and your MAGI is under $100k (phasing out to $0 by $150k); unused losses carry forward. On sale, claimed depreciation is recaptured at up to 25%, and gains may owe capital-gains tax (a 1031 exchange can defer both). Figures are a year-1 estimate at your 24.0% rate — not tax advice; consult a CPA.
Condition & rehab AI · 14 photos
This move-in ready mobile home is in good condition with a good condition score of 80. It has a good exterior, interior, and HVAC systems. The home has a good curb appeal and is located on a quiet street with mature trees. The home has a good resale and rental value with potential for further improvements.
Value-add opportunities
- Both Painting the exterior siding and updating the landscaping — Painting the exterior and updating the landscaping will enhance the curb appeal and increase both resale and rental value.
- Resale Upgrading the kitchen appliances — Upgrading the kitchen appliances will make the home more appealing to potential buyers.
- Resale Updating the bathrooms with modern fixtures — Updating the bathrooms with modern fixtures will make the home more appealing to potential buyers.
Renovation cost estimate screening
Value-add ROI direction
- Both Painting the exterior siding and updating the landscaping — Painting the exterior and updating the landscaping will enhance the curb appeal and increase both resale and rental value. ↑
- Resale Upgrading the kitchen appliances — Upgrading the kitchen appliances will make the home more appealing to potential buyers. ↑
- Resale Updating the bathrooms with modern fixtures — Updating the bathrooms with modern fixtures will make the home more appealing to potential buyers. ↑
ⓘ Cost ranges are severity-bucket heuristics (US national rule-of-thumb). Get contractor quotes + a written scope before underwriting a rehab budget.
Schools (NCES district)
- District
- Livingston Parish
- NCES district ID
- 2201020
- Math proficiency
- 40% ▼ -38.00%
- Reading proficiency
- 52% ▼ -32.00%
- Median HH income
- $56,755
- Composite
- 40.07/100
- National rank
- #3811
- State rank
- #13 of 98 in LA
Livability — Albany
- Score
- 77/100
- State rank
- #12
- US rank
- #3099
Category grades
Schools grade is shown separately in the Schools card above.
Census & demographics
- Population (ZIP)
- 5,621
Population outlook (Livingston County) Hauer SSP2
- Today (2025)
- 158,511 people
- By 2030
- 168,241 · +6.1%
- By 2040
- 186,252 · +17.5%
- By 2050
- 201,516 · +27.1%
- By 2075
- 231,217 · +45.9%
- By 2100
- 241,697 · +52.5%
Race, ethnicity, and origin ACS 2023
- Neighborhood character
- Predominantly White (88%)
- Race & ethnicity
- White 88% Hispanic / Latino 6% Two or more races 2%
- Hispanic origin (detail)
- Mexican 6%
- Common ancestry
- Lithuanian 11% Romanian 1%
- Foreign-born
- 6% · Canada
- Languages at home
- 93% English-only · Spanish 7%
Political lean MEDSL · Livingston
- 2024 margin
- Solid R (+68.5) · D 15.1% · R 83.6% · Other 1.3%
- 2008→2024 swing
- +3.4pp toward D · 2008: -71.9pp · 2024: -68.5pp
- All cycles
- 2024: R+68.5 2020: R+70.0 2016: R+72.5 2012: R+70.4 2008: R+71.9
Not yet ingested
- Civics
- —
Market trends
- HPI YoY
- ▼ -23.34%
- Current HPI
- 182.8335
- Rent YoY
- —
- Metro
- —
- State GDP YoY
- ▲ 3.29%
- F500 in state
- 10
Industry mix (Fortune 500 HQ in LA)
| Industry | F500 HQs | Revenue |
|---|---|---|
| Telecommunications | 2 | $23B |
|
||
| Utilities | 1 | $12B |
|
||
| Wholesale / Distribution | 1 | $5B |
|
||
| Advertising | 1 | $2B |
|
||
Price history
+0.0% since first listed2 events — show timeline
- 2026-04-18 Listed $159,900 AcadianaMLS
- 2026-04-17 Listed $159,900 GBRMLS
Cash-flow waterfall
monthlySold comps — $/sqft
last 12 mo · ≤1 miLoading sold comps…