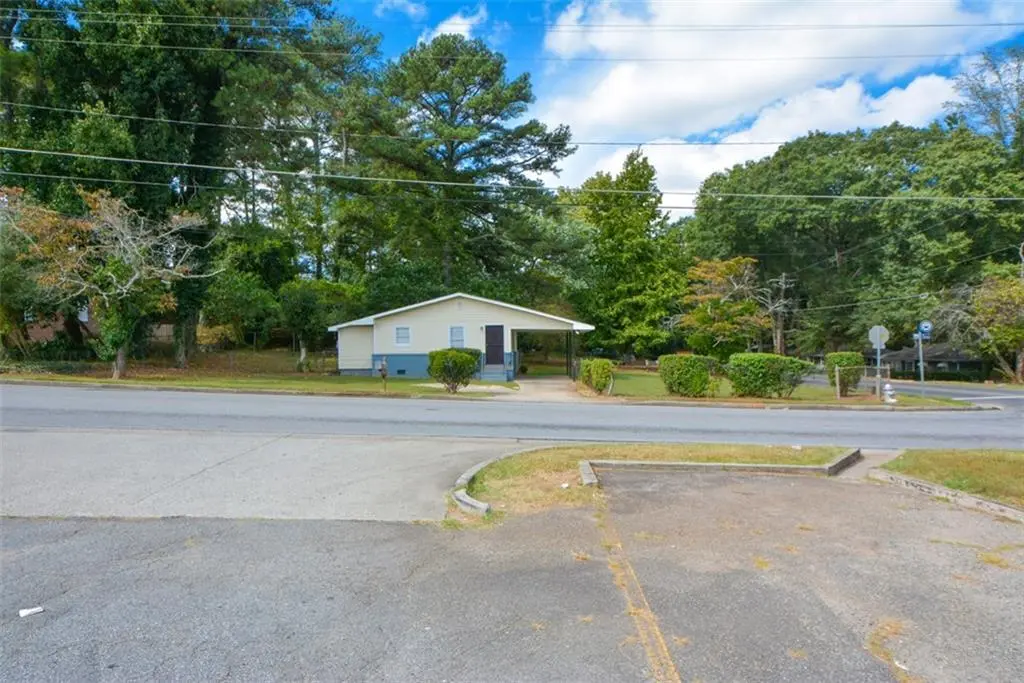
2249 Brannen Rd SE · Gresham Park, GA
Flood risk 1/10 · Minimal
- FEMA flood zone
- X (unshaded)
- Chance of flooding over 30 yrs
- 0.0%
- Est. flood insurance / yr
- $507 – $1,088
Fire risk 3/10 · Minor
- Est. fire insurance / yr
- $963 – $1,789
Heat risk 6/10 · Moderate
- Hot days now (above 104°F)
- 7 days/yr
- Hot days in 30 yrs
- 18 days/yr
Wind risk 5/10 · Moderate
- Chance of severe wind over 30 yrs
- 26.0%
Air-quality risk 5/10 · Moderate
- Unhealthy air days now
- 6 days/yr
- Unhealthy air days in 30 yrs
- 8 days/yr
Risk factors via First Street. Map © Google.
Why this score? — see what drove the C grade
The composite is a weighted blend of 9 inputs, each scored 0–100. Each bar is that input's sub-score; the figure is the points it added to the 100-point composite (weight × sub-score).
- Cash flow +17.8/30.0
- ARV discount +15.0/15.0
- 1% rule +5.7/10.0
- DSCR +5.6/10.0
- Livability +3.3/5.0
- Rent growth +3.1/5.0
- Condition / age +2.5/5.0
- Schools +2.1/10.0
- Appreciation +0.0/10.0
$188,000
🖨 Deal sheet 📄 Offer letter ✓ Due diligence
Listing remarks MLS
Make this home your own with some Seller paid closing costs. This one level home is totally renovated and is Move-In-Ready. White shaker kitchen cabinets; updated bathroom, and new flooring throughout. Enjoy your privacy on a large corner lot with the front and back yard fenced in. Close to Major interstates, Downtown Atlanta, and Major attractions.
Key facts
- One level home
- Large corner lot
- New flooring
Tags
Neighborhood map
What this means for you Summary
Snapshot
- This is a 3-bed/1.0-bath single-family listed at $188k.
Deal economics
- At list price, monthly cash flow is $155 ($2k/yr) — positive.
- The deal already cash-flows at list — no discount required.
- Meets the 1% rule at list price ($2k rent vs $188k).
- Recommended offer: $165k (12.0% below list) — sets the bar for market timing.
- Cap rate 7.3% vs local median 4.6% in Gresham Park — top-decile yield for the area; either an underpriced asset or a hidden risk that comps aren't pricing in. Stress-test before assuming the spread holds.
Location & tenants
- Location reads 66/100 on livability (#183 in GA) — a middle-class / working-renter tenant base. Strengths: housing A+, cost of living A, crime B+; Watch: schools D-, amenities F, commute F.
- Dekalb County (suburban): math 19% / reading 28% proficiency, ranked #125 of 174 in GA (top 72%) — low school quality limits family demand, transient renter base, plan for 1-2y turnover; 68% free/reduced lunch — lower-income household profile, screen leases tightly.
- Market conditions: Rents rising (+2.3%/yr); 461 active listings in the ZIP; 40 comparable units currently listed for rent nearby; rentals lingering (median 44d on market — plan ~5-8 weeks vacancy on turnover, expect pricing pressure); 50% of comp listings sitting > 30 days — soft ceiling on asking rent; solid renter incomes; 1,240 units permitted in DeKalb County in 2024 (385 in 5+ unit buildings).
Forward outlook
- Local home prices are declining (-3.0%/yr); year-one equity from $1k of loan paydown is wiped out by about $6k of value loss. Plan a longer hold.
- DeKalb County population projected at +28% by 2050 — long-run rental-demand tailwind backs the buy-and-hold thesis.
Negotiation context
- It's been on market 243 days — a 12% lower offer ($165k) is reasonable based on typical stale-listing flexibility.
- 10 sale attempts since 3y ago; this cycle's ask has dropped $12k (6%) from the opening price — seller is motivated, your offer sets the floor, not the list.
- Current owner paid $34k; list at $188k implies a 445% gain — meaningful room to come down on a strong offer.
Risks & watch-outs
- Watch-outs: built in 1955 — expect roof / HVAC / electrical / plumbing capex.
- Climate carrying-cost: moderate wind risk, 26% chance of damaging wind over 30y; extreme-heat days projected 7→18/yr by 2055 (HVAC capex compounding) — expect insurance premiums to compound above CPI over the hold.
Questions for the listing agent
- It's been on market 243 days. Have you received any prior offers? Is the seller open to a 12% concession, seller financing, or rate buy-down credit?
- Built in 1955 — when were the roof, HVAC, electrical panel, plumbing, and water heater last replaced?
- Why hasn't it sold? Are there any deal-killer items the seller is aware of (foundation, flood, title, zoning, code violations)?
- Is there a deadline driving the sale (1031 exchange, divorce, estate, relocation)? That informs how much negotiation room exists.
- Schools are D-rated, which usually means shorter tenancies and higher turnover. Who's the typical renter profile here, and what's been the actual vacancy rate?
- What's the average days-on-market for RENTAL listings here right now (not sales)? A rising rental-DOM trend means longer vacancies and softer asking-rent achievability than the comps imply.
- What's the recent tenant-quality profile in this submarket — average credit score on applications, eviction rate, late-payment / NSF rate, and stable-employment percentage? A property-management company in the area should have these aggregated.
- How much new for-sale + rental construction is in the pipeline within 1–3 miles? Heavy new supply typically softens prices + rents 12–24 months out; constrained supply supports both.
Investment metrics
- 1% rule
- 1.07% ✓
- Cap rate
- 7.28%
- Cash-on-cash
- 3.54%
- DSCR
- 1.16
- GRM
- 7.8
CMA / ARV
- ARV (median comp)
- $277,185
- List price
- $188,000
- Delta
- -32.18%
- Verdict
- UNDERPRICED
- Comps
- 20 within 1.0 mi
Show comp detail 12 sales within ~0.75 mi
| Address | Dist | Beds/Ba | Sqft | Sold | Price | $/sf | Match |
|---|---|---|---|---|---|---|---|
| 2028 Cook Rd | 0.29mi | 2/1.0 (-1) | 1,012 (-6%) | 6mo | $168,000 | $166 | 67 |
| 2090 Cherry Ln | 0.65mi | 3/1.0 | 1,085 (+1%) | 5mo | $140,000 | $129 | 64 |
| 1738 Flintwood Dr SE | 0.46mi | 3/1.5 | 1,163 (+8%) | 2mo | $283,000 | $243 | 62 |
| 1936 Boulderview Dr SE | 0.72mi | 3/2.0 | 1,100 (+2%) | 1mo | $298,900 | $272 | 58 |
| 2180 Rexford Dr | 0.63mi | 2/1.0 (-1) | 1,066 (-1%) | 9mo | $85,000 | $80 | 57 |
| 2575 Flagstone Dr SE | 0.46mi | 3/3.0 | 1,119 (+4%) | 10mo | $240,000 | $214 | 56 |
| 2653 Flagstone Dr SE | 0.56mi | 3/2.5 | 1,145 (+6%) | 9mo | $275,000 | $240 | 50 |
| 2352 Scotty Cir | 0.69mi | 3/1.0 | 1,010 (-6%) | 10mo | $173,000 | $171 | 49 |
| 2134 Tilson Rd | 0.60mi | 3/2.0 | 1,200 (+12%) | 2mo | $268,500 | $224 | 47 |
| 2327 Scotty Cir | 0.68mi | 2/2.0 (-1) | 1,010 (-6%) | 7mo | $210,000 | $208 | 44 |
| 1905 Sahara Dr SE | 0.71mi | 3/1.5 | 1,204 (+12%) | 8mo | $225,000 | $187 | 38 |
| 1973 Boulderview Dr | 0.65mi | 2/1.0 (-1) | 1,230 (+14%) | 8mo | $135,000 | $110 | 34 |
Match score weights: distance 35% · size 25% · config 20% · recency 20%. Top-matched comps best support the ARV.
Projected returns pro-forma
-3.0% appreciation · 2.33% rent growth · sell at horizon
- IRR
- -11.5%
- Equity multiple
- 0.59×
- Total profit
- $-21,822
- Equity at exit
- $28,031
- IRR
- -3.3%
- Equity multiple
- 0.79×
- Total profit
- $-11,280
- Equity at exit
- $16,255
Cash invested: $52,640 (down + closing). Projections, not guarantees.
Landlord ↔ Tenant lean methodology
- Overall (STATE)
- 90 Strongly Landlord-Friendly
- State Georgia
- 90 Strongly Landlord-Friendly · R+3
- County
- — inherits STATE
- City
- — inherits STATE
ZIP-level market 30316
- Rents YoY
- 2.3%
- Active inventory
- 461
- Price-to-rent
- 7.8×
Monthly cashflow live
- Estimated rent
- $2,015 high interval (Pro) →
- Mortgage (P&I)
- −$986
- Tax from tax record
- −$372 /mo · $4,470/yr
- Insurance
- −$78
- HOA
- −$0
- Vacancy / Maint / Mgmt
- −$423
- Net cashflow
- $155
Break-even live
UW: 25.0% down · 7.5% · 30yr · 1.5% tax · 5.0% vac · 8.0% maint · 8.0% mgmt
Financing live
Cash to close
- Down payment
- $47,000
- Closing costs
- $5,640
- Reserves months
- —
- Total cash needed
- —
Loan-product check · same deal, 3 products live
Conventional
25% down · 7.5% · 30yr
- Down + closing
- —
- Monthly P&I
- —
- Monthly cashflow
- —
- DSCR
- —
- Eligible?
- —
Personal DTI + credit; lowest rate.
DSCR
20% down · 8.5% · 30yr
- Down + closing
- —
- Monthly P&I
- —
- Monthly cashflow
- —
- DSCR
- —
- Eligible?
- —
No personal income docs; deal must DSCR.
Hard money
10% down · 12.0% · 12mo
- Down + closing
- —
- Monthly P&I
- —
- Monthly cashflow
- —
- DSCR
- —
- Eligible?
- —
Short-term bridge; refi at stabilization.
Rent comps 40 comps
| Address | Beds | Baths | Sqft | Rent | $/sqft | DOM | Units | Dist |
|---|---|---|---|---|---|---|---|---|
| 2480 Flat Shoals Rd Decatur, GA | 1.0–3.0 | 1.0–2.0 | 1017 | $2,149 | $2.11 | 2d | 23 | 0.35mi |
| 2126 Rexford Dr Decatur, GA | 3.0 | 1.5 | 1092 | $1,400 | $1.28 | 43d | 1 | 0.51mi |
| 1757 Flintwood Dr SE Atlanta, GA | 3.0 | 2.0 | 1150 | $1,750 | $1.52 | 43d | 1 | 0.51mi |
| 2434 Rockcliff Rd SE Atlanta, GA | 3.0 | 2.0 | 1400 | $2,499 | $1.78 | 43d | 1 | 0.55mi |
| 2731 Larkspur Dr SE Atlanta, GA | 4.0 | 3.0 | 1492 | $2,000 | $1.34 | 43d | 1 | 0.59mi |
| 2692 Rockcliff Rd SE Atlanta, GA | 3.0 | 2.0 | 1239 | $2,000 | $1.61 | 43d | 1 | 0.64mi |
| 2435 Bouldercliff Way SE Unit B Atlanta, GA | 2.0 | 1.0 | 1236 | $1,600 | $1.29 | 43d | 1 | 0.66mi |
| 2435 Bouldercliff Way SE Atlanta, GA | 3.0 | 2.0 | 1236 | $1,950 | $1.58 | 43d | 1 | 0.66mi |
| 2335 Scotty Cir Decatur, GA | 3.0 | 1.0 | 1010 | $1,495 | $1.48 | 43d | 1 | 0.66mi |
| 200 Vineyard Walk Atlanta, GA | 2.0 | 1.0 | 884 | $1,294 | $1.46 | 2d | 6 | 0.67mi |
| 2078 Parker Ranch Rd SE Atlanta, GA | 3.0 | 1.0 | 1014 | $1,650 | $1.63 | 24d | 1 | 0.69mi |
| 2283 Scotty Cir Decatur, GA | 3.0 | 2.0 | 1298 | $2,150 | $1.66 | 43d | 1 | 0.75mi |
| 2679 Sherlock Dr Decatur, GA | 3.0 | 1.5 | 1173 | $1,650 | $1.41 | 43d | 1 | 0.81mi |
| 1916 Longdale Dr Decatur, GA | 3.0 | 2.0 | 1176 | $2,395 | $2.04 | 43d | 1 | 0.81mi |
| 2163 Lilac Ln Decatur, GA | 3.0 | 2.0 | 1107 | $2,150 | $1.94 | 43d | 1 | 0.88mi |
| 1670 Cecilia Dr SE Atlanta, GA | 3.0 | 2.0 | 1032 | $2,350 | $2.28 | 43d | 1 | 0.88mi |
| 2911 Gresham Rd SE Atlanta, GA | 3.0 | 1.0 | 960 | $1,700 | $1.77 | 43d | 1 | 0.88mi |
| 2892 Horse Shoe Dr SE Atlanta, GA | 4.0 | 2.0 | 1342 | $1,654 | $1.23 | 22d | 1 | 0.90mi |
| 2123 Second Ave Decatur, GA | 4.0 | 2.0 | 1302 | $2,075 | $1.59 | 19d | 1 | 0.93mi |
| 2913 Horse Shoe Dr SE Atlanta, GA | 3.0 | 1.0 | 1263 | $1,595 | $1.26 | 24d | 1 | 0.94mi |
| 1840 Camellia Dr Decatur, GA | 3.0 | 2.0 | 1394 | $2,100 | $1.51 | 43d | 1 | 0.97mi |
| 1840 Camellia Dr Decatur, GA | 3.0 | 2.0 | 1340 | $1,950 | $1.46 | 22d | 1 | 0.97mi |
| 1438 E Bouldercrest Rd Atlanta, GA | 1.0–3.0 | 1.0–2.0 | 967 | $1,707 | $1.76 | 1d | 19 | 0.97mi |
| 2884 Reveille Cir SE Atlanta, GA | 3.0 | 2.0 | 1437 | $2,050 | $1.43 | 43d | 1 | 1.00mi |
| 2931 Cloverleaf Dr SE Atlanta, GA | 4.0 | 2.0 | 1371 | $1,985 | $1.45 | 5d | 1 | 1.01mi |
| 2078 E Lilac Ln Decatur, GA | 3.0 | 1.0 | 1160 | $1,600 | $1.38 | 43d | 1 | 1.04mi |
| 2043 Juanita St Decatur, GA | 3.0 | 2.0 | 1500 | $3,000 | $2.00 | 43d | 1 | 1.04mi |
| 1989 Wee Kirk Rd SE Atlanta, GA | 3.0 | 1.0 | 925 | $1,800 | $1.95 | 24d | 1 | 1.04mi |
| 1843 Wee Kirk Rd SE Atlanta, GA | 3.0 | 1.5 | 1154 | $1,811 | $1.57 | 5d | 1 | 1.05mi |
| 1345 Parc Bench Rd SE Atlanta, GA | 3.0 | 2.5 | 1465 | $2,500 | $1.71 | 24d | 1 | 1.16mi |
| 2062 Bencal Dr SE Atlanta, GA | 3.0 | 2.0 | 1260 | $1,650 | $1.31 | 24d | 1 | 1.17mi |
| 2401 Dawn Ct Decatur, GA | 3.0 | 2.0 | 1350 | $1,950 | $1.44 | 15d | 1 | 1.17mi |
| 1337 Parc Bench Rd SE Atlanta, GA | 3.0 | 2.5 | 1460 | $2,390 | $1.64 | 5d | 1 | 1.17mi |
| 1930 Flat Shoals Rd SE Atlanta, GA | 1.0–2.0 | 1.0–1.5 | 1045 | $1,479 | $1.42 | 5d | 17 | 1.17mi |
| 1624 Eastland Rd SE Atlanta, GA | 2.0 | 1.0 | 875 | $1,300 | $1.49 | 22d | 1 | 1.21mi |
| 3054 Will Rogers Pl SE Atlanta, GA | 3.0 | 2.0 | 1050 | $2,600 | $2.48 | 43d | 1 | 1.26mi |
| 2000 Bouldercrest Rd Atlanta, GA | 1.0–2.0 | 1.0–2.0 | 925 | $1,520 | $1.64 | 43d | 3 | 1.26mi |
| 2000 Bouldercrest Rd Atlanta, GA | 1.0–3.0 | 1.0–2.0 | 1050 | $1,658 | $1.58 | 1d | 16 | 1.26mi |
| 2000 Bencal Dr SE Atlanta, GA | 3.0 | 2.0 | 1500 | $1,850 | $1.23 | 24d | 1 | 1.27mi |
| 2959 Sugarcreek Ln SE Atlanta, GA | 4.0 | 2.5 | 1478 | $1,940 | $1.31 | 5d | 1 | 1.28mi |
Listing history 38 events
-
2026-06-18days on market $188,000 Active 243 DOM
-
2026-06-17days on market $188,000 Active 242 DOM
-
2026-06-16days on market $188,000 Active 241 DOM
-
2026-06-15days on market $188,000 Active 240 DOM
-
2026-06-13days on market $188,000 Active 238 DOM
-
2026-06-09days on market $188,000 Active 234 DOM
-
2026-06-08days on market $188,000 Active 233 DOM
-
2026-06-07days on market $188,000 Active 232 DOM
-
2026-06-04days on market $188,000 Active 229 DOM
-
2026-06-03pricedays on market $188,000 Active 228 DOM
-
2026-06-02days on market $199,900 Active 227 DOM
-
2026-06-01days on market $199,900 Active 226 DOM
-
2026-05-31days on market $199,900 Active 225 DOM
-
2026-04-20status Active 354-char remark
Show marketing remark (354 chars)
Make this home your own with some Seller paid closing costs. This one level home is totally renovated and is Move-In-Ready. White shaker kitchen cabinets; updated bathroom, and new flooring throughout. Enjoy your privacy on a large corner lot with the front and back yard fenced in. Close to Major interstates, Downtown Atlanta, and Major attractions.
-
2026-04-06historical 354-char remark
Show marketing remark (354 chars)
Make this home your own with some Seller paid closing costs. This one level home is totally renovated and is Move-In-Ready. White shaker kitchen cabinets; updated bathroom, and new flooring throughout. Enjoy your privacy on a large corner lot with the front and back yard fenced in. Close to Major interstates, Downtown Atlanta, and Major attractions.
-
2025-10-04$199,900 Active 354-char remark
Show marketing remark (354 chars)
Make this home your own with some Seller paid closing costs. This one level home is totally renovated and is Move-In-Ready. White shaker kitchen cabinets; updated bathroom, and new flooring throughout. Enjoy your privacy on a large corner lot with the front and back yard fenced in. Close to Major interstates, Downtown Atlanta, and Major attractions.
-
2025-10-01historical
-
2025-10-01historical
-
2025-08-18status Back On Market
-
2025-08-18status Active
-
2025-08-17status Pending
-
2025-08-12status Under Contract
-
2025-08-12historical Active Under Contract
-
2025-08-03price $235,000
-
2025-08-03price $235,000
-
2025-07-23$245,000 Active
-
2025-07-23$245,000 New
-
2024-07-31historical
-
2024-07-31historical
-
2024-03-31$270,000 Active
-
2024-03-31$270,000 New
-
2024-03-30historical
-
2024-03-30historical
-
2023-10-24price $270,000
-
2023-09-13price $270,000
-
2023-07-17$275,000 Active
-
2023-07-17$275,000 New
-
1995-03-07soldstatus $34,500
ⓘ Source: listings_history table (triggers on properties + properties_extension) + one-shot
backfill from property_details.listing_events for pre-trigger history.
Tax reassessment forecast GA · Resets to sale price
- Current annual tax
- $4,470 · $372/mo
- Projected year-2 tax
- $4,470 · $372/mo
- Expected delta
- $0/yr ($0/mo · 0.0%)
ⓘ Screening estimate from a state-policy table — verify with the county assessor before closing.
Climate risk First Street
- Flood 1/10 Low FEMA zone X (unshaded) · 0% chance over 30 yrs
- Wildfire 3/10 Moderate
- Heat 6/10 Major 7 d/yr ≥104°F today · 18 d/yr by 30 yrs out
- Wind 5/10 Major 26% chance of damaging wind over 30 yrs
- Air quality 5/10 Major 6 unhealthy d/yr today · 8 by 30 yrs out
Nearby sold comps map
Loading sold comps map…
Walkable amenities ~0.75 mi
Loading nearby amenities…
Taxation est. · year 1
- Rental income
- $24,179
- − Mortgage interest
- −$10,531
- − Property taxes
- −$4,470
- − Insurance
- −$940
- − Repairs & maintenance
- −$1,934
- − Management
- −$1,934
- − Depreciation
- −$5,469
- Taxable loss
- −$1,099
- Est. tax savings @ 24.0%
- +$264
- After-tax cash flow
- $2,125/yr
For passive investors: Depreciation is non-cash, so a rental often shows a tax loss while cash-flowing — sheltering income. Rental losses are passive: they offset passive income freely, and up to $25,000/yr can offset ordinary (W-2) income if you actively participate and your MAGI is under $100k (phasing out to $0 by $150k); unused losses carry forward. On sale, claimed depreciation is recaptured at up to 25%, and gains may owe capital-gains tax (a 1031 exchange can defer both). Figures are a year-1 estimate at your 24.0% rate — not tax advice; consult a CPA.
Schools (NCES district)
- District
- Dekalb County
- NCES district ID
- 1301740
- Math proficiency
- 19% ▼ -12.00%
- Reading proficiency
- 28% ▼ -7.00%
- Median HH income
- $51,448
- Composite
- 20.92/100
- National rank
- #8482
- State rank
- #125 of 174 in GA
Livability — Gresham Park
- Score
- 66/100
- State rank
- #183
- US rank
- #11376
Category grades
Schools grade is shown separately in the Schools card above.
Census & demographics
- Census place
- Gresham Park, GA
- County
- Dekalb County · 782,738 people
- Metro
- Atlanta-Sandy Springs-Alpharetta, GA
- Population (ZIP)
- 35,107
- Household income
- $102,891
- Rent vs Own
- Severe rent burden
- 1897.0
Population outlook (DeKalb County) Hauer SSP2
- Today (2025)
- 839,977 people
- By 2030
- 891,768 · +6.2%
- By 2040
- 988,894 · +17.7%
- By 2050
- 1,074,583 · +27.9%
- By 2075
- 1,245,026 · +48.2%
- By 2100
- 1,303,135 · +55.1%
Race, ethnicity, and origin ACS 2023
- Neighborhood character
- Diverse neighborhood (Simpson 0.64)
- Race & ethnicity
- Black 47% White 36% Hispanic / Latino 8% Two or more races 7% Asian 4%
- Hispanic origin (detail)
- Mexican 4%
- Common ancestry
- Lithuanian 2% Romanian 2% Slovak 1%
- Foreign-born
- 6% · Canada
- Languages at home
- 93% English-only · Spanish 4% French/Haitian/Cajun 1% Other Indo-European 1%
Political lean MEDSL · DeKalb
- 2024 margin
- Solid D (+64.8) · D 81.9% · R 17.1% · Other 1.0%
- 2008→2024 swing
- +6.1pp toward D · 2008: 58.6pp · 2024: 64.8pp
- All cycles
- 2024: D+64.8 2020: D+67.4 2016: D+64.8 2012: D+56.8 2008: D+58.6
Not yet ingested
- Civics
- —
Market trends
- HPI YoY
- ▼ -415.92%
- Current HPI
- 318.454
- Rent YoY
- ▲ 2.33%
- Metro
- Atlanta-Sandy Springs-Alpharetta, GA
- State GDP YoY
- ▲ 2.66%
- F500 in state
- 28
Industry mix (Fortune 500 HQ in GA)
| Industry | F500 HQs | Revenue |
|---|---|---|
| Paper / Packaging | 2 | $29B |
|
||
| Retail | 1 | $160B |
|
||
| Transportation / Logistics | 1 | $91B |
|
||
| Airlines | 1 | $62B |
|
||
| Consumer Goods | 1 | $47B |
|
||
| Utilities | 1 | $25B |
|
||
Price history
+479.4% since first listed25 events — show timeline
- 2026-04-20 Relisted — FMLS
- 2026-04-06 Listing Removed — FMLS
- 2025-10-04 Listed $199,900 FMLS
- 2025-10-01 Listing Removed — GAMLS
- 2025-10-01 Listing Removed — FMLS
- 2025-08-18 Relisted — GAMLS
- 2025-08-18 Relisted — FMLS
- 2025-08-17 Pending — FMLS
- 2025-08-12 Pending — GAMLS
- 2025-08-12 Contingent — FMLS
- 2025-08-03 Price Changed $235,000 GAMLS
- 2025-08-03 Price Changed $235,000 FMLS
- 2025-07-23 Listed $245,000 GAMLS
- 2025-07-23 Listed $245,000 FMLS
- 2024-07-31 Listing Removed — GAMLS
- 2024-07-31 Listing Removed — FMLS
- 2024-03-31 Listed $270,000 GAMLS
- 2024-03-31 Listed $270,000 FMLS
- 2024-03-30 Listing Removed — GAMLS
- 2024-03-30 Listing Removed — FMLS
- 2023-10-24 Price Changed $270,000 GAMLS
- 2023-09-13 Price Changed $270,000 FMLS
- 2023-07-17 Listed $275,000 GAMLS
- 2023-07-17 Listed $275,000 FMLS
- 1995-03-07 Sold (Public Records) $34,500 Public Records
Property tax history
+5.6%/yrLatest (2025): $4,470 · +24.3% YoY. Source: county tax records.
Cash-flow waterfall
monthlySold comps — $/sqft
last 12 mo · ≤1 miLoading sold comps…