 Multi-family
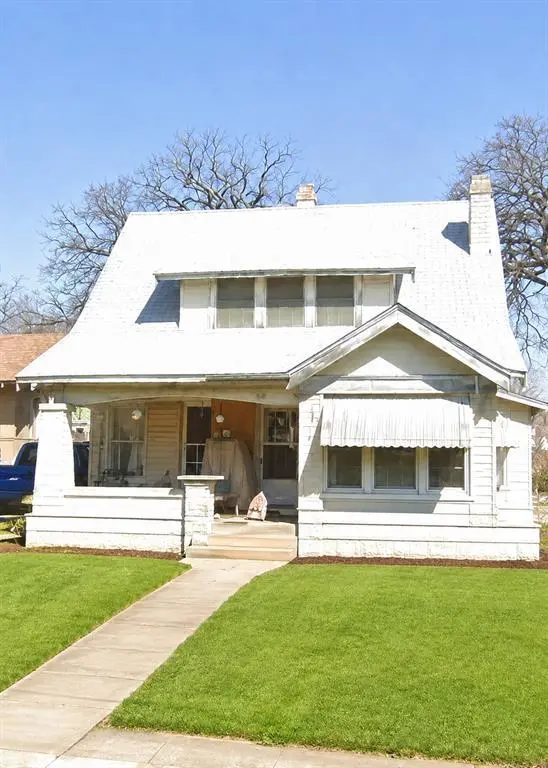
105 E 6th St · Dallas, TX
Flood risk 1/10 · Minimal
- FEMA flood zone
- X (unshaded)
- Chance of flooding over 30 yrs
- 0.0%
- Est. flood insurance / yr
- $507 – $1,088
Fire risk 1/10 · Minimal
- Est. fire insurance / yr
- $1,222 – $2,270
Heat risk 7/10 · Major
- Hot days now (above 109°F)
- 7 days/yr
- Hot days in 30 yrs
- 23 days/yr
Wind risk 6/10 · Moderate
- Chance of severe wind over 30 yrs
- 27.0%
Air-quality risk 3/10 · Minor
- Unhealthy air days now
- 2 days/yr
- Unhealthy air days in 30 yrs
- 3 days/yr
Risk factors via First Street. Map © Google.
Why this score? — see what drove the D grade
The composite is a weighted blend of 9 inputs, each scored 0–100. Each bar is that input's sub-score; the figure is the points it added to the 100-point composite (weight × sub-score).
- Appreciation +10.0/10.0
- Cash flow +8.0/30.0
- ARV discount +7.5/15.0
- Livability +4.0/5.0
- 1% rule +2.8/10.0
- Schools +2.8/10.0
- Condition / age +2.5/5.0
- DSCR +2.1/10.0
- Rent growth +1.8/5.0
$199,000
🖨 Deal sheet (PDF) 📄 Offer letter ✓ Due diligence
Multi-family units
County records classify this as Multi-Family (2-4 Unit). Listing-text estimate: 1 unit. estimate disagrees with records
Listing remarks
Multiple offers received. Please send all offers by 10 am Wednesday, June 3rd. Investor or 203K buyer needed. Bring your creative ideas to bring this craftsman style duplex come to life! Both sides of duplex are being sold together. Unit 105 features approximately 931 sqft, 2 rooms, kitchen, and full bath. Unit 107 features approximately 1081 sqft, front sunroom or office, living area with fireplace, dining area, kitchen, 2 bedrooms and a full bath. Front covered porch. Lot size is approximate 6280 sqft lot. Conveniently located near Bishop Arts, Lake Cliff Park, hospital, and access to public transportation on the corner.
Key facts
- Front covered porch
- 6,280 sq ft lot
- 2 garage spots
Tags
Property features AI
Finance
- Financial info: Listing accepts Cash and FHA-203K; Treat as clear loan type; No second mortgage indicated
- HOA & community: No association
Exterior
- Parking: Two covered parking spaces; Two-car garage; Driveway and outside parking
- Utilities: City water (individual water meter); City sewer; Electricity available and connected; Natural gas available (individual gas meter); Not in a municipal utility district
- Home design: Single-family residence (attached); Built in 1930
- Construction: Brick and wood construction; Composition roof; Preowned (built 1930)
- Exterior features: Covered front porch; Chain link fencing; Interior lot; Easements for electric and natural gas
Interior
- Kitchen: Gas range
- Bedrooms: Four bedrooms (two on first level, two on second level — primary bedrooms on both levels)
- Flooring: Wood flooring
- Bathrooms: Two full bathrooms
- Interior features: One and one-half story layout; One living area; One dining area; Room count: 5; Wood flooring; Other interior features; Wood-burning fireplace (1)
- Laundry & utility: Individual gas meter; Individual water meter
Neighborhood map
What this means for you Summary
Snapshot
- This is a 2-bed/1.0-bath multifamily listed at $199k.
Deal economics
- At list price, monthly cash flow is $-201 ($-2k/yr) — negative.
- To cash-flow at today's rent, offer at most $163k (17.9% below list).
- To meet the 1% rule (rent ≥ 1% of price), the offer needs to be $155k (22.1% below list).
- Recommended offer: $155k (22.1% below list) — sets the bar for 1% rule.
- Cap rate 5.1% vs local median 2.3% in Dallas — top-decile yield for the area; either an underpriced asset or a hidden risk that comps aren't pricing in. Stress-test before assuming the spread holds.
Location & tenants
- Location reads 81/100 on livability (#24 in TX, #1,380 nationally) — a professional / high-income tenant draw. Strengths: amenities A+, commute A+, housing A+; Watch: crime F.
- Dallas ISD (urban): math 31% / reading 36% proficiency, ranked #559 of 826 in TX (top 68%) — families likely to look elsewhere, expect single-tenant / working-renter base with shorter leases; 83% free/reduced lunch — lower-income household profile, screen leases tightly.
- Zoned schools: John F Peeler El (math 17% / reading 22%, grade F, #3,583 of 4,322 statewide, top 86%, 336 students, 92% FRL).
- Zoned-school proficiency averages 20% at this address vs 34% district-wide (-14 pts) — the specific schools serving this property underperform the Dallas ISD average; the district grade overstates school quality for this exact location.
- Market conditions: Rents soft (-2.7%/yr); 142 active listings in the ZIP; 40 comparable units currently listed for rent nearby; rentals at typical pace (median 16d on market — plan ~3-4 weeks tenant-placement turnaround); 12,577 units permitted in Dallas County in 2024 (6,829 in 5+ unit buildings).
- This rent runs 40% of the median local income ($47k/yr) — at the standard rent-burdened threshold; future hikes will face affordability resistance.
Forward outlook
- In year one you build about $21k of equity ($1k loan paydown + $20k appreciation (10.0% local appreciation)).
- Dallas County population projected at +35% by 2050 — long-run rental-demand tailwind backs the buy-and-hold thesis.
- By year 2, paydown + projected appreciation supports a ~$34k cash-out refi (75% LTV) — recoverable capital for the next deal without selling this one.
Negotiation context
- It's been on market 17 days — a 2% lower offer ($196k) is reasonable based on typical stale-listing flexibility.
Risks & watch-outs
- Watch-outs: built in 1930 — expect roof / HVAC / electrical / plumbing capex.
- Climate carrying-cost: major wind risk, 27% chance of damaging wind over 30y; extreme-heat days projected 7→23/yr by 2055 (HVAC capex compounding) — expect insurance premiums to compound above CPI over the hold.
Questions for the listing agent
- What do current leases actually rent for vs. the listed asking? Can we see a recent rent roll and the last 12 months of T-12 income?
- Built in 1930 — when were the roof, HVAC, electrical panel, plumbing, and water heater last replaced?
- Is there a deadline driving the sale (1031 exchange, divorce, estate, relocation)? That informs how much negotiation room exists.
- Crime grade is F in this area — have there been break-ins, vandalism, or insurance claims at this property in the last 3 years? What carrier currently insures it and at what premium?
- The area grade is low — what's the realistic commute time and amenity access for the typical tenant pool here? Any planned neighborhood developments (good or bad) we should know about?
- What's the average days-on-market for RENTAL listings here right now (not sales)? A rising rental-DOM trend means longer vacancies and softer asking-rent achievability than the comps imply.
- What's the recent tenant-quality profile in this submarket — average credit score on applications, eviction rate, late-payment / NSF rate, and stable-employment percentage? A property-management company in the area should have these aggregated.
- How much new apartment / multifamily construction is in the pipeline within 1–3 miles? Heavy new supply (>2% of stock underway) typically softens rents 12–24 months out; light construction supports rent growth.
Investment metrics
- 1% rule
- 0.78% ✗
- Cap rate
- 5.08%
- Cash-on-cash
- -4.34%
- DSCR
- 0.81
- GRM
- 10.7
CMA / ARV
No comps found within radius.
Projected returns pro-forma
10.0% appreciation · 0.0% rent growth · sell at horizon
- IRR
- 20.3%
- Equity multiple
- 2.63×
- Total profit
- $91,067
- Equity at exit
- $179,275
- IRR
- 17.9%
- Equity multiple
- 5.85×
- Total profit
- $270,237
- Equity at exit
- $386,613
Cash invested: $55,720 (down + closing). Projections, not guarantees.
Landlord ↔ Tenant lean methodology
- Overall (STATE)
- 87 Strongly Landlord-Friendly
- State Texas
- 87 Strongly Landlord-Friendly · R+5
- County
- — inherits STATE
- City
- — inherits STATE
ZIP-level market 75203
- Home prices YoY
- 31.8%
- Rents YoY
- -2.7%
- Active inventory
- 142
- Price-to-rent
- 10.7×
Monthly cashflow live
- Estimated rent
- $1,550 high interval (Pro) →
- Mortgage (P&I)
- −$1,044
- Tax from tax record
- −$299 /mo · $3,593/yr
- Insurance
- −$83
- HOA
- −$0
- Vacancy / Maint / Mgmt
- −$326
- Net cashflow
- $-201
Break-even live
Sensitivity live
| Price | -10% $-89 | -5% $-145 | +0% $-201 | +5% $-258 | +10% $-314 |
|---|---|---|---|---|---|
| Rent | -10% $-324 | -5% $-263 | +0% $-201 | +5% $-140 | +10% $-79 |
| Rate | -1.0pp $-101 | -0.5pp $-151 | base $-201 | +0.5pp $-253 | +1.0pp $-305 |
UW: 25.0% down · 7.5% · 30yr · 1.5% tax · 5.0% vac · 8.0% maint · 8.0% mgmt
Financing live
Cash to close
- Down payment
- $49,750
- Closing costs
- $5,970
- Reserves months
- —
- Total cash needed
- —
Loan-product check · same deal, 3 products live
Conventional
25% down · 7.5% · 30yr
- Down + closing
- —
- Monthly P&I
- —
- Monthly cashflow
- —
- DSCR
- —
- Eligible?
- —
Personal DTI + credit; lowest rate.
DSCR
20% down · 8.5% · 30yr
- Down + closing
- —
- Monthly P&I
- —
- Monthly cashflow
- —
- DSCR
- —
- Eligible?
- —
No personal income docs; deal must DSCR.
Hard money
10% down · 12.0% · 12mo
- Down + closing
- —
- Monthly P&I
- —
- Monthly cashflow
- —
- DSCR
- —
- Eligible?
- —
Short-term bridge; refi at stabilization.
Rent comps 40 comps
| Address | Beds | Baths | Sqft | Rent | $/sqft | DOM | Units | Dist |
|---|---|---|---|---|---|---|---|---|
| 908 N Zang Blvd Unit A Dallas, TX | 1.0 | 1.0 | 780 | $925 | $1.19 | 44d | 1 | 0.04mi |
| 888 N Zang Blvd Dallas, TX | 1.0 | 1.0 | 750 | $1,644 | $2.19 | 7d | 5 | 0.07mi |
| 230 E 5th St Unit 303 Dallas, TX | 1.0 | 1.0 | 665 | $1,469 | $2.21 | 25d | 1 | 0.16mi |
| 701 Elsbeth St Dallas, TX | 2.0 | 1.0 | 850 | $1,150 | $1.35 | 44d | 1 | 0.26mi |
| 111 W Davis St Dallas, TX | 1.0–2.0 | 1.0–2.0 | 999 | $2,961 | $2.96 | 0d | 30 | 0.26mi |
| 826 N Bishop Ave Dallas, TX | 1.0 | 1.0 | 879 | $1,395 | $1.59 | 44d | 1 | 0.27mi |
| 908 N Bishop Ave Unit 2-103 Dallas, TX | 1.0 | 1.0 | 655 | $1,550 | $2.37 | 44d | 1 | 0.27mi |
| 320 W Canty St Unit 2 Dallas, TX | 1.0 | 1.0 | 795 | $1,425 | $1.79 | 14d | 1 | 0.28mi |
| 1207 N Zang Blvd Dallas, TX | 3.0 | 1.0–2.0 | 1009 | $2,486 | $2.46 | 2d | 29 | 0.29mi |
| 120 E Colorado Blvd Dallas, TX | 1.0 | 1.0 | 659 | $863 | $1.31 | 44d | 1 | 0.31mi |
| 615 Elsbeth St Dallas, TX | 1.0–2.0 | 1.0 | 760 | $1,599 | $2.10 | 7d | 2 | 0.32mi |
| 211 E Davis St Dallas, TX | 1.0–2.0 | 1.0–2.0 | 707 | $1,550 | $2.19 | 4d | 8 | 0.32mi |
| 801 N Bishop Ave Unit 816 Dallas, TX | 1.0 | 1.0 | 745 | $1,570 | $2.11 | 0d | 1 | 0.32mi |
| 801 N Bishop Ave Unit 1-107 Dallas, TX | 1.0 | 1.0 | 872 | $1,749 | $2.01 | 25d | 1 | 0.32mi |
| 801 N Bishop Ave Unit 412 Dallas, TX | 1.0 | 1.0 | 745 | $1,524 | $2.05 | 13d | 1 | 0.32mi |
| 801 N Bishop Ave Unit 2-103 Dallas, TX | 1.0 | 1.0 | 655 | $1,550 | $2.37 | 44d | 1 | 0.32mi |
| 801 N Bishop Ave Unit 816 Dallas, TX | 1.0 | 1.0 | 745 | $1,570 | $2.11 | 15d | 1 | 0.32mi |
| 321 E 8th St Dallas, TX | 1.0 | 1.0 | 544 | $899 | $1.65 | 0d | 1 | 0.34mi |
| 308 E 8th St Dallas, TX | 1.0 | 1.0 | 600 | $995 | $1.66 | 44d | 1 | 0.37mi |
| 308 E 8th St Unit A1-102 Dallas, TX | 1.0 | 1.0 | 600 | $995 | $1.66 | 25d | 1 | 0.37mi |
| 406 Lansing St Dallas, TX | 2.0 | 2.0 | 1014 | $2,145 | $2.12 | 7d | 1 | 0.40mi |
| 501 N Marsalis Ave Dallas, TX | 1.0 | 1.0 | 455 | $1,024 | $2.25 | 8d | 3 | 0.40mi |
| 329 E Colorado Blvd Dallas, TX | 1.0–2.0 | 1.0–2.0 | 1086 | $2,070 | $1.91 | 25d | 2 | 0.43mi |
| 329 E Colorado Blvd Unit 1121 Dallas, TX | 1.0 | 1.0 | 822 | $1,344 | $1.64 | 44d | 1 | 0.43mi |
| 738 Woodlawn Ave Unit 450 Dallas, TX | 2.0 | 2.0 | 1100 | $1,900 | $1.73 | 21d | 1 | 0.43mi |
| 738 Woodlawn Ave Unit 446 Dallas, TX | 2.0 | 2.0 | 1100 | $1,495 | $1.36 | 21d | 1 | 0.43mi |
| 409 E 9th St Dallas, TX | 1.0 | 1.0 | 538 | $970 | $1.80 | 44d | 4 | 0.43mi |
| 606 N Marsalis Ave Dallas, TX | 2.0 | 1.0 | 800 | $1,400 | $1.75 | 0d | 1 | 0.46mi |
| 404 E 9th St Dallas, TX | 1.0 | 1.0 | 550 | $1,150 | $2.09 | 2d | 2 | 0.47mi |
| 609 N Lancaster Ave Dallas, TX | 1.0–2.0 | 1.0 | 725 | $1,149 | $1.58 | 2d | 2 | 0.50mi |
| 627 N Lancaster Ave Dallas, TX | 2.0 | 1.0–2.0 | 800 | $1,950 | $2.44 | 4d | 7 | 0.52mi |
| 706 Cedar Hill Ave Dallas, TX | 2.0 | 1.0 | 805 | $2,100 | $2.61 | 44d | 1 | 0.53mi |
| 506 N Lancaster Ave Unit 506A Dallas, TX | 1.0 | 1.0 | 798 | $1,400 | $1.75 | 3d | 1 | 0.53mi |
| 612 W 5th St Dallas, TX | 2.0 | 1.0 | 992 | $2,150 | $2.17 | 25d | 1 | 0.54mi |
| 624 N Lancaster Ave Dallas, TX | 2.0 | 1.0–2.0 | 800 | $2,365 | $2.96 | 8d | 4 | 0.54mi |
| 239 W 9th St Unit 1999 Dallas, TX | 1.0 | 1.0 | 840 | $1,445 | $1.72 | 44d | 1 | 0.54mi |
| 239 W 9th St Dallas, TX | 1.0 | 1.0 | 780 | $1,425 | $1.83 | 22d | 1 | 0.54mi |
| 929 N Marsalis Ave Dallas, TX | 1.0–2.0 | 1.0–2.0 | 672 | $1,399 | $2.08 | 8d | 3 | 0.55mi |
| 1409 N Zang Blvd Dallas, TX | 1.0–2.0 | 1.0–2.0 | 940 | $2,010 | $2.14 | 0d | 30 | 0.55mi |
| 523 N Ewing Ave Dallas, TX | 1.0 | 1.0 | 628 | $1,250 | $1.99 | 5d | 1 | 0.58mi |
Listing history 12 events
-
2026-06-15status $199,000 Pending 17 DOM
-
2026-06-15days on market $199,000 Active Option Contract 17 DOM
-
2026-06-13days on market $199,000 Active Option Contract 15 DOM
-
2026-06-09days on market $199,000 Active Option Contract 11 DOM
-
2026-06-08days on market $199,000 Active Option Contract 10 DOM
-
2026-06-07statusdays on market $199,000 Active Option Contract 9 DOM
-
2026-06-04days on market $199,000 Active 6 DOM
-
2026-06-03days on market $199,000 Active 5 DOM
-
2026-06-02remarks 630-char remark
-
2026-06-02days on market $199,000 Active 4 DOM
-
2026-06-01days on market $199,000 Active 3 DOM
-
2026-05-31days on market $199,000 Active 2 DOM
ⓘ Source: listings_history table (triggers on properties + properties_extension) + one-shot
backfill from property_details.listing_events for pre-trigger history.
Tax reassessment forecast TX · Resets to sale price
- Current annual tax
- $3,593 · $299/mo
- Projected year-2 tax
- $3,642 · $303/mo
- Expected delta
- +$48/yr (+$4/mo · 1.3%)
ⓘ Screening estimate from a state-policy table — verify with the county assessor before closing.
Climate risk First Street
- Flood 1/10 Low FEMA zone X (unshaded) · 0% chance over 30 yrs
- Wildfire 1/10 Low
- Heat 7/10 Severe 7 d/yr ≥109°F today · 23 d/yr by 30 yrs out
- Wind 6/10 Major 27% chance of damaging wind over 30 yrs
- Air quality 3/10 Moderate 2 unhealthy d/yr today · 3 by 30 yrs out
Nearby sold comps map
Loading sold comps map…
Walkable amenities ~0.75 mi
Loading nearby amenities…
Taxation est. · year 1
- Rental income
- $18,601
- − Mortgage interest
- −$11,147
- − Property taxes
- −$3,593
- − Insurance
- −$995
- − Repairs & maintenance
- −$1,488
- − Management
- −$1,488
- − Depreciation
- −$5,789
- Taxable loss
- −$5,900
- Est. tax savings @ 24.0%
- +$1,416
- After-tax cash flow
- $-1,001/yr
For passive investors: Depreciation is non-cash, so a rental often shows a tax loss while cash-flowing — sheltering income. Rental losses are passive: they offset passive income freely, and up to $25,000/yr can offset ordinary (W-2) income if you actively participate and your MAGI is under $100k (phasing out to $0 by $150k); unused losses carry forward. On sale, claimed depreciation is recaptured at up to 25%, and gains may owe capital-gains tax (a 1031 exchange can defer both). Figures are a year-1 estimate at your 24.0% rate — not tax advice; consult a CPA.
Schools (NCES district)
- District
- Dallas ISD
- NCES district ID
- 4816230
- Math proficiency
- 31% ▼ -16.00%
- Reading proficiency
- 36% ▼ -4.00%
- Median HH income
- $42,881
- Composite
- 28.41/100
- National rank
- #6763
- State rank
- #559 of 826 in TX
Livability — Dallas
- Score
- 81/100
- State rank
- #24
- US rank
- #1380
Category grades
Schools grade is shown separately in the Schools card above.
Census & demographics
- Census place
- Dallas, TX
- County
- Dallas County · 2,612,404 people
- City population
- 1,168,437
- Metro
- Dallas-Fort Worth-Arlington, TX
- Population (ZIP)
- 15,775
- Household income
- $46,989
- Rent vs Own
- Severe rent burden
- 948.0
Population outlook (Dallas County) Hauer SSP2
- Today (2025)
- 2,979,839 people
- By 2030
- 3,191,823 · +7.1%
- By 2040
- 3,619,611 · +21.5%
- By 2050
- 4,026,915 · +35.1%
- By 2075
- 4,957,073 · +66.4%
- By 2100
- 5,508,725 · +84.9%
Race, ethnicity, and origin ACS 2023
- Neighborhood character
- Diverse neighborhood (Simpson 0.55)
- Race & ethnicity
- Hispanic / Latino 59% Black 31% Two or more races 17% White 7% Native American 2%
- Hispanic origin (detail)
- Mexican 53%
- Common ancestry
- Lithuanian 1% Swiss 1%
- Foreign-born
- 29% · Canada, China, Jamaica
- Languages at home
- 47% English-only · Spanish 51% French/Haitian/Cajun 1%
Political lean MEDSL · Dallas
- 2024 margin
- Strong D (+22.2) · D 60.2% · R 38.0% · Other 1.8%
- 2008→2024 swing
- +6.9pp toward D · 2008: 15.3pp · 2024: 22.2pp
- All cycles
- 2024: D+22.2 2020: D+31.6 2016: D+26.2 2012: D+15.4 2008: D+15.3
Not yet ingested
- Civics
- —
Market trends
- HPI YoY
- ▲ 86.64%
- Current HPI
- 358.9507
- Rent YoY
- ▼ -2.72%
- Metro
- Dallas-Fort Worth-Arlington, TX
- State GDP YoY
- ▲ 3.95%
- F500 in state
- 110
Industry mix (Fortune 500 HQ in TX)
| Industry | F500 HQs | Revenue |
|---|---|---|
| Energy | 16 | $1,198B |
|
||
| Technology | 5 | $198B |
|
||
| Engineering / Construction | 4 | $72B |
|
||
| Energy Services | 3 | $60B |
|
||
| Utilities | 3 | $41B |
|
||
| Healthcare | 2 | $330B |
|
||
Price history
1 event — show timeline
- 2026-05-29 Listed $199,000 NTREIS
Property tax history
+6.8%/yrLatest (2025): $3,593 · -9.3% YoY. Source: county tax records.
Cash-flow waterfall
monthlySold comps — $/sqft
last 12 mo · ≤1 miLoading sold comps…