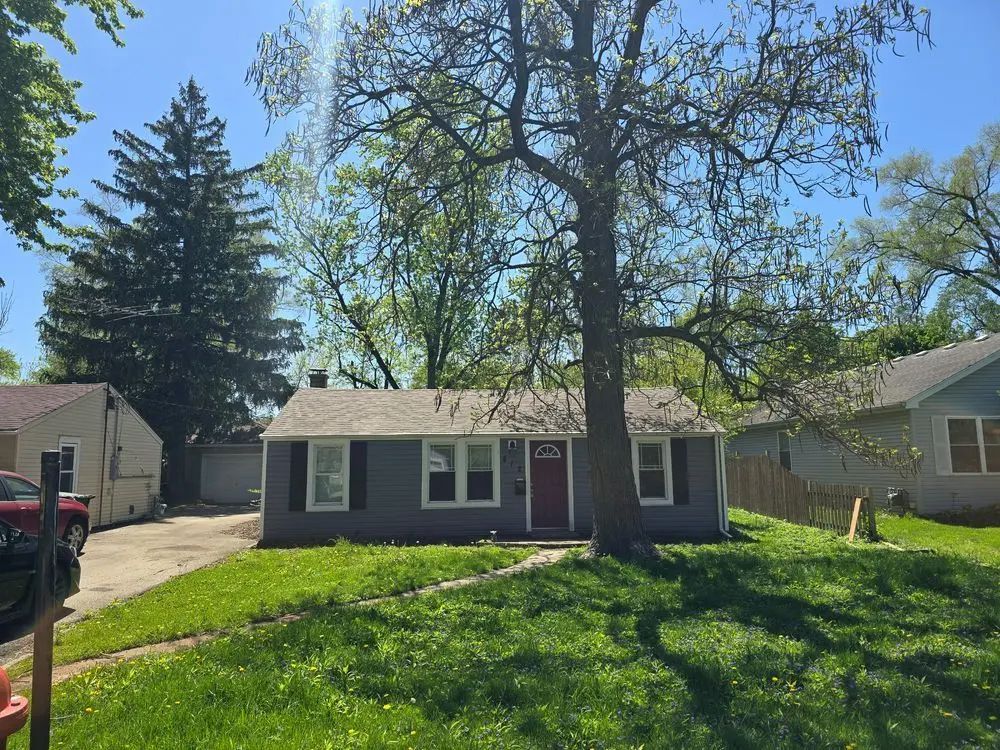
412 Dellwood Ave · Fairmont, IL
Flood risk 4/10 · Minor
- FEMA flood zone
- X (unshaded)
- Chance of flooding over 30 yrs
- 0.22%
- Est. flood insurance / yr
- $507 – $1,088
Fire risk 1/10 · Minimal
- Est. fire insurance / yr
- $804 – $1,492
Heat risk 3/10 · Minor
- Hot days now (above 102°F)
- 7 days/yr
- Hot days in 30 yrs
- 15 days/yr
Wind risk 2/10 · Minimal
- Chance of severe wind over 30 yrs
- 0.0%
Air-quality risk 2/10 · Minimal
- Unhealthy air days now
- 1 days/yr
- Unhealthy air days in 30 yrs
- 2 days/yr
Risk factors via First Street. Map © Google.
Why this score? — see what drove the C+ grade
The composite is a weighted blend of 9 inputs, each scored 0–100. Each bar is that input's sub-score; the figure is the points it added to the 100-point composite (weight × sub-score).
- Cash flow +27.0/30.0
- DSCR +9.3/10.0
- ARV discount +7.5/15.0
- 1% rule +7.2/10.0
- Rent growth +3.5/5.0
- Schools +3.4/10.0
- Livability +3.4/5.0
- Condition / age +2.5/5.0
- Appreciation +0.0/10.0
$174,900
🖨 Deal sheet (PDF) 📄 Offer letter ✓ Due diligence
Listing remarks MLS
Fantastic Lockport opportunity. Great Ranch home in Lockport. 2 bedrooms 1 bathroom. Living room and family room! Breakfast bar in kitchen. Detached garage. Located near 355 Expressway for convenient transportation.
Key facts
- Remodeled bathroom
- Functional layout
- Conveniently located
Tags
Property features AI
Exterior
- Home design: House
- Exterior features: Lot of approximately 0.20 acres
Neighborhood map
What this means for you Summary
Snapshot
- This is a 3-bed/1.0-bath other listed at $175k.
Deal economics
- At list price, monthly cash flow is $487 ($6k/yr) — positive.
- The deal already cash-flows at list — no discount required.
- Meets the 1% rule at list price ($2k rent vs $175k).
- Recommended offer: $172k (1.5% below list) — sets the bar for market timing.
Location & tenants
- Location reads 68/100 on livability (#455 in IL) — a middle-class / working-renter tenant base. Strengths: commute A+, cost of living A+, housing A+; Watch: amenities F, health & safety F.
- Lockport Twp Hsd 205 (suburban): math 35% / reading 38% proficiency, ranked #153 of 620 in IL (top 25%) — families likely to look elsewhere, expect single-tenant / working-renter base with shorter leases.
- Zoned schools: Fairmont School (math 8% / reading 12%, grade F, #1,517 of 2,056 statewide, top 78%, 312 students, 0% FRL); Lockport Township High Sch East (math 35% / reading 38%, grade F, #117 of 693 statewide, top 17%, 3,872 students, 0% FRL).
- Zoned-school proficiency averages 23% at this address vs 36% district-wide (-13 pts) — the specific schools serving this property underperform the Lockport Twp Hsd 205 average; the district grade overstates school quality for this exact location.
- Market conditions: Rents rising (+3.9%/yr); 133 active listings in the ZIP; 9 comparable units currently listed for rent nearby; rentals at typical pace (median 23d on market — plan ~3-4 weeks tenant-placement turnaround); solid renter incomes; 2,028 units permitted in Will County in 2024 (530 in 5+ unit buildings).
Forward outlook
- Local home prices are declining (-3.0%/yr); year-one equity from $1k of loan paydown is wiped out by about $5k of value loss. Plan a longer hold.
- Will County population projected to shrink 4% by 2050 — rents likely to lag national; underwrite the cash flow, not the appreciation.
- At projected returns (-3.0% appreciation + 3.9% rent growth), your $49k cash investment doubles in ~9 years — after that, you're playing with house money.
Negotiation context
- It's been on market 17 days — a 2% lower offer ($172k) is reasonable based on typical stale-listing flexibility.
- 4 sale attempts since 19y ago with the ask held roughly flat each time — persistent listings suggest the price (not the market) is what's stuck; bring a comps-based counter.
- Current owner paid $56k; list at $175k implies a 212% gain — meaningful room to come down on a strong offer.
Questions for the listing agent
- Built in 1960 — when were the roof, HVAC, electrical panel, plumbing, and water heater last replaced?
- Is there a deadline driving the sale (1031 exchange, divorce, estate, relocation)? That informs how much negotiation room exists.
- Schools are F-rated, which usually means shorter tenancies and higher turnover. Who's the typical renter profile here, and what's been the actual vacancy rate?
- What's the average days-on-market for RENTAL listings here right now (not sales)? A rising rental-DOM trend means longer vacancies and softer asking-rent achievability than the comps imply.
- What's the recent tenant-quality profile in this submarket — average credit score on applications, eviction rate, late-payment / NSF rate, and stable-employment percentage? A property-management company in the area should have these aggregated.
- How much new for-sale + rental construction is in the pipeline within 1–3 miles? Heavy new supply typically softens prices + rents 12–24 months out; constrained supply supports both.
Investment metrics
- 1% rule
- 1.22% ✓
- Cap rate
- 9.64%
- Cash-on-cash
- 11.94%
- DSCR
- 1.53
- GRM
- 6.8
CMA / ARV
No comps found within radius.
Projected returns pro-forma
-3.0% appreciation · 3.91% rent growth · sell at horizon
- IRR
- 2.5%
- Equity multiple
- 1.10×
- Total profit
- $4,707
- Equity at exit
- $26,078
- IRR
- 12.9%
- Equity multiple
- 2.07×
- Total profit
- $52,448
- Equity at exit
- $15,122
Cash invested: $48,972 (down + closing). Projections, not guarantees.
Landlord ↔ Tenant lean methodology
- Overall (STATE)
- 43 Moderately Tenant-Leaning
- State Illinois
- 43 Moderately Tenant-Leaning · D+7
- County
- — inherits STATE
- City
- — inherits STATE
ZIP-level market 60441
- Home prices YoY
- -33.0%
- Rents YoY
- 3.9%
- Active inventory
- 133
- Price-to-rent
- 6.8×
Monthly cashflow live
- Estimated rent
- $2,139 high interval (Pro) →
- Mortgage (P&I)
- −$917
- Tax from tax record
- −$212 /mo · $2,548/yr
- Insurance
- −$73
- HOA
- −$0
- Lot rent
- −$0
- Vacancy / Maint / Mgmt
- −$449
- Net cashflow
- $487
Break-even live
Sensitivity live
| Price | -10% $586 | -5% $537 | +0% $487 | +5% $438 | +10% $388 |
|---|---|---|---|---|---|
| Rent | -10% $318 | -5% $403 | +0% $487 | +5% $572 | +10% $656 |
| Rate | -1.0pp $575 | -0.5pp $532 | base $487 | +0.5pp $442 | +1.0pp $396 |
UW: 25.0% down · 7.5% · 30yr · 1.5% tax · 5.0% vac · 8.0% maint · 8.0% mgmt
Financing live
Cash to close
- Down payment
- $43,725
- Closing costs
- $5,247
- Reserves months
- —
- Total cash needed
- —
Loan-product check · same deal, 3 products live
Conventional
25% down · 7.5% · 30yr
- Down + closing
- —
- Monthly P&I
- —
- Monthly cashflow
- —
- DSCR
- —
- Eligible?
- —
Personal DTI + credit; lowest rate.
DSCR
20% down · 8.5% · 30yr
- Down + closing
- —
- Monthly P&I
- —
- Monthly cashflow
- —
- DSCR
- —
- Eligible?
- —
No personal income docs; deal must DSCR.
Hard money
10% down · 12.0% · 12mo
- Down + closing
- —
- Monthly P&I
- —
- Monthly cashflow
- —
- DSCR
- —
- Eligible?
- —
Short-term bridge; refi at stabilization.
Rent comps 9 comps
| Address | Beds | Baths | Sqft | Rent | $/sqft | DOM | Units | Dist |
|---|---|---|---|---|---|---|---|---|
| 333 Hughes Ave Unit 1S Lockport, IL | 2.0 | 1.0 | 800 | $1,345 | $1.68 | 27d | 1 | 0.61mi |
| 333 Hughes Ave Lockport, IL | 2.0 | 1.0 | 800 | $1,345 | $1.68 | 23d | 1 | 0.61mi |
| 1200 Ada St Joliet, IL | 2.0 | 1.0 | 1023 | $1,900 | $1.86 | 26d | 1 | 1.21mi |
| 560 Diane Ct Lockport, IL | 1.0–2.0 | 1.0–1.5 | 721 | $1,800 | $2.50 | 1d | 4 | 1.28mi |
| 309 May St Lockport, IL | 3.0 | 1.0 | 1000 | $2,600 | $2.60 | 5d | 1 | 1.35mi |
| 309 May St Unit 2 Lockport, IL | 3.0 | 1.0 | 1000 | $2,400 | $2.40 | 12d | 1 | 1.35mi |
| 309 May St Unit 1 Lockport, IL | 3.0 | 1.0 | 1000 | $2,600 | $2.60 | 12d | 1 | 1.35mi |
| 557 E Division St Unit 2 Lockport, IL | 2.0 | 1.0 | 1000 | $1,700 | $1.70 | 24d | 1 | 1.47mi |
| 575 E Division St Lockport, IL | 3.0 | 1.0 | 800 | $1,950 | $2.44 | 27d | 1 | 1.49mi |
Listing history 11 events
-
2026-06-21days on market $174,900 Active 17 DOM
-
2026-06-18days on market $174,900 Active 14 DOM
-
2026-06-17days on market $174,900 Active 13 DOM
-
2026-06-16days on market $174,900 Active 12 DOM
-
2026-06-15days on market $174,900 Active 11 DOM
-
2026-06-13days on market $174,900 Active 9 DOM
-
2026-06-09days on market $174,900 Active 5 DOM
-
2026-06-08days on market $174,900 Active 4 DOM
-
2026-06-07days on market $174,900 Active 3 DOM
-
2026-06-04remarks 699-char remark
-
2026-06-04$174,900 Active 1 DOM
ⓘ Source: listings_history table (triggers on properties + properties_extension) + one-shot
backfill from property_details.listing_events for pre-trigger history.
Tax reassessment forecast IL · Partial reset (capped growth)
- Current annual tax
- $2,548 · $212/mo
- Projected year-2 tax
- $3,259 · $272/mo
- Expected delta
- +$711/yr (+$59/mo · 27.9%)
ⓘ Screening estimate from a state-policy table — verify with the county assessor before closing.
Climate risk First Street
- Flood 4/10 Moderate FEMA zone X (unshaded) · 22% chance over 30 yrs
- Wildfire 1/10 Low
- Heat 3/10 Moderate 7 d/yr ≥102°F today · 15 d/yr by 30 yrs out
- Wind 2/10 Low 0% chance of damaging wind over 30 yrs
- Air quality 2/10 Low 1 unhealthy d/yr today · 2 by 30 yrs out
Nearby sold comps map
Loading sold comps map…
Walkable amenities ~0.75 mi
Loading nearby amenities…
Taxation est. · year 1
- Rental income
- $25,668
- − Mortgage interest
- −$9,797
- − Property taxes
- −$2,548
- − Insurance
- −$874
- − Repairs & maintenance
- −$2,053
- − Management
- −$2,053
- − Depreciation
- −$5,088
- Taxable income
- $3,254
- Est. tax owed @ 24.0%
- −$781
- After-tax cash flow
- $5,068/yr
For passive investors: Depreciation is non-cash, so a rental often shows a tax loss while cash-flowing — sheltering income. Rental losses are passive: they offset passive income freely, and up to $25,000/yr can offset ordinary (W-2) income if you actively participate and your MAGI is under $100k (phasing out to $0 by $150k); unused losses carry forward. On sale, claimed depreciation is recaptured at up to 25%, and gains may owe capital-gains tax (a 1031 exchange can defer both). Figures are a year-1 estimate at your 24.0% rate — not tax advice; consult a CPA.
Schools (NCES district)
- District
- Lockport Twp Hsd 205
- NCES district ID
- 1723350
- Math proficiency
- 35% ▼ -5.00%
- Reading proficiency
- 38% ▼ -4.00%
- Median HH income
- $69,994
- Composite
- 33.5/100
- National rank
- #5440
- State rank
- #153 of 620 in IL
Livability — Fairmont
- Score
- 68/100
- State rank
- #455
- US rank
- #9333
Category grades
Schools grade is shown separately in the Schools card above.
Census & demographics
- Census place
- Fairmont, IL
- County
- Will County · 412,448 people
- Metro
- Chicago-Naperville-Elgin, IL-IN-WI
- Population (ZIP)
- 36,844
- Household income
- $103,374
- Rent vs Own
- Severe rent burden
- 519.0
Population outlook (Will County) Hauer SSP2
- Today (2025)
- 705,368 people
- By 2030
- 708,154 · +0.4%
- By 2040
- 702,692 · -0.4%
- By 2050
- 680,249 · -3.6%
- By 2075
- 611,990 · -13.2%
- By 2100
- 516,215 · -26.8%
Race, ethnicity, and origin ACS 2023
- Neighborhood character
- Predominantly White (76%)
- Race & ethnicity
- White 76% Hispanic / Latino 12% Two or more races 9% Black 7%
- Hispanic origin (detail)
- Mexican 9% Puerto Rican 1%
- Common ancestry
- Romanian 18% Iranian 2% Lithuanian 2%
- Foreign-born
- 7% · Canada
- Languages at home
- 86% English-only · Spanish 7% Russian/Polish/Slavic 4% Other Indo-European 2%
Political lean MEDSL · Will
- 2024 margin
- Toss-up / Even · D 50.1% · R 48.5% · Other 1.4%
- 2008→2024 swing
- -11.6pp toward R · 2008: 13.2pp · 2024: 1.6pp
- All cycles
- 2024: D+1.6 2020: D+8.3 2016: D+5.7 2012: D+3.7 2008: D+13.2
Not yet ingested
- Civics
- —
Market trends
- HPI YoY
- ▼ -99.43%
- Current HPI
- 201.5857
- Rent YoY
- ▲ 3.91%
- Metro
- Chicago-Naperville-Elgin, IL-IN-WI
- State GDP YoY
- ▲ 1.59%
- F500 in state
- 60
Industry mix (Fortune 500 HQ in IL)
| Industry | F500 HQs | Revenue |
|---|---|---|
| Insurance | 4 | $201B |
|
||
| Consumer Goods | 4 | $87B |
|
||
| Industrial Machinery | 3 | $64B |
|
||
| Healthcare | 2 | $55B |
|
||
| Retail / Pharmacy | 1 | $148B |
|
||
| Agriculture / Food | 1 | $86B |
|
||
Price history
+234.4% since first listed8 events — show timeline
- 2026-06-04 Listed $174,900 ForSaleByOwner.com
- 2019-03-20 Sold (MLS) $56,000 MRED as Distributed by MLS Grid
- 2019-02-27 Pending — MRED as Distributed by MLS Grid
- 2019-01-30 Listed $52,300 MRED as Distributed by MLS Grid
- 2009-07-24 Listing Removed — MRED as Distributed by MLS Grid
- 2009-07-22 Listed — MRED as Distributed by MLS Grid
- 2008-02-09 Listing Removed — MRED as Distributed by MLS Grid
- 2007-11-11 Listed — MRED as Distributed by MLS Grid
Property tax history
+2.3%/yrLatest (2024): $2,548 · +10.2% YoY. Source: county tax records.
Cash-flow waterfall
monthlySold comps — $/sqft
last 12 mo · ≤1 miLoading sold comps…