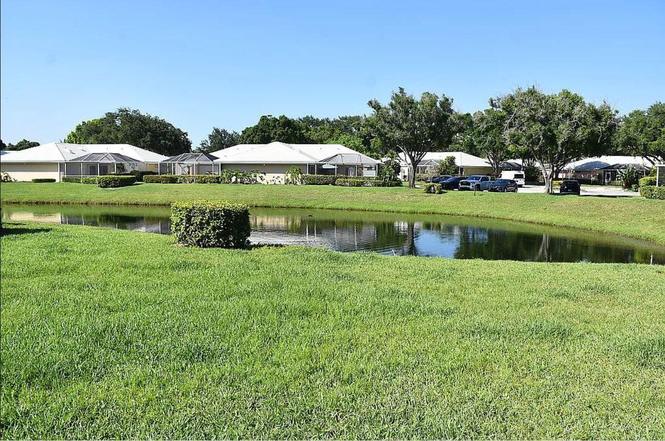
 🌊 Lakefront
1101 Sun Terrace Ct · Palm Beach Gardens, FL
Flood risk 1/10 · Minimal
- FEMA flood zone
- X (unshaded)
- Chance of flooding over 30 yrs
- 0.0%
- Est. flood insurance / yr
- $507 – $1,088
Fire risk 1/10 · Minimal
- Est. fire insurance / yr
- $947 – $1,759
Heat risk 9/10 · Severe
- Hot days now (above 106°F)
- 6 days/yr
- Hot days in 30 yrs
- 21 days/yr
Wind risk 10/10 · Severe
- Chance of severe wind over 30 yrs
- 99.0%
Air-quality risk 2/10 · Minimal
- Unhealthy air days now
- 0 days/yr
- Unhealthy air days in 30 yrs
- 1 days/yr
Risk factors via First Street. Map © Google.
Why this score? — see what drove the D grade
The composite is a weighted blend of 9 inputs, each scored 0–100. Each bar is that input's sub-score; the figure is the points it added to the 100-point composite (weight × sub-score).
- Cash flow +11.4/30.0
- ARV discount +7.5/15.0
- 1% rule +4.3/10.0
- Schools +4.3/10.0
- Rent growth +4.0/5.0
- Livability +3.5/5.0
- DSCR +3.3/10.0
- Condition / age +2.5/5.0
- Appreciation +0.0/10.0
$383,900
🖨 Deal sheet (PDF) 📄 Offer letter ✓ Due diligence
Listing remarks MLS
This 2 bedroom 2 full bath tile and wood flooring Town house is located in a desirable community, offering 1140 square feet of living area built in the year 1990.
Key facts
- Keyless entry
- Lake view
- Hurricane shutters
Tags
Property features AI
Finance
- Other: Association present
- Financial info: Pets allowed with no restrictions
- HOA & community: Community amenities: pool, sidewalks, street lights, parking; Monthly HOA fee of $517; HOA fee covers cable TV, insurance, grounds maintenance, common areas, common real estate tax, recreation facility
Exterior
- Parking: Assigned parking
- Security: Gated community (no guard)
- Utilities: Public water; Public sewer; Three-phase electric; Cable available
- Home design: Townhouse; Single-story; Resale condition; Faces west
- Construction: Built with CBS construction; Concrete and tile roof; Public records list living area as 1,140 sq ft
- Exterior features: Screened porch; Open porch; Patio; Not waterfront
Interior
- Kitchen: Dishwasher; Electric range; Microwave; Refrigerator; Kitchen island
- Bedrooms: 2 bedrooms on the main level
- Flooring: Carpet; Ceramic tile; Wood
- Bathrooms: 2 full bathrooms (both on the main level)
- Heating & cooling: Central electric heating; Central electric cooling
- Interior features: Built-in features; Cathedral and vaulted ceilings; Kitchen island; Custom mirrors; Skylights
- Laundry & utility: Laundry inside
Neighborhood map
What this means for you Summary
Snapshot
- This is a 2-bed/2.0-bath single-family listed at $384k.
Deal economics
- At list price, monthly cash flow is $-133 ($-2k/yr) — negative.
- To cash-flow at today's rent, offer at most $360k (6.1% below list).
- To meet the 1% rule (rent ≥ 1% of price), the offer needs to be $356k (7.3% below list).
- Recommended offer: $338k (12.0% below list) — sets the bar for market timing.
Location & tenants
- Location reads 69/100 on livability (#464 in FL) — a middle-class / working-renter tenant base. Strengths: crime A+, employment A+, housing A+; Watch: amenities F, commute F, cost of living F.
- Palm Beach (suburban): math 46% / reading 53% proficiency, ranked #34 of 73 in FL (top 47%) — families likely to look elsewhere, expect single-tenant / working-renter base with shorter leases.
- Zoned schools: Allamanda Elementary School (math 52% / reading 58%, grade C, #872 of 2,144 statewide, top 42%, 630 students, 48% FRL); Howell L. Watkins Middle School (math 18% / reading 33%, grade F, #512 of 571 statewide, top 90%, 794 students, 76% FRL); Palm Beach Gardens High School (math 19% / reading 40%, grade F, #447 of 667 statewide, top 68%, 2,570 students, 61% FRL).
- Zoned-school proficiency averages 37% at this address vs 50% district-wide (-13 pts) — the specific schools serving this property underperform the Palm Beach average; the district grade overstates school quality for this exact location.
- Market conditions: Rents rising fast (+6.0%/yr); 134 active listings in the ZIP; 22 comparable units currently listed for rent nearby; rentals at typical pace (median 27d on market — plan ~3-4 weeks tenant-placement turnaround); 3,974 units permitted in Palm Beach County in 2024 (1,012 in 5+ unit buildings).
- At $3,560/mo this rent would consume 60% of the median local household income ($71k/yr) (locally 903% of renters already pay >50% of income on rent) — very limited rent-growth headroom before tenants either downsize or default.
Forward outlook
- Local home prices are declining (-3.0%/yr); year-one equity from $3k of loan paydown is wiped out by about $12k of value loss. Plan a longer hold.
- Palm Beach County population projected at +30% by 2050 — long-run rental-demand tailwind backs the buy-and-hold thesis.
Negotiation context
- It's been on market 360 days — a 12% lower offer ($338k) is reasonable based on typical stale-listing flexibility.
- 13 sale attempts since 25y ago with the ask held roughly flat each time — persistent listings suggest the price (not the market) is what's stuck; bring a comps-based counter.
- Current owner paid $220k; list at $384k implies a 74% gain — meaningful room to come down on a strong offer.
Risks & watch-outs
- Climate carrying-cost: severe wind risk, 99% chance of damaging wind over 30y; extreme-heat days projected 6→21/yr by 2055 (HVAC capex compounding) — expect insurance premiums to compound above CPI over the hold.
Questions for the listing agent
- What do current leases actually rent for vs. the listed asking? Can we see a recent rent roll and the last 12 months of T-12 income?
- It's been on market 360 days. Have you received any prior offers? Is the seller open to a 12% concession, seller financing, or rate buy-down credit?
- What does the HOA fee cover, when was the last increase, and are there any pending special assessments or reserve-fund shortfalls?
- Why hasn't it sold? Are there any deal-killer items the seller is aware of (foundation, flood, title, zoning, code violations)?
- Is there a deadline driving the sale (1031 exchange, divorce, estate, relocation)? That informs how much negotiation room exists.
- Schools are B-rated — typically a magnet for longer-tenancy family renters. What's the average tenant stay here, and is there a school-zone premium baked into asking?
- The area grade is low — what's the realistic commute time and amenity access for the typical tenant pool here? Any planned neighborhood developments (good or bad) we should know about?
- This sits on a lake — are riparian / water-frontage rights deeded with the parcel? Any dock permits, shoreline easements, or HOA water-use restrictions?
- What's the documented flood / surge / shoreline-erosion history here (FEMA AND non-FEMA — e.g., storm surge, creek backup, septic-field saturation)?
- Any water-quality or seasonal algae-bloom issues that affect tenant satisfaction or short-term-rental demand?
- What's the average days-on-market for RENTAL listings here right now (not sales)? A rising rental-DOM trend means longer vacancies and softer asking-rent achievability than the comps imply.
- What's the recent tenant-quality profile in this submarket — average credit score on applications, eviction rate, late-payment / NSF rate, and stable-employment percentage? A property-management company in the area should have these aggregated.
- How much new for-sale + rental construction is in the pipeline within 1–3 miles? Heavy new supply typically softens prices + rents 12–24 months out; constrained supply supports both.
Investment metrics
- 1% rule
- 0.93% ✗
- Cap rate
- 5.88%
- Cash-on-cash
- -1.49%
- DSCR
- 0.93
- GRM
- 9.0
CMA / ARV
- ARV (on-the-fly)
- $776,045
- Comps found
- 2
Show comp detail 2 sales within ~0.75 mi
| Address | Dist | Beds/Ba | Sqft | Sold | Price | $/sf | Match |
|---|---|---|---|---|---|---|---|
| 9356 Bloomfield Dr | 0.68mi | 3/2.0 (+1) | 1,092 (-5%) | 5mo | $460,000 | $421 | 51 |
| 9148 Demery Dr | 0.77mi | 3/2.0 (+1) | 1,092 (-5%) | 20mo | $545,000 | $499 | 35 |
Match score weights: distance 35% · size 25% · config 20% · recency 20%. Top-matched comps best support the ARV.
Projected returns pro-forma
-3.0% appreciation · 5.97% rent growth · sell at horizon
- IRR
- -15.1%
- Equity multiple
- 0.45×
- Total profit
- $-59,517
- Equity at exit
- $57,241
- IRR
- -1.7%
- Equity multiple
- 0.87×
- Total profit
- $-14,035
- Equity at exit
- $33,193
Cash invested: $107,492 (down + closing). Projections, not guarantees.
Landlord ↔ Tenant lean methodology
- Overall (STATE)
- 87 Strongly Landlord-Friendly
- State Florida
- 87 Strongly Landlord-Friendly · R+3
- County
- — inherits STATE
- City
- — inherits STATE
ZIP-level market 33403
- Home prices YoY
- -19.6%
- Rents YoY
- 6.0%
- Active inventory
- 134
- Price-to-rent
- 9.0×
Monthly cashflow live
- Estimated rent
- $3,560 high interval (Pro) →
- Mortgage (P&I)
- −$2,013
- Tax from tax record
- −$256 /mo · $3,073/yr
- Insurance
- −$160
- HOA
- −$517
- Vacancy / Maint / Mgmt
- −$748
- Net cashflow
- $-133
Break-even live
Sensitivity live
| Price | -10% $84 | -5% $-25 | +0% $-133 | +5% $-242 | +10% $-351 |
|---|---|---|---|---|---|
| Rent | -10% $-415 | -5% $-274 | +0% $-133 | +5% $7 | +10% $148 |
| Rate | -1.0pp $60 | -0.5pp $-36 | base $-133 | +0.5pp $-233 | +1.0pp $-334 |
UW: 25.0% down · 7.5% · 30yr · 1.5% tax · 5.0% vac · 8.0% maint · 8.0% mgmt
Financing live
Cash to close
- Down payment
- $95,975
- Closing costs
- $11,517
- Reserves months
- —
- Total cash needed
- —
Loan-product check · same deal, 3 products live
Conventional
25% down · 7.5% · 30yr
- Down + closing
- —
- Monthly P&I
- —
- Monthly cashflow
- —
- DSCR
- —
- Eligible?
- —
Personal DTI + credit; lowest rate.
DSCR
20% down · 8.5% · 30yr
- Down + closing
- —
- Monthly P&I
- —
- Monthly cashflow
- —
- DSCR
- —
- Eligible?
- —
No personal income docs; deal must DSCR.
Hard money
10% down · 12.0% · 12mo
- Down + closing
- —
- Monthly P&I
- —
- Monthly cashflow
- —
- DSCR
- —
- Eligible?
- —
Short-term bridge; refi at stabilization.
Rent comps 22 comps
| Address | Beds | Baths | Sqft | Rent | $/sqft | DOM | Units | Dist |
|---|---|---|---|---|---|---|---|---|
| 8731 Uranus Ter West Palm Beach, FL | 2.0 | 1.0 | 900 | $3,200 | $3.56 | 26d | 1 | 0.47mi |
| 9446 Birmingham Dr Palm Beach Gardens, FL | 3.0 | 2.0 | 1092 | $3,250 | $2.98 | 7d | 1 | 0.66mi |
| 321 Sandtree Dr Palm Beach Gardens, FL | 3.0 | 2.5 | 1480 | $3,000 | $2.03 | 26d | 1 | 0.69mi |
| 321 Sandtree Dr Palm Beach Gardens, FL | 3.0 | 2.5 | 1480 | $3,000 | $2.03 | 13d | 1 | 0.69mi |
| 913 Lighthouse Dr North Palm Beach, FL | 3.0 | 2.5 | 1092 | $5,900 | $5.40 | 26d | 1 | 0.85mi |
| 9147 Reed Dr Unit A Palm Beach Gardens, FL | 3.0 | 2.0 | 1400 | $3,400 | $2.43 | 7d | 1 | 0.85mi |
| 9507 Bellewood St Palm Beach Gardens, FL | 3.0 | 2.0 | 1200 | $5,000 | $4.17 | 22d | 1 | 0.86mi |
| 908 Lighthouse Dr North Palm Beach, FL | 3.0 | 2.0 | 1478 | $4,250 | $2.88 | 26d | 1 | 0.87mi |
| 4292 Birdwood St Palm Beach Gardens, FL | 3.0 | 2.0 | 1232 | $3,800 | $3.08 | 26d | 1 | 0.88mi |
| 2545 Conroy Dr West Palm Beach, FL | 3.0 | 2.0 | 1066 | $3,295 | $3.09 | 26d | 1 | 0.90mi |
| 4295 Crestdale St Palm Beach Gardens, FL | 3.0 | 2.0 | 1366 | $4,500 | $3.29 | 26d | 1 | 0.90mi |
| 4289 S Mary Cir Palm Beach Gardens, FL | 2.0 | 2.0 | 1246 | $2,850 | $2.29 | 26d | 1 | 0.94mi |
| 4358 Birdwood St Palm Beach Gardens, FL | 3.0 | 2.0 | 1232 | $5,000 | $4.06 | 26d | 1 | 0.94mi |
| 4538 Arthur St Palm Beach Gardens, FL | 3.0 | 2.0 | 1336 | $2,900 | $2.17 | 26d | 1 | 1.11mi |
| 2750 Rio Vista Blvd Palm Beach Gardens, FL | 1.0–2.0 | 1.0–2.0 | 925 | $2,999 | $3.24 | 5d | 27 | 1.23mi |
| 2539 Wabash Dr West Palm Beach, FL | 3.0 | 2.5 | 1468 | $5,500 | $3.75 | 26d | 1 | 1.29mi |
| 9130 E Highland Pines Blvd Unit 1326852P Palm Beach Gardens, FL | 2.0–4.0 | 2.0–4.0 | 1721 | $3,746 | $2.18 | 1d | 2 | 1.32mi |
| 9126 E Highland Pines Blvd Unit 1326848P Palm Beach Gardens, FL | 2.0 | 2.0 | 1496 | $4,969 | $3.32 | 1d | 1 | 1.33mi |
| 624 Southwind Cir #2 North Palm Beach, FL | 2.0 | 2.0 | 718 | $3,750 | $5.22 | 26d | 1 | 1.36mi |
| 624 Southwind Cir Apt 4 North Palm Beach, FL | 3.0 | 2.0 | 1134 | $4,750 | $4.19 | 26d | 1 | 1.36mi |
| 624 Southwind Cir Unit 3 North Palm Beach, FL | 3.0 | 3.0 | 1316 | $5,500 | $4.18 | 26d | 1 | 1.36mi |
| 308 Southwind Ct Unit 8 North Palm Beach, FL | 2.0 | 2.0 | 1100 | $2,900 | $2.64 | 26d | 1 | 1.43mi |
HOA detail
- Monthly dues
- $517 · $6,204/yr
Listing history 50 events
-
2026-06-21days on market $383,900 Active 360 DOM
-
2026-06-18days on market $383,900 Active 357 DOM
-
2026-06-17days on market $383,900 Active 356 DOM
-
2026-06-16days on market $383,900 Active 355 DOM
-
2026-06-15days on market $383,900 Active 354 DOM
-
2026-06-13days on market $383,900 Active 352 DOM
-
2026-06-09days on market $383,900 Active 348 DOM
-
2026-06-07days on market $383,900 Active 346 DOM
-
2026-06-04days on market $383,900 Active 343 DOM
-
2026-06-03days on market $383,900 Active 342 DOM
-
2026-06-01days on market $383,900 Active 340 DOM
-
2026-05-31days on market $383,900 Active 339 DOM
-
2026-04-11price $383,900
-
2026-02-09price $388,900
-
2025-09-17status Active
-
2025-09-09historical Active Under Contract
-
2025-08-15price $393,900
-
2025-06-25$396,900 Active
-
2018-08-28soldstatus $220,000
-
2016-09-23soldstatus $165,409 Closed 162-char remark
Show marketing remark (162 chars)
This 2 bedroom 2 full bath tile and wood flooring Town house is located in a desirable community, offering 1140 square feet of living area built in the year 1990.
-
2016-08-17status Pending 162-char remark
Show marketing remark (162 chars)
This 2 bedroom 2 full bath tile and wood flooring Town house is located in a desirable community, offering 1140 square feet of living area built in the year 1990.
-
2016-08-10status Active 162-char remark
Show marketing remark (162 chars)
This 2 bedroom 2 full bath tile and wood flooring Town house is located in a desirable community, offering 1140 square feet of living area built in the year 1990.
-
2016-07-13price $182,300 162-char remark
Show marketing remark (162 chars)
This 2 bedroom 2 full bath tile and wood flooring Town house is located in a desirable community, offering 1140 square feet of living area built in the year 1990.
-
2016-07-13historical 162-char remark
Show marketing remark (162 chars)
This 2 bedroom 2 full bath tile and wood flooring Town house is located in a desirable community, offering 1140 square feet of living area built in the year 1990.
-
2016-06-28price $189,700 162-char remark
Show marketing remark (162 chars)
This 2 bedroom 2 full bath tile and wood flooring Town house is located in a desirable community, offering 1140 square feet of living area built in the year 1990.
-
2016-06-18status Active 162-char remark
Show marketing remark (162 chars)
This 2 bedroom 2 full bath tile and wood flooring Town house is located in a desirable community, offering 1140 square feet of living area built in the year 1990.
-
2016-06-02status Pending 162-char remark
Show marketing remark (162 chars)
This 2 bedroom 2 full bath tile and wood flooring Town house is located in a desirable community, offering 1140 square feet of living area built in the year 1990.
-
2016-06-02status Active 162-char remark
Show marketing remark (162 chars)
This 2 bedroom 2 full bath tile and wood flooring Town house is located in a desirable community, offering 1140 square feet of living area built in the year 1990.
-
2016-05-26historical 162-char remark
Show marketing remark (162 chars)
This 2 bedroom 2 full bath tile and wood flooring Town house is located in a desirable community, offering 1140 square feet of living area built in the year 1990.
-
2016-05-11$197,200 Active 162-char remark
Show marketing remark (162 chars)
This 2 bedroom 2 full bath tile and wood flooring Town house is located in a desirable community, offering 1140 square feet of living area built in the year 1990.
-
2015-09-24soldstatus $246,458
-
2014-10-31historical
-
2014-06-09historical Contingent
-
2014-05-23price $142,000 Active
-
2014-05-23status Active
-
2013-07-29status Pending
-
2013-05-24status Back On Market
-
2011-09-21Contingent
-
2011-07-05historical
-
2010-11-29$109,000
-
2010-11-17historical
-
2009-11-17$109,000
-
2003-09-05soldstatus $159,000
-
2003-08-29soldstatus $159,000
-
2003-07-03historical
-
2003-06-11$159,900
-
2001-07-19soldstatus $110,000
-
2001-06-29soldstatus $110,000
-
2001-06-11historical
-
2001-06-07$115,000
ⓘ Source: listings_history table (triggers on properties + properties_extension) + one-shot
backfill from property_details.listing_events for pre-trigger history.
Tax reassessment forecast FL · Resets to sale price
- Current annual tax
- $3,073 · $256/mo
- Projected year-2 tax
- $3,186 · $266/mo
- Expected delta
- +$114/yr (+$9/mo · 3.7%)
ⓘ Screening estimate from a state-policy table — verify with the county assessor before closing.
Climate risk First Street
- Flood 1/10 Low FEMA zone X (unshaded) · 0% chance over 30 yrs
- Wildfire 1/10 Low
- Heat 9/10 Extreme 6 d/yr ≥106°F today · 21 d/yr by 30 yrs out
- Wind 10/10 Extreme 99% chance of damaging wind over 30 yrs
- Air quality 2/10 Low 0 unhealthy d/yr today · 1 by 30 yrs out
Nearby sold comps map
Loading sold comps map…
Walkable amenities ~0.75 mi
Loading nearby amenities…
Taxation est. · year 1
- Rental income
- $42,726
- − Mortgage interest
- −$21,504
- − Property taxes
- −$3,073
- − Insurance
- −$1,920
- − Repairs & maintenance
- −$3,418
- − Management
- −$3,418
- − HOA
- −$6,204
- − Depreciation
- −$11,168
- Taxable loss
- −$7,979
- Est. tax savings @ 24.0%
- +$1,915
- After-tax cash flow
- $314/yr
For passive investors: Depreciation is non-cash, so a rental often shows a tax loss while cash-flowing — sheltering income. Rental losses are passive: they offset passive income freely, and up to $25,000/yr can offset ordinary (W-2) income if you actively participate and your MAGI is under $100k (phasing out to $0 by $150k); unused losses carry forward. On sale, claimed depreciation is recaptured at up to 25%, and gains may owe capital-gains tax (a 1031 exchange can defer both). Figures are a year-1 estimate at your 24.0% rate — not tax advice; consult a CPA.
Schools (NCES district)
- District
- Palm Beach
- NCES district ID
- 1201500
- Math proficiency
- 46% ▼ -16.00%
- Reading proficiency
- 53% ▼ -4.00%
- Median HH income
- $53,943
- Composite
- 42.72/100
- National rank
- #3160
- State rank
- #34 of 73 in FL
Livability — Palm Beach Gardens
- Score
- 69/100
- State rank
- #464
- US rank
- #8366
Category grades
Schools grade is shown separately in the Schools card above.
Census & demographics
- Census place
- Palm Beach Gardens, FL
- County
- Palm Beach County · 1,438,312 people
- City population
- 96,294
- Metro
- Miami-Fort Lauderdale-Pompano Beach, FL
- Population (ZIP)
- 14,370
- Household income
- $70,646
- Rent vs Own
- Severe rent burden
- 903.0
Population outlook (Palm Beach County) Hauer SSP2
- Today (2025)
- 1,637,487 people
- By 2030
- 1,743,255 · +6.5%
- By 2040
- 1,948,712 · +19.0%
- By 2050
- 2,132,979 · +30.3%
- By 2075
- 2,530,027 · +54.5%
- By 2100
- 2,706,979 · +65.3%
Race, ethnicity, and origin ACS 2023
- Neighborhood character
- Diverse neighborhood (Simpson 0.67)
- Race & ethnicity
- Black 46% White 31% Hispanic / Latino 17% Two or more races 12% Asian 2%
- Hispanic origin (detail)
- Mexican 3% Puerto Rican 4% Cuban 5%
- Common ancestry
- Hispanic 15% Italian 2% Romanian 1%
- Foreign-born
- 26% · Canada, China, Jamaica
- Languages at home
- 69% English-only · French/Haitian/Cajun 17% Spanish 12% Chinese 1%
Political lean MEDSL · Palm Beach
- 2024 margin
- Toss-up / Even · D 50.0% · R 49.2%
- 2008→2024 swing
- -22.1pp toward R · 2008: 22.9pp · 2024: 0.8pp
- All cycles
- 2024: D+0.8 2020: D+12.8 2016: D+15.3 2012: D+17.0 2008: D+22.9
Not yet ingested
- Civics
- —
Market trends
- HPI YoY
- ▼ -112.30%
- Current HPI
- 461.4045
- Rent YoY
- ▲ 5.97%
- Metro
- Miami-Fort Lauderdale-Pompano Beach, FL
- State GDP YoY
- ▲ 3.28%
- F500 in state
- 36
Industry mix (Fortune 500 HQ in FL)
| Industry | F500 HQs | Revenue |
|---|---|---|
| Industrial Technology | 2 | $29B |
|
||
| Insurance | 2 | $17B |
|
||
| Retail | 1 | $60B |
|
||
| Technology Distribution | 1 | $58B |
|
||
| Homebuilding | 1 | $35B |
|
||
| Technology Manufacturing | 1 | $35B |
|
||
Price history
+336.7% since first listed39 events — show timeline
- 2026-04-11 Price Changed $383,900 Beaches MLS
- 2026-02-09 Price Changed $388,900 Beaches MLS
- 2025-09-17 Relisted — Beaches MLS
- 2025-09-09 Contingent — Beaches MLS
- 2025-08-15 Price Changed $393,900 Beaches MLS
- 2025-06-25 Listed $396,900 Beaches MLS
- 2018-08-28 Sold (Public Records) $220,000 Public Records
- 2016-09-23 Sold (MLS) $165,409 Beaches MLS
- 2016-08-17 Pending — Beaches MLS
- 2016-08-10 Relisted — Beaches MLS
- 2016-07-13 Price Changed $182,300 Beaches MLS
- 2016-07-13 Listing Removed — Beaches MLS
- 2016-06-28 Price Changed $189,700 Beaches MLS
- 2016-06-18 Relisted — Beaches MLS
- 2016-06-02 Pending — Beaches MLS
- 2016-06-02 Relisted — Beaches MLS
- 2016-05-26 Listing Removed — Beaches MLS
- 2016-05-11 Listed $197,200 Beaches MLS
- 2015-09-24 Sold (Public Records) $246,458 Public Records
- 2014-10-31 Listing Removed — Beaches MLS
- 2014-06-09 Contingent — Beaches MLS
- 2014-05-23 Relisted — Beaches MLS
- 2014-05-23 Price Changed $142,000 Beaches MLS
- 2013-07-29 Pending — Beaches MLS
- 2013-05-24 Relisted — Beaches MLS
- 2011-09-21 Listed — Beaches MLS
- 2011-07-05 Listing Removed — Beaches MLS
- 2010-11-29 Listed $109,000 Beaches MLS
- 2010-11-17 Listing Removed — Beaches MLS
- 2009-11-17 Listed $109,000 Beaches MLS
- 2003-09-05 Sold (Public Records) $159,000 Public Records
- 2003-08-29 Sold (MLS) $159,000 Beaches MLS
- 2003-07-03 Listing Removed — Beaches MLS
- 2003-06-11 Listed $159,900 Beaches MLS
- 2001-07-19 Sold (Public Records) $110,000 Public Records
- 2001-06-29 Sold (MLS) $110,000 Beaches MLS
- 2001-06-11 Listing Removed — Beaches MLS
- 2001-06-07 Listed $115,000 Beaches MLS
- 1990-12-03 Sold (Public Records) $87,900 Public Records
Property tax history
+1.3%/yrLatest (2025): $3,073 · +3.4% YoY. Source: county tax records.
Cash-flow waterfall
monthlySold comps — $/sqft
last 12 mo · ≤1 miLoading sold comps…