1720 La Entrada Dr · Fort Mohave, AZ
Flood risk 1/10 · Minimal
- FEMA flood zone
- AO
- Chance of flooding over 30 yrs
- 0.0%
- Est. flood insurance / yr
- $848 – $2,087
Fire risk 5/10 · Moderate
- Est. fire insurance / yr
- $610 – $1,132
Heat risk 9/10 · Severe
- Hot days now (above 115°F)
- 6 days/yr
- Hot days in 30 yrs
- 14 days/yr
Wind risk 1/10 · Minimal
- Chance of severe wind over 30 yrs
- —
Air-quality risk 1/10 · Minimal
- Unhealthy air days now
- 0 days/yr
- Unhealthy air days in 30 yrs
- 0 days/yr
Risk factors via First Street. Map © Google.
Why this score? — see what drove the D- grade
The composite is a weighted blend of 9 inputs, each scored 0–100. Each bar is that input's sub-score; the figure is the points it added to the 100-point composite (weight × sub-score).
- Cash flow +12.3/30.0
- ARV discount +7.5/15.0
- 1% rule +3.6/10.0
- DSCR +3.6/10.0
- Livability +3.2/5.0
- Rent growth +2.5/5.0
- Condition / age +2.5/5.0
- Schools +1.3/10.0
- Appreciation +0.0/10.0
$174,000
🖨 Deal sheet 📄 Offer letter ✓ Due diligence
Listing remarks MLS
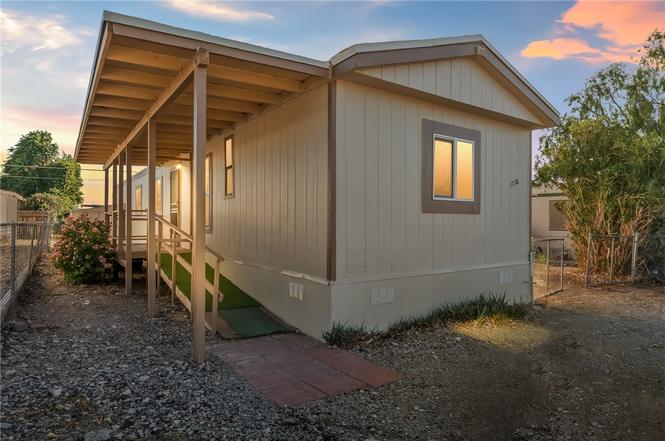
Handyman special. 3 bedrooms, 2 bath, split floor plan, fully fenced lot with RV parking.
Key facts
- Fully remodeled
- Community center
- Low-e windows
Tags
Property features AI
Finance
- HOA & community: Homeowners association with an annual fee of $75
Exterior
- Utilities: Public water; Septic tank sewer; Natural gas available
- Home design: Manufactured home (single wide); Residential property; Entry includes counters, casual dining, great room, kitchen
- Construction: Rolled/Hot Mop roof
- Exterior features: Covered patio; Patio; Chain link fencing in front and back yards; Accessible entrance; Community pool; Water-smart landscaping; Low-flow fixtures
Interior
- Kitchen: Electric oven; Electric range; Refrigerator; Solid surface counters
- Flooring: Vinyl
- Bathrooms: 2 full bathrooms
- Heating & cooling: Central heating (electric); Central air conditioning (electric)
- Interior features: Open floorplan; Low emissivity windows; Unfurnished
- Laundry & utility: Washer; Dryer; Electric dryer hookup inside
Neighborhood map
What this means for you Summary
Snapshot
- This is a 3-bed/2.0-bath land listed at $174k.
Deal economics
- At list price, monthly cash flow is $-155 ($-2k/yr) — negative.
- To cash-flow at today's rent, offer at most $152k (12.9% below list).
- To meet the 1% rule (rent ≥ 1% of price), the offer needs to be $149k (14.5% below list).
- Recommended offer: $149k (14.5% below list) — sets the bar for 1% rule.
- Cap rate 6.1% vs local median 4.2% in Fort Mohave — top-decile yield for the area; either an underpriced asset or a hidden risk that comps aren't pricing in. Stress-test before assuming the spread holds.
Location & tenants
- Location reads 65/100 on livability (#88 in AZ) — a middle-class / working-renter tenant base. Strengths: cost of living A+, housing A+; Watch: employment C-, health & safety C-, crime D+.
- Colorado River Union High School District (4381) (town): math 13% / reading 17% proficiency, ranked #213 of 249 in AZ (top 86%) — low school quality limits family demand, transient renter base, plan for 1-2y turnover.
- Market conditions: 376 active listings in the ZIP; 5 comparable units currently listed for rent nearby; rentals leasing fast (median 14d on market — plan ~1-2 weeks tenant-placement turnaround); 2,543 units permitted in Mohave County in 2024 (33 in 5+ unit buildings).
Forward outlook
- Local home prices are declining (-3.0%/yr); year-one equity from $1k of loan paydown is wiped out by about $5k of value loss. Plan a longer hold.
- Mohave County population projected to shrink 6% by 2050 — rents likely to lag national; underwrite the cash flow, not the appreciation.
Negotiation context
- It's been on market 249 days — a 12% lower offer ($153k) is reasonable based on typical stale-listing flexibility.
- 2 sale attempts; this cycle's ask has dropped $15k (8%) from the opening price — seller is motivated, your offer sets the floor, not the list.
- Current owner paid $70k; list at $174k implies a 149% gain — meaningful room to come down on a strong offer.
Risks & watch-outs
- Watch-outs: flood insurance adds $122/mo.
- Climate carrying-cost: in FEMA flood zone AO (mandatory federal flood insurance); moderate wildfire risk; extreme-heat days projected 6→14/yr by 2055 (HVAC capex compounding) — expect insurance premiums to compound above CPI over the hold.
Questions for the listing agent
- What do current leases actually rent for vs. the listed asking? Can we see a recent rent roll and the last 12 months of T-12 income?
- It's been on market 249 days. Have you received any prior offers? Is the seller open to a 14% concession, seller financing, or rate buy-down credit?
- What's the actual annual flood-insurance premium (NFIP or private), and is the property in a SFHA with mandatory coverage?
- What does the HOA fee cover, when was the last increase, and are there any pending special assessments or reserve-fund shortfalls?
- Why hasn't it sold? Are there any deal-killer items the seller is aware of (foundation, flood, title, zoning, code violations)?
- Is there a deadline driving the sale (1031 exchange, divorce, estate, relocation)? That informs how much negotiation room exists.
- Schools are F-rated, which usually means shorter tenancies and higher turnover. Who's the typical renter profile here, and what's been the actual vacancy rate?
- Crime grade is D in this area — have there been break-ins, vandalism, or insurance claims at this property in the last 3 years? What carrier currently insures it and at what premium?
- The area grade is low — what's the realistic commute time and amenity access for the typical tenant pool here? Any planned neighborhood developments (good or bad) we should know about?
- What's the average days-on-market for RENTAL listings here right now (not sales)? A rising rental-DOM trend means longer vacancies and softer asking-rent achievability than the comps imply.
- What's the recent tenant-quality profile in this submarket — average credit score on applications, eviction rate, late-payment / NSF rate, and stable-employment percentage? A property-management company in the area should have these aggregated.
- How much new for-sale + rental construction is in the pipeline within 1–3 miles? Heavy new supply typically softens prices + rents 12–24 months out; constrained supply supports both.
Investment metrics
- 1% rule
- 0.86% ✗
- Cap rate
- 6.07%
- Cash-on-cash
- -0.81%
- DSCR
- 0.96
- GRM
- 9.7
CMA / ARV
No comps found within radius.
Projected returns pro-forma
-3.0% appreciation · 3.0% rent growth · sell at horizon
- IRR
- -22.6%
- Equity multiple
- 0.22×
- Total profit
- $-37,979
- Equity at exit
- $25,944
- IRR
- -16.8%
- Equity multiple
- 0.07×
- Total profit
- $-45,388
- Equity at exit
- $15,044
Cash invested: $48,720 (down + closing). Projections, not guarantees.
Landlord ↔ Tenant lean methodology
- Overall (STATE)
- 87 Strongly Landlord-Friendly
- State Arizona
- 87 Strongly Landlord-Friendly · R+3
- County
- — inherits STATE
- City
- — inherits STATE
ZIP-level market 86426
- Home prices YoY
- -5.2%
- Active inventory
- 376
- Price-to-rent
- 9.7×
Monthly cashflow live
- Estimated rent
- $1,488 high interval (Pro) →
- Mortgage (P&I)
- −$912
- Tax est. 1.5%
- −$218 /mo · $2,610/yr
- Insurance
- −$72
- Flood insurance flood zone
- −$122 /mo · $1,468/yr
- HOA
- −$6
- Vacancy / Maint / Mgmt
- −$312
- Net cashflow
- $-155
Break-even live
UW: 25.0% down · 7.5% · 30yr · 1.5% tax · 5.0% vac · 8.0% maint · 8.0% mgmt
Financing live
Cash to close
- Down payment
- $43,500
- Closing costs
- $5,220
- Reserves months
- —
- Total cash needed
- —
Loan-product check · same deal, 3 products live
Conventional
25% down · 7.5% · 30yr
- Down + closing
- —
- Monthly P&I
- —
- Monthly cashflow
- —
- DSCR
- —
- Eligible?
- —
Personal DTI + credit; lowest rate.
DSCR
20% down · 8.5% · 30yr
- Down + closing
- —
- Monthly P&I
- —
- Monthly cashflow
- —
- DSCR
- —
- Eligible?
- —
No personal income docs; deal must DSCR.
Hard money
10% down · 12.0% · 12mo
- Down + closing
- —
- Monthly P&I
- —
- Monthly cashflow
- —
- DSCR
- —
- Eligible?
- —
Short-term bridge; refi at stabilization.
Rent comps 5 comps
| Address | Beds | Baths | Sqft | Rent | $/sqft | DOM | Units | Dist |
|---|---|---|---|---|---|---|---|---|
| 4567 Calle Valle Vis Unit 1 Bullhead City, AZ | 2.0 | 1.0 | 760 | $1,200 | $1.58 | 21d | 1 | 0.41mi |
| 1579 E Courtney Pl Fort Mohave, AZ | 2.0 | 2.0 | 948 | $999 | $1.05 | 13d | 1 | 0.90mi |
| 1765 Central Ave Bullhead City, AZ | 2.0 | 2.0 | 968 | $1,100 | $1.14 | 21d | 1 | 1.32mi |
| 5080 S La Calzada Dr Fort Mohave, AZ | 2.0 | 1.0 | 900 | $1,150 | $1.28 | 13d | 1 | 1.37mi |
| 1697 Richardo Ave Bullhead City, AZ | 3.0 | 2.0 | 1051 | $1,500 | $1.43 | 13d | 1 | 1.45mi |
HOA detail
- Monthly dues
- $6 · $72/yr
Listing history 21 events
-
2026-06-18days on market $174,000 Active 249 DOM
-
2026-06-17days on market $174,000 Active 248 DOM
-
2026-06-16days on market $174,000 Active 247 DOM
-
2026-06-15days on market $174,000 Active 246 DOM
-
2026-06-14days on market $174,000 Active 244 DOM
-
2026-06-13days on market $174,000 Active 243 DOM
-
2026-06-10days on market $174,000 Active 241 DOM
-
2026-06-09days on market $174,000 Active 240 DOM
-
2026-06-08days on market $174,000 Active 239 DOM
-
2026-06-07days on market $174,000 Active 238 DOM
-
2026-06-05days on market $174,000 Active 235 DOM
-
2026-06-03days on market $174,000 Active 234 DOM
-
2026-06-02days on market $174,000 Active 233 DOM
-
2026-06-01days on market $174,000 Active 232 DOM
-
2026-05-31days on market $174,000 Active 231 DOM
-
2026-05-30days on market $174,000 Active 230 DOM
-
2026-05-19price $174,000
-
2025-10-13$189,000 Active
-
2025-06-10soldstatus $70,000 89-char remark
Show marketing remark (89 chars)
Handyman special. 3 bedrooms, 2 bath, split floor plan, fully fenced lot with RV parking.
-
2025-06-10$70,000 89-char remark
Show marketing remark (89 chars)
Handyman special. 3 bedrooms, 2 bath, split floor plan, fully fenced lot with RV parking.
-
2025-06-06soldstatus $70,000
ⓘ Source: listings_history table (triggers on properties + properties_extension) + one-shot
backfill from property_details.listing_events for pre-trigger history.
Climate risk First Street
- Flood 1/10 Low FEMA zone AO · 0% chance over 30 yrs
- Wildfire 5/10 Major
- Heat 9/10 Extreme 6 d/yr ≥115°F today · 14 d/yr by 30 yrs out
- Wind 1/10 Low
- Air quality 1/10 Low 0 unhealthy d/yr today · 0 by 30 yrs out
Nearby sold comps map
Loading sold comps map…
Walkable amenities ~0.75 mi
Loading nearby amenities…
Taxation est. · year 1
- Rental income
- $17,857
- − Mortgage interest
- −$9,747
- − Property taxes
- −$2,610
- − Insurance
- −$2,338
- − Repairs & maintenance
- −$1,429
- − Management
- −$1,429
- − HOA
- −$72
- − Depreciation
- −$5,062
- Taxable loss
- −$4,828
- Est. tax savings @ 24.0%
- +$1,159
- After-tax cash flow
- $-704/yr
For passive investors: Depreciation is non-cash, so a rental often shows a tax loss while cash-flowing — sheltering income. Rental losses are passive: they offset passive income freely, and up to $25,000/yr can offset ordinary (W-2) income if you actively participate and your MAGI is under $100k (phasing out to $0 by $150k); unused losses carry forward. On sale, claimed depreciation is recaptured at up to 25%, and gains may owe capital-gains tax (a 1031 exchange can defer both). Figures are a year-1 estimate at your 24.0% rate — not tax advice; consult a CPA.
Schools (NCES district)
- District
- Colorado River Union High School District (4381)
- NCES district ID
- 0400082
- Math proficiency
- 13% ▼ -17.00%
- Reading proficiency
- 17% ▼ -18.00%
- Median HH income
- $39,132
- Composite
- 12.72/100
- National rank
- #9603
- State rank
- #213 of 249 in AZ
Livability — Fort Mohave
- Score
- 65/100
- State rank
- #88
- US rank
- #13539
Category grades
Schools grade is shown separately in the Schools card above.
Census & demographics
- Census place
- Fort Mohave, AZ
- County
- Mohave County · 181,906 people
- City population
- 15,467
- Metro
- Lake Havasu City-Kingman, AZ
- Population (ZIP)
- 15,467
- Household income
- $64,551
- Rent vs Own
- Severe rent burden
- 207.0
Population outlook (Mohave County) Hauer SSP2
- Today (2025)
- 209,184 people
- By 2030
- 209,674 · +0.2%
- By 2040
- 205,897 · -1.6%
- By 2050
- 196,810 · -5.9%
- By 2075
- 169,454 · -19.0%
- By 2100
- 136,630 · -34.7%
Race, ethnicity, and origin ACS 2023
- Neighborhood character
- Predominantly White (73%)
- Race & ethnicity
- White 73% Hispanic / Latino 18% Two or more races 8% Asian 4%
- Hispanic origin (detail)
- Mexican 14%
- Common ancestry
- Lithuanian 3% Romanian 2% Italian 1%
- Foreign-born
- 7% · Canada
- Languages at home
- 88% English-only · Spanish 7% Tagalog/Filipino 2% Other Asian/Pacific 1%
Political lean MEDSL · Mohave
- 2024 margin
- Solid R (+55.8) · D 21.8% · R 77.6%
- 2008→2024 swing
- -22.9pp toward R · 2008: -32.9pp · 2024: -55.8pp
- All cycles
- 2024: R+55.8 2020: R+51.3 2016: R+51.5 2012: R+42.6 2008: R+32.9
Not yet ingested
- Civics
- —
Market trends
- HPI YoY
- ▼ -15.22%
- Current HPI
- 278.7975
- Rent YoY
- —
- Metro
- Lake Havasu City-Kingman, AZ
- State GDP YoY
- ▲ 4.54%
- F500 in state
- 20
Industry mix (Fortune 500 HQ in AZ)
| Industry | F500 HQs | Revenue |
|---|---|---|
| Technology | 2 | $13B |
|
||
| Mining / Metals | 1 | $23B |
|
||
| Environmental Services | 1 | $16B |
|
||
| Metals / Steel | 1 | $14B |
|
||
| Technology Distribution | 1 | $9B |
|
||
| Homebuilding | 1 | $8B |
|
||
Price history
+148.6% since first listed5 events — show timeline
- 2026-05-19 Price Changed $174,000 WARDEX
- 2025-10-13 Listed $189,000 WARDEX
- 2025-06-10 Listed $70,000 WARDEX
- 2025-06-10 Sold (MLS) $70,000 WARDEX
- 2025-06-06 Sold (Public Records) $70,000 Public Records
Property tax history
+0.5%/yrLatest (2025): $345 · +8.5% YoY. Source: county tax records.
Cash-flow waterfall
monthlySold comps — $/sqft
last 12 mo · ≤1 miLoading sold comps…