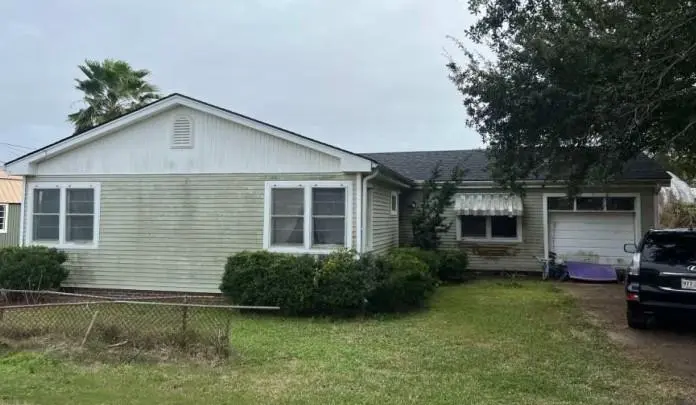
135 Pierce St · Golden Meadow, LA
Flood risk No data
- FEMA flood zone
- —
- Chance of flooding over 30 yrs
- —
- Est. flood insurance / yr
- —
Fire risk No data
- Est. fire insurance / yr
- —
Heat risk No data
- Hot days now (above threshold)
- —
- Hot days in 30 yrs
- —
Wind risk No data
- Chance of severe wind over 30 yrs
- —
Air-quality risk No data
- Unhealthy air days now
- —
- Unhealthy air days in 30 yrs
- —
Risk factors via First Street. Map © Google.
Why this score? — see what drove the A- grade
The composite is a weighted blend of 9 inputs, each scored 0–100. Each bar is that input's sub-score; the figure is the points it added to the 100-point composite (weight × sub-score).
- Cash flow +30.0/30.0
- ARV discount +15.0/15.0
- 1% rule +10.0/10.0
- DSCR +10.0/10.0
- Appreciation +5.2/10.0
- Livability +3.6/5.0
- Schools +3.4/10.0
- Rent growth +2.5/5.0
- Condition / age +2.5/5.0
$55,000
🖨 Deal sheet 📄 Offer letter ✓ Due diligence
Listing remarks MLS
Great Opportunity to own this single-family home built in 1960 featuring 3 bedrooms and 2 bathrooms. * * * SPECIAL NOTES: (1) This is a CASH ONLY transaction. (2) Seller to pay Taxes, HOA, and Municipal/Utility Liens. (3) Please read the Auction disclaimers carefully before placing a bid or submitting an offer. * * *
Key facts
- Parking
- Built 1960
- Listed 148 days
Neighborhood map
What this means for you Summary
Snapshot
- This is a 3-bed/2.0-bath single-family listed at $55k.
Deal economics
- At list price, monthly cash flow is $586 ($7k/yr) — positive.
- The deal already cash-flows at list — no discount required.
- Meets the 1% rule at list price ($1k rent vs $55k).
- Recommended offer: $48k (12.0% below list) — sets the bar for market timing.
Location & tenants
- Location reads 71/100 on livability (#46 in LA) — a middle-class / working-renter tenant base. Strengths: crime A+, cost of living A+, housing A+; Watch: amenities F, commute F, health & safety F.
- Lafourche Parish (other): math 31% / reading 49% proficiency, ranked #22 of 98 in LA (top 22%) — families likely to look elsewhere, expect single-tenant / working-renter base with shorter leases.
- Market conditions: 40 active listings in the ZIP; 319 units permitted in Lafourche Parish in 2024 (0 in 5+ unit buildings).
Forward outlook
- In year one you build about $640 of equity ($380 loan paydown + $260 appreciation (0.5% local appreciation)).
- At projected returns (0.5% appreciation + 3.0% rent growth), your $15k cash investment doubles in ~2 years — after that, you're playing with house money.
Negotiation context
- It's been on market 149 days — a 12% lower offer ($48k) is reasonable based on typical stale-listing flexibility.
- 4 sale attempts since 11y ago with the ask held roughly flat each time — persistent listings suggest the price (not the market) is what's stuck; bring a comps-based counter.
Questions for the listing agent
- It's been on market 149 days. Have you received any prior offers? Is the seller open to a 12% concession, seller financing, or rate buy-down credit?
- Built in 1960 — when were the roof, HVAC, electrical panel, plumbing, and water heater last replaced?
- Why hasn't it sold? Are there any deal-killer items the seller is aware of (foundation, flood, title, zoning, code violations)?
- Is there a deadline driving the sale (1031 exchange, divorce, estate, relocation)? That informs how much negotiation room exists.
- What's the average days-on-market for RENTAL listings here right now (not sales)? A rising rental-DOM trend means longer vacancies and softer asking-rent achievability than the comps imply.
- What's the recent tenant-quality profile in this submarket — average credit score on applications, eviction rate, late-payment / NSF rate, and stable-employment percentage? A property-management company in the area should have these aggregated.
- How much new for-sale + rental construction is in the pipeline within 1–3 miles? Heavy new supply typically softens prices + rents 12–24 months out; constrained supply supports both.
Investment metrics
- 1% rule
- 2.31% ✓
- Cap rate
- 19.08%
- Cash-on-cash
- 45.65%
- DSCR
- 3.03
- GRM
- 3.6
CMA / ARV
- ARV (median comp)
- $67,590
- List price
- $55,000
- Delta
- -18.63%
- Verdict
- UNDERPRICED
- Comps
- 12 within 1.0 mi
Show comp detail 3 sales within ~0.75 mi
| Address | Dist | Beds/Ba | Sqft | Sold | Price | $/sf | Match |
|---|---|---|---|---|---|---|---|
| 126 Callais Ln | 0.48mi | 3/2.5 | 2,483 (+4%) | 5mo | $200,000 | $81 | 63 |
| 174 West 214th St | 0.45mi | 3/2.0 | 2,088 (-12%) | 9mo | $195,000 | $93 | 51 |
| 105 W 209th St | 0.68mi | 3/2.0 | 2,046 (-14%) | 5mo | $80,000 | $39 | 41 |
Match score weights: distance 35% · size 25% · config 20% · recency 20%. Top-matched comps best support the ARV.
Projected returns pro-forma
0.47% appreciation · 3.0% rent growth · sell at horizon
- IRR
- 47.6%
- Equity multiple
- 3.40×
- Total profit
- $36,982
- Equity at exit
- $17,282
- IRR
- 49.8%
- Equity multiple
- 6.78×
- Total profit
- $89,059
- Equity at exit
- $21,852
Cash invested: $15,400 (down + closing). Projections, not guarantees.
Landlord ↔ Tenant lean methodology
- Overall (STATE)
- 90 Strongly Landlord-Friendly
- State Louisiana
- 90 Strongly Landlord-Friendly · R+12
- County
- — inherits STATE
- City
- — inherits STATE
ZIP-level market 70357
- Home prices YoY
- 0.9%
- Active inventory
- 40
- Price-to-rent
- 3.6×
Monthly cashflow live
- Estimated rent
- $1,269 medium interval (Pro) →
- Mortgage (P&I)
- −$288
- Tax from tax record
- −$105 /mo · $1,259/yr
- Insurance
- −$23
- HOA
- −$0
- Vacancy / Maint / Mgmt
- −$266
- Net cashflow
- $586
Break-even live
UW: 25.0% down · 7.5% · 30yr · 1.5% tax · 5.0% vac · 8.0% maint · 8.0% mgmt
Financing live
Cash to close
- Down payment
- $13,750
- Closing costs
- $1,650
- Reserves months
- —
- Total cash needed
- —
Loan-product check · same deal, 3 products live
Conventional
25% down · 7.5% · 30yr
- Down + closing
- —
- Monthly P&I
- —
- Monthly cashflow
- —
- DSCR
- —
- Eligible?
- —
Personal DTI + credit; lowest rate.
DSCR
20% down · 8.5% · 30yr
- Down + closing
- —
- Monthly P&I
- —
- Monthly cashflow
- —
- DSCR
- —
- Eligible?
- —
No personal income docs; deal must DSCR.
Hard money
10% down · 12.0% · 12mo
- Down + closing
- —
- Monthly P&I
- —
- Monthly cashflow
- —
- DSCR
- —
- Eligible?
- —
Short-term bridge; refi at stabilization.
Listing history 23 events
-
2026-06-19days on market $55,000 Active 149 DOM
-
2026-06-18days on market $55,000 Active 148 DOM
-
2026-06-17days on market $55,000 Active 147 DOM
-
2026-06-16days on market $55,000 Active 146 DOM
-
2026-06-15days on market $55,000 Active 145 DOM
-
2026-06-14days on market $55,000 Active 143 DOM
-
2026-06-13days on market $55,000 Active 142 DOM
-
2026-06-10days on market $55,000 Active 140 DOM
-
2026-06-09days on market $55,000 Active 139 DOM
-
2026-06-08days on market $55,000 Active 138 DOM
-
2026-06-07days on market $55,000 Active 137 DOM
-
2026-06-05days on market $55,000 Active 134 DOM
-
2026-06-03days on market $55,000 Active 133 DOM
-
2026-06-02days on market $55,000 Active 132 DOM
-
2026-06-01days on market $55,000 Active 131 DOM
-
2026-05-31days on market $55,000 Active 130 DOM
-
2026-05-30days on market $55,000 Active 129 DOM
-
2026-01-21$55,000 Active 322-char remark
Show marketing remark (313 chars)
Great Opportunity to own this single-family home built in 1960 featuring 3 bedrooms and 2 bathrooms. ***SPECIAL NOTES: (1) This is a CASH ONLY transaction. (2) Seller to pay Taxes, HOA, and Municipal/Utility Liens. (3) Please read the Auction disclaimers carefully before placing a bid or submitting an offer. ***
-
2026-01-21$55,000 Active 313-char remark
Show marketing remark (313 chars)
Great Opportunity to own this single-family home built in 1960 featuring 3 bedrooms and 2 bathrooms. ***SPECIAL NOTES: (1) This is a CASH ONLY transaction. (2) Seller to pay Taxes, HOA, and Municipal/Utility Liens. (3) Please read the Auction disclaimers carefully before placing a bid or submitting an offer. ***
-
2017-11-02soldstatus $93,500
-
2017-10-31soldstatus
-
2015-10-30$108,000
-
2015-10-30$108,000
ⓘ Source: listings_history table (triggers on properties + properties_extension) + one-shot
backfill from property_details.listing_events for pre-trigger history.
Tax reassessment forecast LA · Resets to sale price
- Current annual tax
- $1,259 · $105/mo
- Projected year-2 tax
- $1,259 · $105/mo
- Expected delta
- $0/yr ($0/mo · 0.0%)
ⓘ Screening estimate from a state-policy table — verify with the county assessor before closing.
Nearby sold comps map
Loading sold comps map…
Walkable amenities ~0.75 mi
Loading nearby amenities…
Taxation est. · year 1
- Rental income
- $15,223
- − Mortgage interest
- −$3,081
- − Property taxes
- −$1,259
- − Insurance
- −$275
- − Repairs & maintenance
- −$1,218
- − Management
- −$1,218
- − Depreciation
- −$1,600
- Taxable income
- $6,572
- Est. tax owed @ 24.0%
- −$1,577
- After-tax cash flow
- $5,453/yr
For passive investors: Depreciation is non-cash, so a rental often shows a tax loss while cash-flowing — sheltering income. Rental losses are passive: they offset passive income freely, and up to $25,000/yr can offset ordinary (W-2) income if you actively participate and your MAGI is under $100k (phasing out to $0 by $150k); unused losses carry forward. On sale, claimed depreciation is recaptured at up to 25%, and gains may owe capital-gains tax (a 1031 exchange can defer both). Figures are a year-1 estimate at your 24.0% rate — not tax advice; consult a CPA.
Schools (NCES district)
- District
- Lafourche Parish
- NCES district ID
- 2200900
- Math proficiency
- 31% ▼ -43.00%
- Reading proficiency
- 49% ▼ -32.00%
- Median HH income
- $49,703
- Composite
- 34.4/100
- National rank
- #5205
- State rank
- #22 of 98 in LA
Livability — Golden Meadow
- Score
- 71/100
- State rank
- #46
- US rank
- #6908
Category grades
Schools grade is shown separately in the Schools card above.
Census & demographics
- Census place
- Golden Meadow, LA
- Population (ZIP)
- 2,401
Population outlook (Lafourche County) Hauer SSP2
- Today (2025)
- 102,122 people
- By 2030
- 103,361 · +1.2%
- By 2040
- 104,401 · +2.2%
- By 2050
- 102,795 · +0.7%
- By 2075
- 95,599 · -6.4%
- By 2100
- 82,303 · -19.4%
Race, ethnicity, and origin ACS 2023
- Neighborhood character
- Predominantly White (81%)
- Race & ethnicity
- White 81% Hispanic / Latino 6% Two or more races 6% Native American 5%
- Hispanic origin (detail)
- Mexican 1%
- Common ancestry
- Lithuanian 12% Danish 1%
- Foreign-born
- 6% · Canada, China
- Languages at home
- 75% English-only · French/Haitian/Cajun 19% Spanish 5%
Political lean MEDSL · Lafourche
- 2024 margin
- Solid R (+62.1) · D 18.4% · R 80.4% · Other 1.2%
- 2008→2024 swing
- -16.1pp toward R · 2008: -46.0pp · 2024: -62.1pp
- All cycles
- 2024: R+62.1 2020: R+60.3 2016: R+56.5 2012: R+48.5 2008: R+46.0
Not yet ingested
- Civics
- —
Market trends
- HPI YoY
- ▲ 0.47%
- Current HPI
- 55.3337
- Rent YoY
- —
- Metro
- —
- State GDP YoY
- ▲ 3.29%
- F500 in state
- 10
Industry mix (Fortune 500 HQ in LA)
| Industry | F500 HQs | Revenue |
|---|---|---|
| Telecommunications | 2 | $23B |
|
||
| Utilities | 1 | $12B |
|
||
| Wholesale / Distribution | 1 | $5B |
|
||
| Advertising | 1 | $2B |
|
||
Price history
-49.1% since first listed6 events — show timeline
- 2026-01-21 Listed $55,000 AcadianaMLS
- 2026-01-21 Listed $55,000 GSREIN
- 2017-11-02 Sold (Public Records) $93,500 Public Records
- 2017-10-31 Sold (MLS) — GBRMLS
- 2015-10-30 Listed $108,000 GBRMLS
- 2015-10-30 Listed $108,000 AcadianaMLS
Property tax history
+4.6%/yrLatest (2024): $1,259 · +8.0% YoY. Source: county tax records.
Cash-flow waterfall
monthlySold comps — $/sqft
last 12 mo · ≤1 miLoading sold comps…