 Duplex
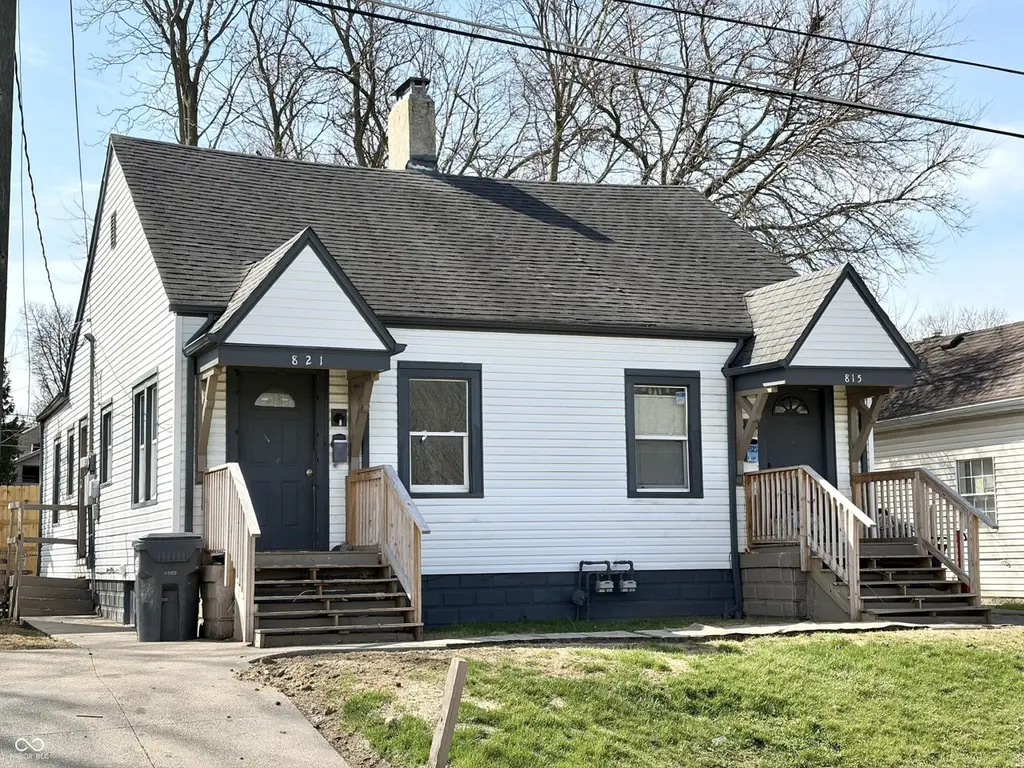
815 E 19th St · Anderson, IN
Flood risk 1/10 · Minimal
- FEMA flood zone
- X (unshaded)
- Chance of flooding over 30 yrs
- 0.0%
- Est. flood insurance / yr
- $473 – $860
Fire risk 1/10 · Minimal
- Est. fire insurance / yr
- $717 – $1,331
Heat risk 3/10 · Minor
- Hot days now (above 100°F)
- 7 days/yr
- Hot days in 30 yrs
- 18 days/yr
Wind risk 2/10 · Minimal
- Chance of severe wind over 30 yrs
- 0.0%
Air-quality risk 3/10 · Minor
- Unhealthy air days now
- 2 days/yr
- Unhealthy air days in 30 yrs
- 3 days/yr
Risk factors via First Street. Map © Google.
Why this score? — see what drove the C+ grade
The composite is a weighted blend of 9 inputs, each scored 0–100. Each bar is that input's sub-score; the figure is the points it added to the 100-point composite (weight × sub-score).
- Cash flow +28.4/30.0
- DSCR +10.0/10.0
- 1% rule +7.1/10.0
- ARV discount +6.6/15.0
- Rent growth +4.5/5.0
- Livability +3.0/5.0
- Condition / age +2.5/5.0
- Schools +1.6/10.0
- Appreciation +0.0/10.0
$119,000
🖨 Deal sheet 📄 Offer letter ✓ Due diligence
Multi-family units
County records classify this as Multi-Family (2-4 Unit). Listing-text estimate: 2 units. confirmed
Listing remarks MLS
Investor special or savvy home-owner! Check it out! This one bed one bath duplex is available to add to your portfolio, or move into one side and generate income and offset living expenses. The 821 side is vacant and the 815 is occupied.
Key facts
- 3,615 sq ft lot
- Built 1937
- Listed 81 days
Neighborhood map
What this means for you Summary
Snapshot
- This is a 2 × 1-bed/1-bath units multifamily listed at $119k.
Deal economics
- At list price, monthly cash flow is $384 ($5k/yr) — positive. Per door: $192/mo.
- The deal already cash-flows at list — no discount required.
- Meets the 1% rule at list price ($1k rent vs $119k).
- Recommended offer: $112k (6.0% below list) — sets the bar for market timing.
- Cap rate 10.2% vs local median 6.5% in Anderson — top-decile yield for the area; either an underpriced asset or a hidden risk that comps aren't pricing in. Stress-test before assuming the spread holds.
Location & tenants
- Location reads 60/100 on livability (#521 in IN) — a middle-class / working-renter tenant base. Strengths: cost of living A+, housing A+; Watch: schools F, crime D-, amenities F.
- Anderson Community School Corporation (urban): math 15% / reading 23% proficiency, ranked #280 of 301 in IN (top 93%) — low school quality limits family demand, transient renter base, plan for 1-2y turnover; 70% free/reduced lunch — lower-income household profile, screen leases tightly.
- Market conditions: Rents rising fast (+7.9%/yr); 185 active listings in the ZIP; 29 comparable units currently listed for rent nearby; rentals at typical pace (median 24d on market — plan ~3-4 weeks tenant-placement turnaround); lower-income renter base — watch delinquency; 184 units permitted in Madison County in 2024 (0 in 5+ unit buildings).
- At $1,441/mo this rent would consume 48% of the median local household income ($36k/yr) (locally 1193% of renters already pay >50% of income on rent) — very limited rent-growth headroom before tenants either downsize or default.
Forward outlook
- Local home prices are declining (-3.0%/yr); year-one equity from $823 of loan paydown is wiped out by about $4k of value loss. Plan a longer hold.
- Madison County population projected at -14% by 2050 — secular population decline; favor cash flow + early exit over multi-decade hold.
- At projected returns (-3.0% appreciation + 7.9% rent growth), your $33k cash investment doubles in ~7 years — after that, you're playing with house money.
Negotiation context
- It's been on market 81 days — a 6% lower offer ($112k) is reasonable based on typical stale-listing flexibility.
- 4 sale attempts since 17y ago; this cycle's ask has dropped $31k (21%) from the opening price — seller is motivated, your offer sets the floor, not the list.
- Current owner paid $95k; 25% above their basis — modest negotiation headroom, anchor on the comps not their cost.
Risks & watch-outs
- Watch-outs: built in 1937 — expect roof / HVAC / electrical / plumbing capex.
Questions for the listing agent
- It's been on market 81 days. Have you received any prior offers? Is the seller open to a 6% concession, seller financing, or rate buy-down credit?
- Can we see the unit-by-unit rent roll, current vacancy, and any below-market leases? What's the average tenancy length?
- What capital expenditures (roof, boiler, parking lot, exteriors) have been made in the last 5 years, and what's planned in the next 2?
- Built in 1937 — when were the roof, HVAC, electrical panel, plumbing, and water heater last replaced?
- Why hasn't it sold? Are there any deal-killer items the seller is aware of (foundation, flood, title, zoning, code violations)?
- Is there a deadline driving the sale (1031 exchange, divorce, estate, relocation)? That informs how much negotiation room exists.
- Schools are F-rated, which usually means shorter tenancies and higher turnover. Who's the typical renter profile here, and what's been the actual vacancy rate?
- Crime grade is D in this area — have there been break-ins, vandalism, or insurance claims at this property in the last 3 years? What carrier currently insures it and at what premium?
- What's the average days-on-market for RENTAL listings here right now (not sales)? A rising rental-DOM trend means longer vacancies and softer asking-rent achievability than the comps imply.
- What's the recent tenant-quality profile in this submarket — average credit score on applications, eviction rate, late-payment / NSF rate, and stable-employment percentage? A property-management company in the area should have these aggregated.
- How much new apartment / multifamily construction is in the pipeline within 1–3 miles? Heavy new supply (>2% of stock underway) typically softens rents 12–24 months out; light construction supports rent growth.
Investment metrics
- 1% rule
- 1.21% ✓
- Cap rate
- 10.17%
- Cash-on-cash
- 13.84%
- DSCR
- 1.62
- GRM
- 6.9
CMA / ARV
- ARV (median comp)
- $116,714
- List price
- $119,000
- Delta
- 1.96%
- Verdict
- FAIR
- Comps
- 19 within 1.0 mi
Projected returns pro-forma
-3.0% appreciation · 7.88% rent growth · sell at horizon
- IRR
- 9.1%
- Equity multiple
- 1.38×
- Total profit
- $12,602
- Equity at exit
- $17,743
- IRR
- 21.9%
- Equity multiple
- 3.28×
- Total profit
- $76,119
- Equity at exit
- $10,289
Cash invested: $33,320 (down + closing). Projections, not guarantees.
Landlord ↔ Tenant lean methodology
- Overall (STATE)
- 90 Strongly Landlord-Friendly
- State Indiana
- 90 Strongly Landlord-Friendly · R+11
- County
- — inherits STATE
- City
- — inherits STATE
ZIP-level market 46016
- Home prices YoY
- -3.5%
- Rents YoY
- 7.9%
- Active inventory
- 185
- Price-to-rent
- 13.8×
Monthly cashflow live
- Estimated rent
- $1,441 high interval (Pro) →
- Mortgage (P&I)
- −$624
- Tax from tax record
- −$80 /mo · $964/yr
- Insurance
- −$50
- HOA
- −$0
- Vacancy / Maint / Mgmt
- −$303
- Net cashflow
- $384
Break-even live
2-unit breakdown (identical units grouped — click to expand)
| Units | Beds | Baths | Est. rent |
|---|---|---|---|
| 2× units | 1 | 1 | $1,440 |
| #1 | 1 | 1 | $720 |
| #2 | 1 | 1 | $720 |
| Total (2 units) | $1,441 | ||
UW: 25.0% down · 7.5% · 30yr · 1.5% tax · 5.0% vac · 8.0% maint · 8.0% mgmt
Financing live
Cash to close
- Down payment
- $29,750
- Closing costs
- $3,570
- Reserves months
- —
- Total cash needed
- —
Loan-product check · same deal, 3 products live
Conventional
25% down · 7.5% · 30yr
- Down + closing
- —
- Monthly P&I
- —
- Monthly cashflow
- —
- DSCR
- —
- Eligible?
- —
Personal DTI + credit; lowest rate.
DSCR
20% down · 8.5% · 30yr
- Down + closing
- —
- Monthly P&I
- —
- Monthly cashflow
- —
- DSCR
- —
- Eligible?
- —
No personal income docs; deal must DSCR.
Hard money
10% down · 12.0% · 12mo
- Down + closing
- —
- Monthly P&I
- —
- Monthly cashflow
- —
- DSCR
- —
- Eligible?
- —
Short-term bridge; refi at stabilization.
Rent comps 29 comps
| Address | Beds | Baths | Sqft | Rent | $/sqft | DOM | Units | Dist |
|---|---|---|---|---|---|---|---|---|
| 2023 McKinley St Anderson, IN | 2.0 | 1.0 | 1500 | $950 | $0.63 | 44d | 1 | 0.08mi |
| 1726-1728 Walnut St Anderson, IN | 2.0 | 2.0 | 900 | $995 | $1.11 | 2d | 1 | 0.22mi |
| 2111 Central Ave Anderson, IN | 3.0 | 1.0 | 1026 | $1,250 | $1.22 | 44d | 1 | 0.45mi |
| 219 E 13th St Anderson, IN | 3.0 | 1.0 | 882 | $1,000 | $1.13 | 4d | 1 | 0.56mi |
| 1318 E 28th St Anderson, IN | 3.0 | 1.0 | 1280 | $1,300 | $1.02 | 12d | 1 | 0.68mi |
| 2625 Main St Anderson, IN | 2.0 | 1.0 | 988 | $895 | $0.91 | 24d | 1 | 0.71mi |
| 228 E 29th St Anderson, IN | 3.0 | 2.0 | 1440 | $1,295 | $0.90 | 4d | 1 | 0.75mi |
| 1023 E 8th St Unit 3 Anderson, IN | 2.0 | 1.5 | 1200 | $1,175 | $0.98 | 8d | 1 | 0.75mi |
| 3006 Noble St Anderson, IN | 2.0 | 1.0 | 1064 | $995 | $0.94 | 8d | 1 | 0.76mi |
| 229 W 19th St Anderson, IN | 3.0 | 1.0 | 1200 | $1,000 | $0.83 | 44d | 1 | 0.77mi |
| 3009 E Lynn St Unit 1 Anderson, IN | 3.0 | 1.0 | 1000 | $875 | $0.88 | 20d | 1 | 0.78mi |
| 1045 Alhambra Dr Unit 6 Anderson, IN | 2.0 | 1.5 | 900 | $975 | $1.08 | 24d | 1 | 0.91mi |
| 120 W 10th St Anderson, IN | 1.0–3.0 | 1.0 | 1066 | $1,150 | $1.08 | 2d | 1 | 0.93mi |
| 2627 Chase St Anderson, IN | 3.0 | 1.0 | 1050 | $850 | $0.81 | 18d | 1 | 0.95mi |
| 1829 E 8th St Anderson, IN | 1.0–3.0 | 1.0 | 810 | $1,250 | $1.54 | 24d | 9 | 0.95mi |
| 2233 Fairview St Anderson, IN | 3.0 | 1.5 | 1452 | $1,195 | $0.82 | 24d | 1 | 1.01mi |
| 3021 Delaware St Anderson, IN | 2.0 | 1.0 | 1154 | $1,150 | $1.00 | 8d | 1 | 1.02mi |
| 618 W 22nd St Anderson, IN | 3.0 | 1.0 | 900 | $1,250 | $1.39 | 44d | 1 | 1.02mi |
| 2301 Sheridan St Anderson, IN | 2.0 | 1.0 | 900 | $950 | $1.06 | 44d | 1 | 1.08mi |
| 706 University Blvd Anderson, IN | 2.0 | 1.0 | 1250 | $1,050 | $0.84 | 2d | 1 | 1.13mi |
| 530 Alhambra Dr Anderson, IN | 1.0–2.0 | 1.0 | 879 | $1,100 | $1.25 | 44d | 1 | 1.19mi |
| 2505 E 10th St Anderson, IN | 1.0–2.0 | 1.0 | 850 | $949 | $1.12 | 44d | 2 | 1.27mi |
| 1502 Cedar St Anderson, IN | 2.0 | 1.0 | 1104 | $850 | $0.77 | 44d | 1 | 1.29mi |
| 510 W 5th St Anderson, IN | 3.0 | 1.5 | 1617 | $995 | $0.62 | 44d | 1 | 1.34mi |
| 921 W 9th St Anderson, IN | 3.0 | 2.0 | 1611 | $1,375 | $0.85 | 24d | 1 | 1.35mi |
| 820 W 7th St Apt A Anderson, IN | 2.0 | 2.0 | 1400 | $1,200 | $0.86 | 24d | 1 | 1.37mi |
| 1222 Nichol Ave Unit 4 Anderson, IN | 3.0 | 1.0 | 1000 | $1,135 | $1.14 | 8d | 1 | 1.47mi |
| 506 W 2nd St Anderson, IN | 3.0 | 1.0 | 964 | $1,095 | $1.14 | 24d | 1 | 1.47mi |
| 1310 W 13th St Anderson, IN | 2.0 | 1.0 | 1178 | $895 | $0.76 | 2d | 1 | 1.49mi |
Listing history 23 events
-
2026-06-18days on market $119,000 Active 81 DOM
-
2026-06-17days on market $119,000 Active 80 DOM
-
2026-06-16days on market $119,000 Active 79 DOM
-
2026-06-15days on market $119,000 Active 78 DOM
-
2026-06-13pricedays on market $119,000 Active 76 DOM
-
2026-06-09days on market $132,500 Active 72 DOM
-
2026-06-08days on market $132,500 Active 71 DOM
-
2026-06-07days on market $132,500 Active 70 DOM
-
2026-06-05days on market $132,500 Active 67 DOM
-
2026-06-03days on market $132,500 Active 66 DOM
-
2026-06-02days on market $132,500 Active 65 DOM
-
2026-06-01days on market $132,500 Active 64 DOM
-
2026-05-31days on market $132,500 Active 63 DOM
-
2026-05-14price $135,000 237-char remark
Show marketing remark (237 chars)
Investor special or savvy home-owner! Check it out! This one bed one bath duplex is available to add to your portfolio, or move into one side and generate income and offset living expenses. The 821 side is vacant and the 815 is occupied.
-
2026-04-29price $140,000 237-char remark
Show marketing remark (237 chars)
Investor special or savvy home-owner! Check it out! This one bed one bath duplex is available to add to your portfolio, or move into one side and generate income and offset living expenses. The 821 side is vacant and the 815 is occupied.
-
2026-03-27$150,000 Active 237-char remark
Show marketing remark (237 chars)
Investor special or savvy home-owner! Check it out! This one bed one bath duplex is available to add to your portfolio, or move into one side and generate income and offset living expenses. The 821 side is vacant and the 815 is occupied.
-
2023-09-01soldstatus $95,000 Closed 254-char remark
Show marketing remark (254 chars)
Calling all investors!!! This newly renovated duplex is a perfect investment opportunity!! Both units are 1 bed 1 bath with their own basements. This is an incredible opportunity to add two, move in ready, doors to your portfolio. Vacant and ready to go!
-
2023-08-28status Pending 254-char remark
Show marketing remark (254 chars)
Calling all investors!!! This newly renovated duplex is a perfect investment opportunity!! Both units are 1 bed 1 bath with their own basements. This is an incredible opportunity to add two, move in ready, doors to your portfolio. Vacant and ready to go!
-
2023-08-13status Active 254-char remark
Show marketing remark (254 chars)
Calling all investors!!! This newly renovated duplex is a perfect investment opportunity!! Both units are 1 bed 1 bath with their own basements. This is an incredible opportunity to add two, move in ready, doors to your portfolio. Vacant and ready to go!
-
2023-08-01status Pending 254-char remark
Show marketing remark (254 chars)
Calling all investors!!! This newly renovated duplex is a perfect investment opportunity!! Both units are 1 bed 1 bath with their own basements. This is an incredible opportunity to add two, move in ready, doors to your portfolio. Vacant and ready to go!
-
2023-07-27$110,000 Active 254-char remark
Show marketing remark (254 chars)
Calling all investors!!! This newly renovated duplex is a perfect investment opportunity!! Both units are 1 bed 1 bath with their own basements. This is an incredible opportunity to add two, move in ready, doors to your portfolio. Vacant and ready to go!
-
2010-11-29historical
-
2009-11-28$45,000
ⓘ Source: listings_history table (triggers on properties + properties_extension) + one-shot
backfill from property_details.listing_events for pre-trigger history.
Tax reassessment forecast IN · Partial reset (capped growth)
- Current annual tax
- $964 · $80/mo
- Projected year-2 tax
- $988 · $82/mo
- Expected delta
- +$24/yr (+$2/mo · 2.4%)
ⓘ Screening estimate from a state-policy table — verify with the county assessor before closing.
Climate risk First Street
- Flood 1/10 Low FEMA zone X (unshaded) · 0% chance over 30 yrs
- Wildfire 1/10 Low
- Heat 3/10 Moderate 7 d/yr ≥100°F today · 18 d/yr by 30 yrs out
- Wind 2/10 Low 0% chance of damaging wind over 30 yrs
- Air quality 3/10 Moderate 2 unhealthy d/yr today · 3 by 30 yrs out
Nearby sold comps map
Loading sold comps map…
Walkable amenities ~0.75 mi
Loading nearby amenities…
Taxation est. · year 1
- Rental income
- $17,292
- − Mortgage interest
- −$6,666
- − Property taxes
- −$964
- − Insurance
- −$595
- − Repairs & maintenance
- −$1,383
- − Management
- −$1,383
- − Depreciation
- −$3,462
- Taxable income
- $2,838
- Est. tax owed @ 24.0%
- −$681
- After-tax cash flow
- $3,931/yr
For passive investors: Depreciation is non-cash, so a rental often shows a tax loss while cash-flowing — sheltering income. Rental losses are passive: they offset passive income freely, and up to $25,000/yr can offset ordinary (W-2) income if you actively participate and your MAGI is under $100k (phasing out to $0 by $150k); unused losses carry forward. On sale, claimed depreciation is recaptured at up to 25%, and gains may owe capital-gains tax (a 1031 exchange can defer both). Figures are a year-1 estimate at your 24.0% rate — not tax advice; consult a CPA.
Schools (NCES district)
- District
- Anderson Community School Corporation
- NCES district ID
- 1800150
- Math proficiency
- 15% ▼ -14.00%
- Reading proficiency
- 23% ▼ -7.00%
- Median HH income
- $38,208
- Composite
- 15.93/100
- National rank
- #9250
- State rank
- #280 of 301 in IN
Livability — Anderson
- Score
- 60/100
- State rank
- #521
- US rank
- #18709
Category grades
Schools grade is shown separately in the Schools card above.
Census & demographics
- Census place
- Anderson, IN
- County
- Madison County · 69,445 people
- City population
- 57,762
- Metro
- Indianapolis-Carmel-Anderson, IN
- Population (ZIP)
- 17,834
- Household income
- $36,029
- Rent vs Own
- Severe rent burden
- 1193.0
Population outlook (Madison County) Hauer SSP2
- Today (2025)
- 125,800 people
- By 2030
- 122,640 · -2.5%
- By 2040
- 115,420 · -8.3%
- By 2050
- 108,148 · -14.0%
- By 2075
- 91,838 · -27.0%
- By 2100
- 75,670 · -39.8%
Race, ethnicity, and origin ACS 2023
- Neighborhood character
- Diverse neighborhood (Simpson 0.58)
- Race & ethnicity
- White 61% Black 18% Hispanic / Latino 13% Two or more races 11% Native American 1%
- Hispanic origin (detail)
- Mexican 10% Puerto Rican 1%
- Common ancestry
- Italian 2% Slovak 1% Iranian 1%
- Foreign-born
- 4% · Canada
- Languages at home
- 86% English-only · Spanish 12%
Political lean MEDSL · Madison
- 2024 margin
- Strong R (+26.9) · D 35.6% · R 62.5% · Other 1.9%
- 2008→2024 swing
- -33.5pp toward R · 2008: 6.5pp · 2024: -26.9pp
- All cycles
- 2024: R+26.9 2020: R+22.6 2016: R+25.7 2012: R+4.5 2008: D+6.5
Not yet ingested
- Civics
- —
Market trends
- HPI YoY
- ▼ -11.12%
- Current HPI
- 302.7437
- Rent YoY
- ▲ 7.88%
- Metro
- Indianapolis-Carmel-Anderson, IN
- State GDP YoY
- ▲ 2.90%
- F500 in state
- 18
Industry mix (Fortune 500 HQ in IN)
| Industry | F500 HQs | Revenue |
|---|---|---|
| Industrial Machinery | 2 | $37B |
|
||
| Healthcare | 1 | $177B |
|
||
| Pharmaceuticals | 1 | $45B |
|
||
| Metals / Steel | 1 | $18B |
|
||
| Agriculture | 1 | $17B |
|
||
| Packaging | 1 | $12B |
|
||
Price history
+200.0% since first listed10 events — show timeline
- 2026-05-14 Price Changed $135,000 MIBOR as Distributed by MLS Grid
- 2026-04-29 Price Changed $140,000 MIBOR as Distributed by MLS Grid
- 2026-03-27 Listed $150,000 MIBOR as Distributed by MLS Grid
- 2023-09-01 Sold (MLS) $95,000 MIBOR as Distributed by MLS Grid
- 2023-08-28 Pending — MIBOR as Distributed by MLS Grid
- 2023-08-13 Relisted — MIBOR as Distributed by MLS Grid
- 2023-08-01 Pending — MIBOR as Distributed by MLS Grid
- 2023-07-27 Listed $110,000 MIBOR as Distributed by MLS Grid
- 2010-11-29 Listing Removed — MIBOR as Distributed by MLS Grid
- 2009-11-28 Listed $45,000 MIBOR as Distributed by MLS Grid
Property tax history
+4.0%/yrLatest (2024): $964 · +8.6% YoY. Source: county tax records.
Cash-flow waterfall
monthlySold comps — $/sqft
last 12 mo · ≤1 miLoading sold comps…