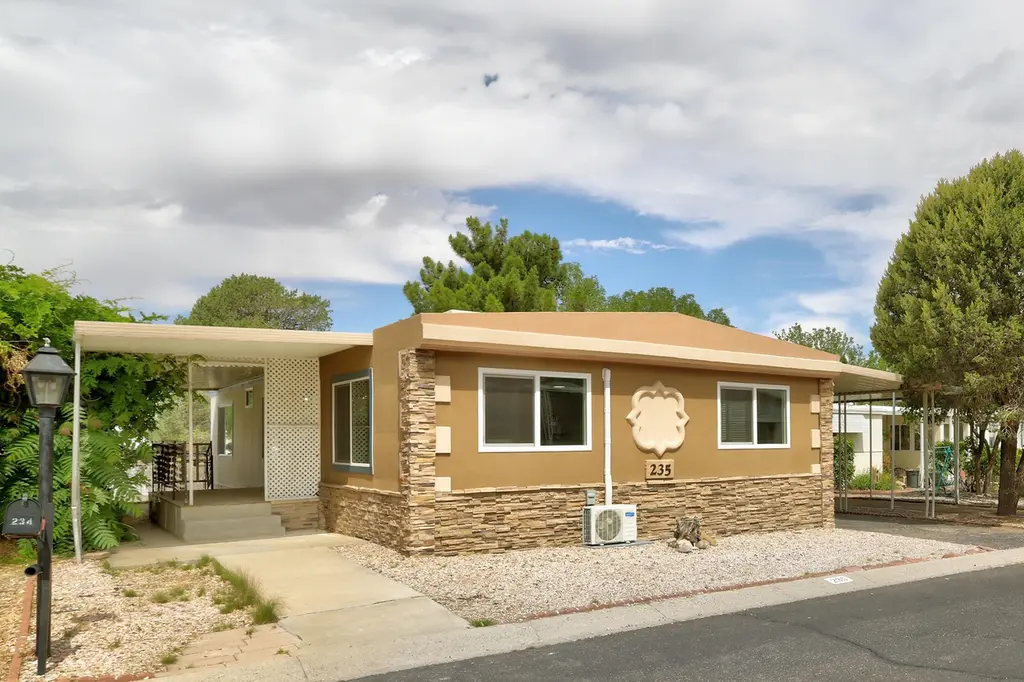
7112 Pan American NE #235 · Albuquerque, NM
Flood risk 4/10 · Minor
- FEMA flood zone
- X (unshaded)
- Chance of flooding over 30 yrs
- 0.22%
- Est. flood insurance / yr
- $507 – $1,088
Fire risk 1/10 · Minimal
- Est. fire insurance / yr
- $706 – $1,312
Heat risk 4/10 · Minor
- Hot days now (above 95°F)
- 3 days/yr
- Hot days in 30 yrs
- 7 days/yr
Wind risk 1/10 · Minimal
- Chance of severe wind over 30 yrs
- —
Air-quality risk 3/10 · Minor
- Unhealthy air days now
- 3 days/yr
- Unhealthy air days in 30 yrs
- 3 days/yr
Risk factors via First Street. Map © Google.
Why this score? — see what drove the B grade
The composite is a weighted blend of 9 inputs, each scored 0–100. Each bar is that input's sub-score; the figure is the points it added to the 100-point composite (weight × sub-score).
- Cash flow +30.0/30.0
- 1% rule +10.0/10.0
- DSCR +10.0/10.0
- ARV discount +7.5/15.0
- Schools +5.3/10.0
- Condition / age +4.0/5.0
- Livability +3.6/5.0
- Rent growth +2.3/5.0
- Appreciation +0.0/10.0
$99,000
🖨 Deal sheet 📄 Offer letter ✓ Due diligence
Listing remarks
Welcome to your hassle-free custom retreat in the premier Albuquerque Meadows 55+ gated community. Designed with comfort and easy living in mind, this fully updated 1,248 sq. ft. home features beautiful, low-maintenance luxury vinyl flooring and bright, modern sheetrock walls with fresh paint throughout. The heart of the home is a stunning kitchen complete with new two-tone cabinetry and elegant quartz countertops. Both bathrooms have been completely refreshed with new fixtures. Best of all, a brand-new mini-split heating and air conditioning system has been installed, ensuring perfect, whisper-quiet climate control year-round. Enjoy a vibrant, secure lifestyle with fantastic community amen
Key facts
- Gated community
- Refreshed bathrooms
- Stunning kitchen
Tags
Property features AI
Finance
- HOA & community: Senior community; Land lease community (land lease $1,100 monthly)
Exterior
- Parking: Carport with 2 spaces
- Security: Gated community
- Utilities: Cable available; Electricity connected; Natural gas connected; Public sewer; Public water
- Home design: Single-story manufactured home; Faces east; Pillar/post/pier foundation; Resale property
- Construction: Frame construction with synthetic stucco and wood siding; Rolled/hot mop roof; Manufactured home model wst; Approximately 52 feet long by 24 feet wide
- Exterior features: Covered patio; Patio; Skirting; Shed(s); Back yard fencing; Cul-de-sac lot; Xeriscape landscaping; Paved road access
Interior
- Kitchen: Dishwasher; Microwave; Range hood; Self-cleaning oven
- Bedrooms: Primary bedroom on the main level
- Flooring: Vinyl flooring; No carpet
- Bathrooms: Two three-quarter bathrooms
- Heating & cooling: Ductless heating; Ductless cooling
- Interior features: Ceiling fan(s); Main level primary bedroom; Double-pane, insulated, low-E vinyl windows
- Laundry & utility: Washer hookup; Electric dryer hookup; Gas dryer hookup
Neighborhood map
What this means for you Summary
Snapshot
- This is a 2-bed/2.0-bath manufactured listed at $99k. Condition is rated good.
Deal economics
- At list price, monthly cash flow is $788 ($9k/yr) — positive.
- The deal already cash-flows at list — no discount required.
- Meets the 1% rule at list price ($2k rent vs $99k).
- Cap rate 15.8% vs local median 3.7% in Albuquerque — top-decile yield for the area; either an underpriced asset or a hidden risk that comps aren't pricing in. Stress-test before assuming the spread holds.
Location & tenants
- Location reads 72/100 on livability (#13 in NM) — a middle-class / working-renter tenant base. Strengths: amenities A+, commute A+, cost of living A+; Watch: schools D-, crime F.
- Albuquerque Public Schools (urban): math 51% / reading 75% proficiency, ranked #3 of 29 in NM (top 10%) — acceptable for families but not a draw, mixed tenant base, ~2y average lease; 60% free/reduced lunch — lower-income household profile, screen leases tightly.
- Market conditions: Rents soft (-1.0%/yr); 148 active listings in the ZIP; 14 comparable units currently listed for rent nearby; rentals leasing fast (median 3d on market — plan ~1-2 weeks tenant-placement turnaround); 1,316 units permitted in Bernalillo County in 2024 (546 in 5+ unit buildings).
- This rent runs 38% of the median local income ($59k/yr) — at the standard rent-burdened threshold; future hikes will face affordability resistance.
Forward outlook
- Local home prices are declining (-3.0%/yr); year-one equity from $684 of loan paydown is wiped out by about $3k of value loss. Plan a longer hold.
- At projected returns (-3.0% appreciation + 0.0% rent growth), your $28k cash investment doubles in ~4 years — after that, you're playing with house money.
Negotiation context
- Only 9 days on market — expect competitive offers; lowballing is unlikely to land.
Questions for the listing agent
- Built in 1973 — when were the roof, HVAC, electrical panel, plumbing, and water heater last replaced?
- Is there a deadline driving the sale (1031 exchange, divorce, estate, relocation)? That informs how much negotiation room exists.
- Schools are D-rated, which usually means shorter tenancies and higher turnover. Who's the typical renter profile here, and what's been the actual vacancy rate?
- Crime grade is F in this area — have there been break-ins, vandalism, or insurance claims at this property in the last 3 years? What carrier currently insures it and at what premium?
- What's the average days-on-market for RENTAL listings here right now (not sales)? A rising rental-DOM trend means longer vacancies and softer asking-rent achievability than the comps imply.
- What's the recent tenant-quality profile in this submarket — average credit score on applications, eviction rate, late-payment / NSF rate, and stable-employment percentage? A property-management company in the area should have these aggregated.
- How much new for-sale + rental construction is in the pipeline within 1–3 miles? Heavy new supply typically softens prices + rents 12–24 months out; constrained supply supports both.
Investment metrics
- 1% rule
- 1.88% ✓
- Cap rate
- 15.85%
- Cash-on-cash
- 34.12%
- DSCR
- 2.52
- GRM
- 4.4
CMA / ARV
- ARV (on-the-fly)
- $222,144
- Comps found
- 4
Show comp detail 4 sales within ~0.75 mi
| Address | Dist | Beds/Ba | Sqft | Sold | Price | $/sf | Match |
|---|---|---|---|---|---|---|---|
| 7112 Pan American East NE Unit 345 | 0.00mi | 3/2.0 (+1) | 1,060 (-15%) | 2mo | $130,000 | $123 | 69 |
| 6516 Pino Ave NE | 0.56mi | 3/2.0 (+1) | 1,237 (-1%) | 4mo | $219,900 | $178 | 64 |
| 6835 Jade Park Ave NE | 0.67mi | 2/2.0 | 1,230 (-1%) | 21mo | $229,900 | $187 | 49 |
| 6831 Jade Park Ave NE | 0.65mi | 3/1.5 (+1) | 1,417 (+14%) | 6mo | $210,000 | $148 | 36 |
Match score weights: distance 35% · size 25% · config 20% · recency 20%. Top-matched comps best support the ARV.
Projected returns pro-forma
-3.0% appreciation · 0.0% rent growth · sell at horizon
- IRR
- 26.1%
- Equity multiple
- 2.04×
- Total profit
- $28,721
- Equity at exit
- $14,761
- IRR
- 31.8%
- Equity multiple
- 3.48×
- Total profit
- $68,653
- Equity at exit
- $8,560
Cash invested: $27,720 (down + closing). Projections, not guarantees.
Landlord ↔ Tenant lean methodology
- Overall (STATE)
- 55 Moderately Landlord-Leaning
- State New Mexico
- 55 Moderately Landlord-Leaning · D+3
- County
- — inherits STATE
- City
- — inherits STATE
ZIP-level market 87109
- Rents YoY
- -1.0%
- Active inventory
- 148
- Price-to-rent
- 4.4×
Monthly cashflow live
- Estimated rent
- $1,864 high interval (Pro) →
- Mortgage (P&I)
- −$519
- Tax est. 1.5%
- −$124 /mo · $1,485/yr
- Insurance
- −$41
- HOA
- −$0
- Vacancy / Maint / Mgmt
- −$391
- Net cashflow
- $788
Break-even live
UW: 25.0% down · 7.5% · 30yr · 1.5% tax · 5.0% vac · 8.0% maint · 8.0% mgmt
Financing live
Cash to close
- Down payment
- $24,750
- Closing costs
- $2,970
- Reserves months
- —
- Total cash needed
- —
Loan-product check · same deal, 3 products live
Conventional
25% down · 7.5% · 30yr
- Down + closing
- —
- Monthly P&I
- —
- Monthly cashflow
- —
- DSCR
- —
- Eligible?
- —
Personal DTI + credit; lowest rate.
DSCR
20% down · 8.5% · 30yr
- Down + closing
- —
- Monthly P&I
- —
- Monthly cashflow
- —
- DSCR
- —
- Eligible?
- —
No personal income docs; deal must DSCR.
Hard money
10% down · 12.0% · 12mo
- Down + closing
- —
- Monthly P&I
- —
- Monthly cashflow
- —
- DSCR
- —
- Eligible?
- —
Short-term bridge; refi at stabilization.
Rent comps 14 comps
| Address | Beds | Baths | Sqft | Rent | $/sqft | DOM | Units | Dist |
|---|---|---|---|---|---|---|---|---|
| 6401 Santa Monica Ave NE Albuquerque, NM | 1.0–2.0 | 1.0–2.0 | 1068 | $2,151 | $2.01 | 3d | 26 | 0.35mi |
| 6501 San Antonio Dr NE Albuquerque, NM | 2.0 | 2.0–2.5 | 1075 | $1,875 | $1.74 | 14d | 2 | 0.55mi |
| 7501 Jefferson St NE Albuquerque, NM | 2.0 | 1.0–2.0 | 887 | $2,291 | $2.58 | 3d | 38 | 0.73mi |
| 7000 Louisiana Blvd NE Albuquerque, NM | 1.0–2.0 | 1.0–2.0 | 840 | $1,709 | $2.03 | 3d | 25 | 0.79mi |
| 7100 Louisiana Blvd NE Albuquerque, NM | 1.0–2.0 | 1.0–2.0 | 763 | $1,790 | $2.35 | 3d | 15 | 0.80mi |
| 7800 Headline Blvd NE Albuquerque, NM | 2.0 | 1.0–2.0 | 961 | $2,343 | $2.44 | 3d | 16 | 0.81mi |
| 6441 Palomas Ave NE Albuquerque, NM | 1.0 | 1.0–1.5 | 758 | $2,088 | $2.75 | 3d | 2 | 0.92mi |
| 6401 Academy Rd NE Albuquerque, NM | 3.0 | 1.0–2.0 | 808 | $1,560 | $1.93 | 3d | 16 | 0.97mi |
| 5741 Osuna Rd NE Albuquerque, NM | 1.0–2.0 | 1.0–2.0 | 769 | $1,565 | $2.03 | 3d | 17 | 1.01mi |
| 6500 Martin Ct NE Albuquerque, NM | 3.0 | 2.0 | 1376 | $2,850 | $2.07 | 43d | 1 | 1.05mi |
| 5828 Elmwood Dr NE Albuquerque, NM | 2.0 | 2.0 | 1236 | $1,790 | $1.45 | 23d | 1 | 1.11mi |
| 5800 Osuna Rd NE Albuquerque, NM | 1.0–2.0 | 1.0–2.0 | 820 | $1,555 | $1.90 | 3d | 23 | 1.20mi |
| 4949 San Pedro Dr NE Albuquerque, NM | 1.0–2.0 | 1.0–2.0 | 900 | $1,495 | $1.66 | 3d | 9 | 1.35mi |
| 5324 San Mateo Blvd NE Albuquerque, NM | 1.0–2.0 | 1.0–2.0 | 748 | $1,691 | $2.26 | 3d | 27 | 1.41mi |
Listing history 7 events
-
2026-06-18days on market $99,000 Active 9 DOM
-
2026-06-17days on market $99,000 Active 8 DOM
-
2026-06-16days on market $99,000 Active 7 DOM
-
2026-06-15days on market $99,000 Active 6 DOM
-
2026-06-13days on market $99,000 Active 4 DOM
-
2026-06-10remarks 699-char remark
-
2026-06-10$99,000 Active 1 DOM
ⓘ Source: listings_history table (triggers on properties + properties_extension) + one-shot
backfill from property_details.listing_events for pre-trigger history.
Climate risk First Street
- Flood 4/10 Moderate FEMA zone X (unshaded) · 22% chance over 30 yrs
- Wildfire 1/10 Low
- Heat 4/10 Moderate 3 d/yr ≥95°F today · 7 d/yr by 30 yrs out
- Wind 1/10 Low
- Air quality 3/10 Moderate 3 unhealthy d/yr today · 3 by 30 yrs out
Nearby sold comps map
Loading sold comps map…
Walkable amenities ~0.75 mi
Loading nearby amenities…
Taxation est. · year 1
- Rental income
- $22,364
- − Mortgage interest
- −$5,546
- − Property taxes
- −$1,485
- − Insurance
- −$495
- − Repairs & maintenance
- −$1,789
- − Management
- −$1,789
- − Depreciation
- −$2,880
- Taxable income
- $8,380
- Est. tax owed @ 24.0%
- −$2,011
- After-tax cash flow
- $7,446/yr
For passive investors: Depreciation is non-cash, so a rental often shows a tax loss while cash-flowing — sheltering income. Rental losses are passive: they offset passive income freely, and up to $25,000/yr can offset ordinary (W-2) income if you actively participate and your MAGI is under $100k (phasing out to $0 by $150k); unused losses carry forward. On sale, claimed depreciation is recaptured at up to 25%, and gains may owe capital-gains tax (a 1031 exchange can defer both). Figures are a year-1 estimate at your 24.0% rate — not tax advice; consult a CPA.
Condition & rehab AI · 12 photos
This fully updated 1,248 sq. ft. home in Albuquerque Meadows 55+ community is move-in ready with new cabinetry, countertops, and HVAC system, and fresh paint throughout. Minor exterior landscaping and painting would further enhance its curb appeal and value.
Value-add opportunities
- Both Paint exterior — Enhances curb appeal and value.
- Both Landscaping — Improves curb appeal and rental value.
- Rental Replace air filters — Ensures optimal HVAC performance and comfort.
Renovation cost estimate screening
Value-add ROI direction
- Both Paint exterior — Enhances curb appeal and value. ↑
- Both Landscaping — Improves curb appeal and rental value. ↑
- Rental Replace air filters — Ensures optimal HVAC performance and comfort. ↑
ⓘ Cost ranges are severity-bucket heuristics (US national rule-of-thumb). Get contractor quotes + a written scope before underwriting a rehab budget.
Schools (NCES district)
- District
- Albuquerque Public Schools
- NCES district ID
- 3500060
- Math proficiency
- 51% ▲ 30.00%
- Reading proficiency
- 75% ▲ 45.00%
- Median HH income
- $48,151
- Composite
- 53.29/100
- National rank
- #1487
- State rank
- #3 of 29 in NM
Livability — Albuquerque
- Score
- 72/100
- State rank
- #13
- US rank
- #6219
Category grades
Schools grade is shown separately in the Schools card above.
Census & demographics
- Census place
- Albuquerque, NM
- County
- Bernalillo County · 647,165 people
- City population
- 647,165
- Metro
- Albuquerque, NM
- Population (ZIP)
- 39,324
- Household income
- $58,900
- Rent vs Own
- Severe rent burden
- 2187.0
Population outlook (Bernalillo County) Hauer SSP2
- Today (2025)
- 704,528 people
- By 2030
- 711,723 · +1.0%
- By 2040
- 714,522 · +1.4%
- By 2050
- 709,274 · +0.7%
- By 2075
- 680,015 · -3.5%
- By 2100
- 619,879 · -12.0%
Race, ethnicity, and origin ACS 2023
- Neighborhood character
- Diverse neighborhood (Simpson 0.64)
- Race & ethnicity
- White 47% Hispanic / Latino 36% Two or more races 17% Native American 9% Black 3% Asian 3%
- Hispanic origin (detail)
- Mexican 19%
- Common ancestry
- Lithuanian 2% Slovak 2% Portuguese 2%
- Foreign-born
- 7% · Canada, China
- Languages at home
- 84% English-only · Spanish 11% Other Indo-European 1%
Political lean MEDSL · Bernalillo
- 2024 margin
- Strong D (+21.0) · D 59.2% · R 38.2% · Other 2.6%
- 2008→2024 swing
- -0.3pp no change · 2008: 21.4pp · 2024: 21.0pp
- All cycles
- 2024: D+21.0 2020: D+24.4 2016: D+17.8 2012: D+16.2 2008: D+21.4
Not yet ingested
- Civics
- —
Market trends
- HPI YoY
- ▼ -303.11%
- Current HPI
- 250.5034
- Rent YoY
- ▼ -0.97%
- Metro
- Albuquerque, NM
- State GDP YoY
- —
- F500 in state
- 0
Price history
1 event — show timeline
- 2026-06-07 Listed $99,000 Southwest MLS
Cash-flow waterfall
monthlySold comps — $/sqft
last 12 mo · ≤1 miLoading sold comps…