 Multi-family
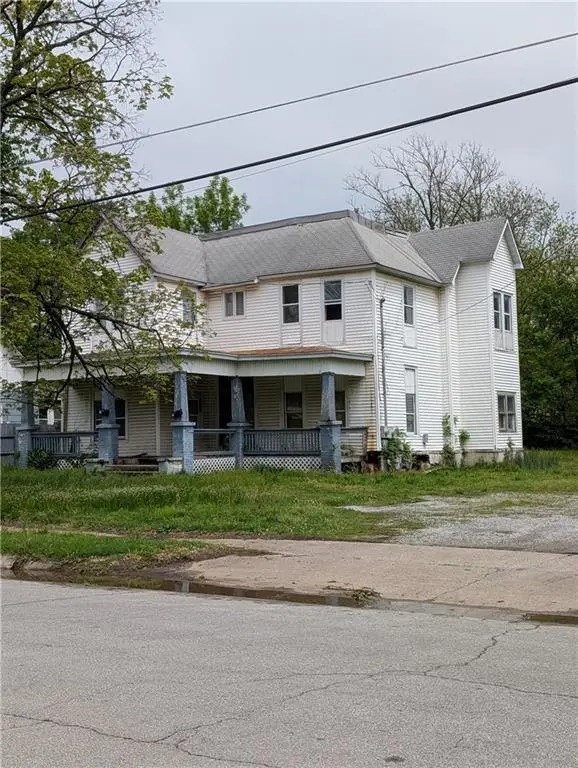
528 N Washington St · Nevada, MO
Flood risk 1/10 · Minimal
- FEMA flood zone
- X (unshaded)
- Chance of flooding over 30 yrs
- 0.0%
- Est. flood insurance / yr
- $507 – $1,088
Fire risk 3/10 · Minor
- Est. fire insurance / yr
- $1,054 – $1,958
Heat risk 5/10 · Moderate
- Hot days now (above 108°F)
- 7 days/yr
- Hot days in 30 yrs
- 19 days/yr
Wind risk 2/10 · Minimal
- Chance of severe wind over 30 yrs
- 1.0%
Air-quality risk 2/10 · Minimal
- Unhealthy air days now
- 0 days/yr
- Unhealthy air days in 30 yrs
- 1 days/yr
Risk factors via First Street. Map © Google.
Why this score? — see what drove the D grade
The composite is a weighted blend of 9 inputs, each scored 0–100. Each bar is that input's sub-score; the figure is the points it added to the 100-point composite (weight × sub-score).
- Cash flow +15.0/30.0
- ARV discount +7.5/15.0
- 1% rule +5.0/10.0
- DSCR +5.0/10.0
- Schools +3.2/10.0
- Livability +3.0/5.0
- Rent growth +2.5/5.0
- Condition / age +2.5/5.0
- Appreciation +0.0/10.0
$15,000
🖨 Deal sheet (PDF) 📄 Offer letter ✓ Due diligence
Multi-family units
County records classify this as Multi-Family (2-4 Unit). Listing-text estimate: 1 unit. estimate disagrees with records
Listing remarks MLS
Located in the heart of historical area of Nevada MO & the hot spot for trick or treaters that walk down that street for treats. Bring your tool box or a magic wand. This property is being sold "AS IS". This property was a rental that was converted into a duplex two family home with one bedroom upstairs on each side. This property allows you multiple options from the zoning & price. This price would allow you the opportunity to fix it up or tear it down & build a new home. The lot is worth the price. This home was once used for a hospital & a nursing home. Here's your chance to show off your talents & give this spot a new life! Get started today! The previous owner started working on the property so the flooring is out & the house needs lots of work so be careful inside.
Key facts
- 0.27 acre lot
- Built 1880
- Listed 270 days
Neighborhood map
What this means for you Summary
Snapshot
- This is a 2-bed/4.0-bath multifamily listed at $15k.
Deal economics
- At list price, monthly cash flow is $747 ($9k/yr) — positive.
- The deal already cash-flows at list — no discount required.
- Meets the 1% rule at list price ($1k rent vs $15k).
- Recommended offer: $13k (12.0% below list) — sets the bar for market timing.
- Cap rate 66.1% vs local median 5.0% in Nevada — top-decile yield for the area; either an underpriced asset or a hidden risk that comps aren't pricing in. Stress-test before assuming the spread holds.
Location & tenants
- Location reads 59/100 on livability (#519 in MO) — a working-class tenant base; expect higher turnover. Strengths: cost of living A+, housing A; Watch: crime F, amenities F, commute F.
- Nevada R-V (town): math 33% / reading 44% proficiency, ranked #180 of 324 in MO (top 56%) — families likely to look elsewhere, expect single-tenant / working-renter base with shorter leases.
- Zoned schools: Truman Elem. (math 25% / reading 41%, grade F, #744 of 1,115 statewide, top 67%, 500 students, 58% FRL); Nevada Middle (math 38% / reading 43%, grade F, #180 of 391 statewide, top 47%, 529 students, 54% FRL); Nevada High (math 38% / reading 52%, grade D-, #176 of 521 statewide, top 34%, 786 students, 48% FRL).
- Market conditions: 105 active listings in the ZIP; 57 units permitted in Vernon County in 2024 (38 in 5+ unit buildings).
Forward outlook
- Local home prices are declining (-3.0%/yr); year-one equity from $104 of loan paydown is wiped out by about $450 of value loss. Plan a longer hold.
- Vernon County population projected at -13% by 2050 — secular population decline; favor cash flow + early exit over multi-decade hold.
- At projected returns (-3.0% appreciation + 3.0% rent growth), your $4k cash investment doubles in ~1 year — after that, you're playing with house money.
Negotiation context
- It's been on market 270 days — a 12% lower offer ($13k) is reasonable based on typical stale-listing flexibility.
- 6 sale attempts since 20y ago with the ask held roughly flat each time — persistent listings suggest the price (not the market) is what's stuck; bring a comps-based counter.
Risks & watch-outs
- Watch-outs: built in 1880 — expect roof / HVAC / electrical / plumbing capex.
- Climate carrying-cost: extreme-heat days projected 7→19/yr by 2055 (HVAC capex compounding) — expect insurance premiums to compound above CPI over the hold.
Questions for the listing agent
- It's been on market 270 days. Have you received any prior offers? Is the seller open to a 12% concession, seller financing, or rate buy-down credit?
- Built in 1880 — when were the roof, HVAC, electrical panel, plumbing, and water heater last replaced?
- Why hasn't it sold? Are there any deal-killer items the seller is aware of (foundation, flood, title, zoning, code violations)?
- Is there a deadline driving the sale (1031 exchange, divorce, estate, relocation)? That informs how much negotiation room exists.
- Crime grade is F in this area — have there been break-ins, vandalism, or insurance claims at this property in the last 3 years? What carrier currently insures it and at what premium?
- The area grade is low — what's the realistic commute time and amenity access for the typical tenant pool here? Any planned neighborhood developments (good or bad) we should know about?
- What's the average days-on-market for RENTAL listings here right now (not sales)? A rising rental-DOM trend means longer vacancies and softer asking-rent achievability than the comps imply.
- What's the recent tenant-quality profile in this submarket — average credit score on applications, eviction rate, late-payment / NSF rate, and stable-employment percentage? A property-management company in the area should have these aggregated.
- How much new apartment / multifamily construction is in the pipeline within 1–3 miles? Heavy new supply (>2% of stock underway) typically softens rents 12–24 months out; light construction supports rent growth.
Investment metrics
- 1% rule
- 7.23% ✓
- Cap rate
- 66.06%
- Cash-on-cash
- 213.45%
- DSCR
- 10.50
- GRM
- 1.2
CMA / ARV
- ARV (median comp)
- $111,121
- List price
- $15,000
- Delta
- -86.50%
- Verdict
- UNDERPRICED
- Comps
- 20 within 1.0 mi
Projected returns pro-forma
-3.0% appreciation · 3.0% rent growth · sell at horizon
- IRR
- —
- Equity multiple
- 11.76×
- Total profit
- $45,171
- Equity at exit
- $2,237
- IRR
- —
- Equity multiple
- 24.97×
- Total profit
- $100,685
- Equity at exit
- $1,297
Cash invested: $4,200 (down + closing). Projections, not guarantees.
Landlord ↔ Tenant lean methodology
- Overall (STATE)
- 81 Strongly Landlord-Friendly
- State Missouri
- 81 Strongly Landlord-Friendly · R+10
- County
- — inherits STATE
- City
- — inherits STATE
ZIP-level market 64772
- Active inventory
- 105
- Price-to-rent
- 1.2×
Monthly cashflow live
- Estimated rent
- $1,084 medium interval (Pro) →
- Mortgage (P&I)
- −$79
- Tax from tax record
- −$25 /mo · $295/yr
- Insurance
- −$6
- HOA
- −$0
- Vacancy / Maint / Mgmt
- −$228
- Net cashflow
- $747
Break-even live
Sensitivity live
| Price | -10% $756 | -5% $751 | +0% $747 | +5% $743 | +10% $739 |
|---|---|---|---|---|---|
| Rent | -10% $661 | -5% $704 | +0% $747 | +5% $790 | +10% $833 |
| Rate | -1.0pp $755 | -0.5pp $751 | base $747 | +0.5pp $743 | +1.0pp $739 |
UW: 25.0% down · 7.5% · 30yr · 1.5% tax · 5.0% vac · 8.0% maint · 8.0% mgmt
Financing live
Cash to close
- Down payment
- $3,750
- Closing costs
- $450
- Reserves months
- —
- Total cash needed
- —
Loan-product check · same deal, 3 products live
Conventional
25% down · 7.5% · 30yr
- Down + closing
- —
- Monthly P&I
- —
- Monthly cashflow
- —
- DSCR
- —
- Eligible?
- —
Personal DTI + credit; lowest rate.
DSCR
20% down · 8.5% · 30yr
- Down + closing
- —
- Monthly P&I
- —
- Monthly cashflow
- —
- DSCR
- —
- Eligible?
- —
No personal income docs; deal must DSCR.
Hard money
10% down · 12.0% · 12mo
- Down + closing
- —
- Monthly P&I
- —
- Monthly cashflow
- —
- DSCR
- —
- Eligible?
- —
Short-term bridge; refi at stabilization.
Listing history 31 events
-
2026-06-21days on market $15,000 Active 270 DOM
-
2026-06-21days on market $15,000 Active 269 DOM
-
2026-06-18days on market $15,000 Active 267 DOM
-
2026-06-17days on market $15,000 Active 266 DOM
-
2026-06-16days on market $15,000 Active 265 DOM
-
2026-06-15days on market $15,000 Active 264 DOM
-
2026-06-13days on market $15,000 Active 262 DOM
-
2026-06-12days on market $15,000 Active 261 DOM
-
2026-06-09days on market $15,000 Active 258 DOM
-
2026-06-08days on market $15,000 Active 257 DOM
-
2026-06-07days on market $15,000 Active 256 DOM
-
2026-06-07days on market $15,000 Active 255 DOM
-
2026-06-04days on market $15,000 Active 252 DOM
-
2026-06-02days on market $15,000 Active 251 DOM
-
2026-06-01days on market $15,000 Active 250 DOM
-
2026-05-31days on market $15,000 Active 249 DOM
-
2025-09-24$15,000 Active 827-char remark
Show marketing remark (827 chars)
Located in the heart of historical area of Nevada MO & the hot spot for trick or treaters that walk down that street for treats. Bring your tool box or a magic wand. This property is being sold "AS IS". This property was a rental that was converted into a duplex two family home with one bedroom upstairs on each side. This property allows you multiple options from the zoning & price. This price would allow you the opportunity to fix it up or tear it down & build a new home. The lot is worth the price. This home was once used for a hospital & a nursing home. Here's your chance to show off your talents & give this spot a new life! Get started today! The previous owner started working on the property so the flooring is out & the house needs lots of work so be careful inside.
-
2025-07-11soldstatus Closed 638-char remark
Show marketing remark (638 chars)
Bring your tool box or a magic wand. Fixer upper that needs your magic touch. This property is being sold "as is". This property was a rental that was converted into a duplex two family home with one upstairs bedroom on each side. This property allows you multiple options from the zoning & price. This price would allow you the opportunity to fix it up or tear it down & build a new home. The lot is worth this price. This historical homes area is the hot spot for Trick Or Treaters to walk down that street for treats. Here's your chance to show off your talents & give this spot new life! Get started today!
-
2025-07-05status Pending 638-char remark
Show marketing remark (638 chars)
Bring your tool box or a magic wand. Fixer upper that needs your magic touch. This property is being sold "as is". This property was a rental that was converted into a duplex two family home with one upstairs bedroom on each side. This property allows you multiple options from the zoning & price. This price would allow you the opportunity to fix it up or tear it down & build a new home. The lot is worth this price. This historical homes area is the hot spot for Trick Or Treaters to walk down that street for treats. Here's your chance to show off your talents & give this spot new life! Get started today!
-
2025-06-11price $10,900 638-char remark
Show marketing remark (638 chars)
Bring your tool box or a magic wand. Fixer upper that needs your magic touch. This property is being sold "as is". This property was a rental that was converted into a duplex two family home with one upstairs bedroom on each side. This property allows you multiple options from the zoning & price. This price would allow you the opportunity to fix it up or tear it down & build a new home. The lot is worth this price. This historical homes area is the hot spot for Trick Or Treaters to walk down that street for treats. Here's your chance to show off your talents & give this spot new life! Get started today!
-
2025-05-28price $12,500 638-char remark
Show marketing remark (638 chars)
Bring your tool box or a magic wand. Fixer upper that needs your magic touch. This property is being sold "as is". This property was a rental that was converted into a duplex two family home with one upstairs bedroom on each side. This property allows you multiple options from the zoning & price. This price would allow you the opportunity to fix it up or tear it down & build a new home. The lot is worth this price. This historical homes area is the hot spot for Trick Or Treaters to walk down that street for treats. Here's your chance to show off your talents & give this spot new life! Get started today!
-
2025-05-02$15,000 Active 638-char remark
Show marketing remark (638 chars)
Bring your tool box or a magic wand. Fixer upper that needs your magic touch. This property is being sold "as is". This property was a rental that was converted into a duplex two family home with one upstairs bedroom on each side. This property allows you multiple options from the zoning & price. This price would allow you the opportunity to fix it up or tear it down & build a new home. The lot is worth this price. This historical homes area is the hot spot for Trick Or Treaters to walk down that street for treats. Here's your chance to show off your talents & give this spot new life! Get started today!
-
2024-12-06price $21,500
-
2024-10-04price $25,000
-
2024-08-26price $29,900
-
2014-07-15soldstatus
-
2014-05-19$10,000
-
2010-09-14$19,900
-
2008-11-07soldstatus
-
2008-10-21$19,900
-
2006-08-22$27,500
ⓘ Source: listings_history table (triggers on properties + properties_extension) + one-shot
backfill from property_details.listing_events for pre-trigger history.
Tax reassessment forecast MO · Resets to sale price
- Current annual tax
- $295 · $25/mo
- Projected year-2 tax
- $295 · $25/mo
- Expected delta
- $0/yr ($0/mo · 0.0%)
ⓘ Screening estimate from a state-policy table — verify with the county assessor before closing.
Climate risk First Street
- Flood 1/10 Low FEMA zone X (unshaded) · 0% chance over 30 yrs
- Wildfire 3/10 Moderate
- Heat 5/10 Major 7 d/yr ≥108°F today · 19 d/yr by 30 yrs out
- Wind 2/10 Low 100% chance of damaging wind over 30 yrs
- Air quality 2/10 Low 0 unhealthy d/yr today · 1 by 30 yrs out
Nearby sold comps map
Loading sold comps map…
Walkable amenities ~0.75 mi
Loading nearby amenities…
Taxation est. · year 1
- Rental income
- $13,012
- − Mortgage interest
- −$840
- − Property taxes
- −$295
- − Insurance
- −$75
- − Repairs & maintenance
- −$1,041
- − Management
- −$1,041
- − Depreciation
- −$436
- Taxable income
- $9,283
- Est. tax owed @ 24.0%
- −$2,228
- After-tax cash flow
- $6,737/yr
For passive investors: Depreciation is non-cash, so a rental often shows a tax loss while cash-flowing — sheltering income. Rental losses are passive: they offset passive income freely, and up to $25,000/yr can offset ordinary (W-2) income if you actively participate and your MAGI is under $100k (phasing out to $0 by $150k); unused losses carry forward. On sale, claimed depreciation is recaptured at up to 25%, and gains may owe capital-gains tax (a 1031 exchange can defer both). Figures are a year-1 estimate at your 24.0% rate — not tax advice; consult a CPA.
Schools (NCES district)
- District
- Nevada R-V
- NCES district ID
- 2921840
- Math proficiency
- 33% ▼ -1.00%
- Reading proficiency
- 44% ▼ -1.00%
- Median HH income
- $38,804
- Composite
- 32.14/100
- National rank
- #5792
- State rank
- #180 of 324 in MO
Livability — Nevada
- Score
- 59/100
- State rank
- #519
- US rank
- #19644
Category grades
Schools grade is shown separately in the Schools card above.
Census & demographics
- Census place
- Nevada, MO
- Population (ZIP)
- 12,930
Population outlook (Vernon County) Hauer SSP2
- Today (2025)
- 20,169 people
- By 2030
- 19,639 · -2.6%
- By 2040
- 18,551 · -8.0%
- By 2050
- 17,549 · -13.0%
- By 2075
- 15,314 · -24.1%
- By 2100
- 13,132 · -34.9%
Race, ethnicity, and origin ACS 2023
- Neighborhood character
- Predominantly White (92%)
- Race & ethnicity
- White 92% Two or more races 4% Hispanic / Latino 3% Black 1% Asian 1%
- Common ancestry
- Italian 3% Portuguese 2% Romanian 2%
- Foreign-born
- 1%
- Languages at home
- 98% English-only · German/W. Germanic 1%
Political lean MEDSL · Vernon
- 2024 margin
- Solid R (+59.5) · D 19.8% · R 79.3%
- 2008→2024 swing
- -37.5pp toward R · 2008: -22.0pp · 2024: -59.5pp
- All cycles
- 2024: R+59.5 2020: R+57.2 2016: R+56.2 2012: R+37.3 2008: R+22.0
Not yet ingested
- Civics
- —
Market trends
- HPI YoY
- ▼ -84.21%
- Current HPI
- 150.7283
- Rent YoY
- —
- Metro
- —
- State GDP YoY
- ▲ 1.84%
- F500 in state
- 20
Industry mix (Fortune 500 HQ in MO)
| Industry | F500 HQs | Revenue |
|---|---|---|
| Healthcare | 1 | $163B |
|
||
| Insurance | 1 | $21B |
|
||
| Industrial Technology | 1 | $17B |
|
||
| Retail | 1 | $16B |
|
||
| Industrial Distribution | 1 | $10B |
|
||
| Utilities | 1 | $9B |
|
||
Price history
-45.5% since first listed15 events — show timeline
- 2025-09-24 Listed $15,000 Heartland MLS as Distributed by MLS Grid
- 2025-07-11 Sold (MLS) — Heartland MLS as Distributed by MLS Grid
- 2025-07-05 Pending — Heartland MLS as Distributed by MLS Grid
- 2025-06-11 Price Changed $10,900 Heartland MLS as Distributed by MLS Grid
- 2025-05-28 Price Changed $12,500 Heartland MLS as Distributed by MLS Grid
- 2025-05-02 Listed $15,000 Heartland MLS as Distributed by MLS Grid
- 2024-12-06 Price Changed $21,500 OGAR
- 2024-10-04 Price Changed $25,000 OGAR
- 2024-08-26 Price Changed $29,900 OGAR
- 2014-07-15 Sold (MLS) — Heartland MLS as Distributed by MLS Grid
- 2014-05-19 Listed $10,000 Heartland MLS as Distributed by MLS Grid
- 2010-09-14 Listed $19,900 Heartland MLS as Distributed by MLS Grid
- 2008-11-07 Sold (MLS) — Heartland MLS as Distributed by MLS Grid
- 2008-10-21 Listed $19,900 Heartland MLS as Distributed by MLS Grid
- 2006-08-22 Listed $27,500 Heartland MLS as Distributed by MLS Grid
Property tax history
-0.3%/yrLatest (2025): $295 · +13.5% YoY. Source: county tax records.
Cash-flow waterfall
monthlySold comps — $/sqft
last 12 mo · ≤1 miLoading sold comps…