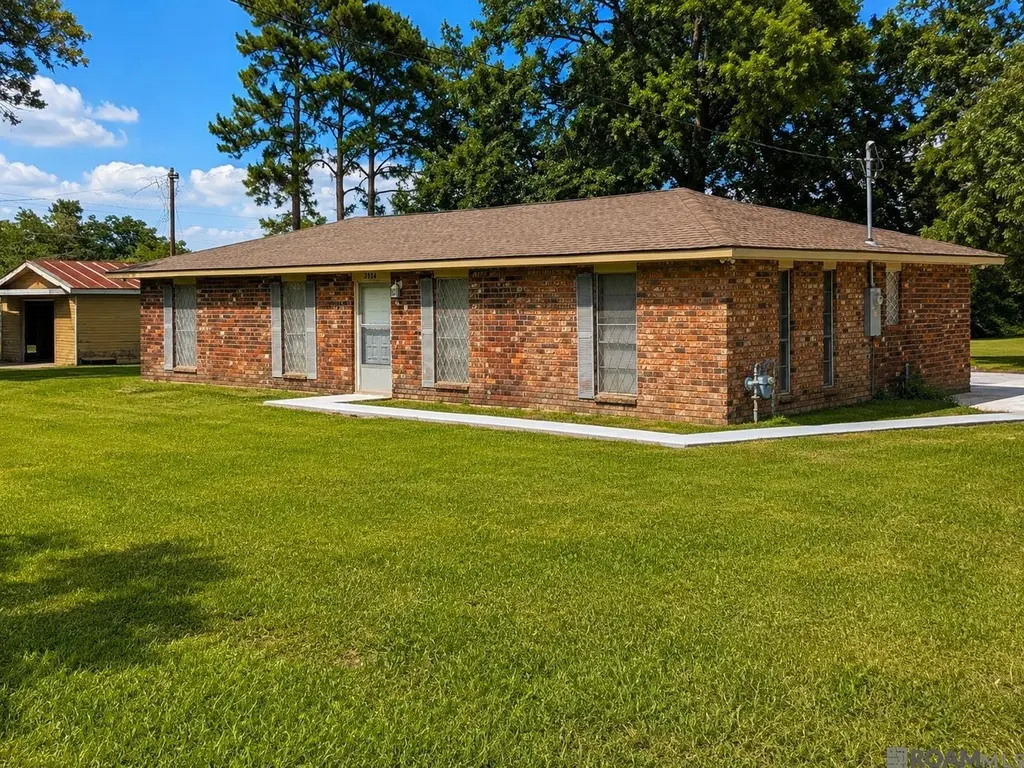
3336 Wyatt Dr · Darrow, LA
Flood risk 1/10 · Minimal
- FEMA flood zone
- X
- Chance of flooding over 30 yrs
- 0.0%
- Est. flood insurance / yr
- $507 – $1,088
Fire risk 1/10 · Minimal
- Est. fire insurance / yr
- $1,269 – $2,357
Heat risk 8/10 · Major
- Hot days now (above 107°F)
- 7 days/yr
- Hot days in 30 yrs
- 21 days/yr
Wind risk 9/10 · Severe
- Chance of severe wind over 30 yrs
- 99.0%
Air-quality risk 3/10 · Minor
- Unhealthy air days now
- 2 days/yr
- Unhealthy air days in 30 yrs
- 3 days/yr
Risk factors via First Street. Map © Google.
Why this score? — see what drove the C- grade
The composite is a weighted blend of 9 inputs, each scored 0–100. Each bar is that input's sub-score; the figure is the points it added to the 100-point composite (weight × sub-score).
- Cash flow +18.7/30.0
- ARV discount +7.5/15.0
- DSCR +5.9/10.0
- Appreciation +5.2/10.0
- 1% rule +5.0/10.0
- Schools +4.7/10.0
- Rent growth +2.5/5.0
- Livability +2.5/5.0
- Condition / age +2.5/5.0
$210,000
🖨 Deal sheet 📄 Offer letter ✓ Due diligence
Listing remarks MLS
Brick home on two lots at the corner of River Road and Wyatt Drive in Darrow, LA. Features an "open" living area with Den/Livingroom/Dining combined (28.8 x 14.0 feet). Complete renovation with: new roof; new sidewalk to front door; new central air conditioning and heating system; new lighting; new flooring throughout, new sheetrock ceiling and walls throughout; new interior paint; new blinds; new refrigerator; new stove; new hot water heater; new hardware; both bathrooms have new tubs, toilets and vanities, etc. Minutes to I-10 at Hwy 30 or Hwy 44 interchanges. Short commute to Geismar industrial corridor. Acclaimed Ascension Parish Schools. This home is really "like new" and priced to sell. Set you appointment to see!
Key facts
- New lighting
- Complete renovation
- Open living area
Tags
Property features AI
Exterior
- Parking: 4 parking spaces
- Home design: Detached single-family residence; Residential property
- Construction: Brick construction; Slab foundation
- Exterior features: Lot approximately 0.34 acres; Lot dimensions about 123 x 120 x 123 x 120
Interior
- Bathrooms: 2 full bathrooms
- Heating & cooling: Central heating (electric); Central air conditioning
- Interior features: Central heating and electric heat; Central air conditioning
Neighborhood map
What this means for you Summary
Snapshot
- This is a 3-bed/2.0-bath single-family listed at $210k.
Deal economics
- At list price, monthly cash flow is $208 ($2k/yr) — positive.
- The deal already cash-flows at list — no discount required.
- Meets the 1% rule at list price ($2k rent vs $210k).
Location & tenants
- Location reads: area grade C — affects rentability + tenant quality, not the cash-flow math above.
- Ascension Parish (suburban): math 48% / reading 58% proficiency, ranked #7 of 98 in LA (top 7%) — acceptable for families but not a draw, mixed tenant base, ~2y average lease.
- Market conditions: 23 active listings in the ZIP; 1 comparable units currently listed for rent nearby; 579 units permitted in Ascension Parish in 2024 (0 in 5+ unit buildings).
Forward outlook
- In year one you build about $2k of equity ($1k loan paydown + $852 appreciation (0.4% local appreciation)).
- Ascension County population projected at +43% by 2050 — long-run rental-demand tailwind backs the buy-and-hold thesis.
- At projected returns (0.4% appreciation + 3.0% rent growth), your $59k cash investment doubles in ~9 years — after that, you're playing with house money.
Negotiation context
- Only 10 days on market — expect competitive offers; lowballing is unlikely to land.
- 9 sale attempts with the ask held roughly flat each time — persistent listings suggest the price (not the market) is what's stuck; bring a comps-based counter.
Risks & watch-outs
- Climate carrying-cost: severe wind risk, 99% chance of damaging wind over 30y; extreme-heat days projected 7→21/yr by 2055 (HVAC capex compounding) — expect insurance premiums to compound above CPI over the hold.
Questions for the listing agent
- Is there a deadline driving the sale (1031 exchange, divorce, estate, relocation)? That informs how much negotiation room exists.
- What's the average days-on-market for RENTAL listings here right now (not sales)? A rising rental-DOM trend means longer vacancies and softer asking-rent achievability than the comps imply.
- What's the recent tenant-quality profile in this submarket — average credit score on applications, eviction rate, late-payment / NSF rate, and stable-employment percentage? A property-management company in the area should have these aggregated.
- How much new for-sale + rental construction is in the pipeline within 1–3 miles? Heavy new supply typically softens prices + rents 12–24 months out; constrained supply supports both.
Investment metrics
- 1% rule
- 1.00% ✓
- Cap rate
- 7.48%
- Cash-on-cash
- 4.24%
- DSCR
- 1.19
- GRM
- 8.3
CMA / ARV
- ARV (on-the-fly)
- $100,048
- Comps found
- 2
Show comp detail 2 sales within ~0.75 mi
| Address | Dist | Beds/Ba | Sqft | Sold | Price | $/sf | Match |
|---|---|---|---|---|---|---|---|
| 3336 Wyatt St | 0.00mi | 3/2.0 | 1,344 (-1%) | 9mo | $40,000 | $30 | 91 |
| 3337 Jackson St | 0.05mi | 3/2.5 | 1,360 (+1%) | 19mo | $100,000 | $74 | 79 |
Match score weights: distance 35% · size 25% · config 20% · recency 20%. Top-matched comps best support the ARV.
Projected returns pro-forma
0.41% appreciation · 3.0% rent growth · sell at horizon
- IRR
- 3.9%
- Equity multiple
- 1.19×
- Total profit
- $11,158
- Equity at exit
- $65,274
- IRR
- 8.8%
- Equity multiple
- 2.00×
- Total profit
- $59,075
- Equity at exit
- $81,979
Cash invested: $58,800 (down + closing). Projections, not guarantees.
Landlord ↔ Tenant lean methodology
- Overall (STATE)
- 90 Strongly Landlord-Friendly
- State Louisiana
- 90 Strongly Landlord-Friendly · R+12
- County
- — inherits STATE
- City
- — inherits STATE
ZIP-level market 70725
- Home prices YoY
- 0.2%
- Active inventory
- 23
- Price-to-rent
- 8.3×
Monthly cashflow live
- Estimated rent
- $2,100 medium interval (Pro) →
- Mortgage (P&I)
- −$1,101
- Tax est. 1.5%
- −$262 /mo · $3,150/yr
- Insurance
- −$88
- HOA
- −$0
- Vacancy / Maint / Mgmt
- −$441
- Net cashflow
- $208
Break-even live
UW: 25.0% down · 7.5% · 30yr · 1.5% tax · 5.0% vac · 8.0% maint · 8.0% mgmt
Financing live
Cash to close
- Down payment
- $52,500
- Closing costs
- $6,300
- Reserves months
- —
- Total cash needed
- —
Loan-product check · same deal, 3 products live
Conventional
25% down · 7.5% · 30yr
- Down + closing
- —
- Monthly P&I
- —
- Monthly cashflow
- —
- DSCR
- —
- Eligible?
- —
Personal DTI + credit; lowest rate.
DSCR
20% down · 8.5% · 30yr
- Down + closing
- —
- Monthly P&I
- —
- Monthly cashflow
- —
- DSCR
- —
- Eligible?
- —
No personal income docs; deal must DSCR.
Hard money
10% down · 12.0% · 12mo
- Down + closing
- —
- Monthly P&I
- —
- Monthly cashflow
- —
- DSCR
- —
- Eligible?
- —
Short-term bridge; refi at stabilization.
Rent comps 1 comps
| Address | Beds | Baths | Sqft | Rent | $/sqft | DOM | Units | Dist |
|---|---|---|---|---|---|---|---|---|
| 1228 Mississippi St Donaldsonville, LA | 2.0 | 1.0 | 1426 | $2,100 | $1.47 | 23d | 1 | 1.43mi |
Listing history 8 events
-
2026-06-18days on market $210,000 Active 10 DOM
-
2026-06-17days on market $210,000 Active 9 DOM
-
2026-06-16days on market $210,000 Active 8 DOM
-
2026-06-15days on market $210,000 Active 7 DOM
-
2026-06-14days on market $210,000 Active 5 DOM
-
2026-06-10days on market $210,000 Active 2 DOM
-
2026-06-09remarks 684-char remark
-
2026-06-09$210,000 Active 1 DOM
ⓘ Source: listings_history table (triggers on properties + properties_extension) + one-shot
backfill from property_details.listing_events for pre-trigger history.
Climate risk First Street
- Flood 1/10 Low FEMA zone X · 0% chance over 30 yrs
- Wildfire 1/10 Low
- Heat 8/10 Severe 7 d/yr ≥107°F today · 21 d/yr by 30 yrs out
- Wind 9/10 Extreme 99% chance of damaging wind over 30 yrs
- Air quality 3/10 Moderate 2 unhealthy d/yr today · 3 by 30 yrs out
Nearby sold comps map
Loading sold comps map…
Walkable amenities ~0.75 mi
Loading nearby amenities…
Taxation est. · year 1
- Rental income
- $25,200
- − Mortgage interest
- −$11,763
- − Property taxes
- −$3,150
- − Insurance
- −$1,050
- − Repairs & maintenance
- −$2,016
- − Management
- −$2,016
- − Depreciation
- −$6,109
- Taxable loss
- −$904
- Est. tax savings @ 24.0%
- +$217
- After-tax cash flow
- $2,710/yr
For passive investors: Depreciation is non-cash, so a rental often shows a tax loss while cash-flowing — sheltering income. Rental losses are passive: they offset passive income freely, and up to $25,000/yr can offset ordinary (W-2) income if you actively participate and your MAGI is under $100k (phasing out to $0 by $150k); unused losses carry forward. On sale, claimed depreciation is recaptured at up to 25%, and gains may owe capital-gains tax (a 1031 exchange can defer both). Figures are a year-1 estimate at your 24.0% rate — not tax advice; consult a CPA.
Schools (NCES district)
- District
- Ascension Parish
- NCES district ID
- 2200090
- Math proficiency
- 48% ▼ -31.00%
- Reading proficiency
- 58% ▼ -25.00%
- Median HH income
- $68,423
- Composite
- 47.0/100
- National rank
- #2347
- State rank
- #7 of 98 in LA
Livability — Darrow
No livability data for this city. (Only ~50 U.S. cities are tracked.)
Census & demographics
- Census place
- Darrow, LA
- Population (ZIP)
- 995
Population outlook (Ascension County) Hauer SSP2
- Today (2025)
- 145,480 people
- By 2030
- 158,329 · +8.8%
- By 2040
- 183,741 · +26.3%
- By 2050
- 207,615 · +42.7%
- By 2075
- 260,244 · +78.9%
- By 2100
- 289,576 · +99.0%
Race, ethnicity, and origin ACS 2023
- Neighborhood character
- Predominantly Black (72%)
- Race & ethnicity
- Black 72% White 28%
- Common ancestry
- Lithuanian 14%
Political lean MEDSL · Ascension
- 2024 margin
- Solid R (+34.0) · D 32.2% · R 66.1% · Other 1.7%
- 2008→2024 swing
- +1.7pp toward D · 2008: -35.7pp · 2024: -34.0pp
- All cycles
- 2024: R+34.0 2020: R+32.5 2016: R+36.0 2012: R+34.3 2008: R+35.7
Not yet ingested
- Civics
- —
Market trends
- HPI YoY
- ▲ 0.41%
- Current HPI
- 186.9917
- Rent YoY
- —
- Metro
- —
- State GDP YoY
- ▲ 3.29%
- F500 in state
- 10
Industry mix (Fortune 500 HQ in LA)
| Industry | F500 HQs | Revenue |
|---|---|---|
| Telecommunications | 2 | $23B |
|
||
| Utilities | 1 | $12B |
|
||
| Wholesale / Distribution | 1 | $5B |
|
||
| Advertising | 1 | $2B |
|
||
Price history
+349.2% since first listed21 events — show timeline
- 2026-06-08 Listed $210,000 GBRMLS
- 2026-06-08 Listed $210,000 AcadianaMLS
- 2026-01-05 Price Changed $89,000 AcadianaMLS
- 2026-01-05 Price Changed $89,000 GBRMLS
- 2025-12-02 Listed $120,000 GBRMLS
- 2025-12-02 Listed $120,000 AcadianaMLS
- 2025-09-16 Sold (MLS) — GSREIN
- 2025-08-19 Pending — GSREIN
- 2025-07-25 Price Changed $46,750 AcadianaMLS
- 2025-07-25 Relisted — GSREIN
- 2025-07-25 Price Changed $46,750 GSREIN
- 2025-06-09 Pending — GSREIN
- 2025-05-21 Price Changed $54,000 AcadianaMLS
- 2025-05-21 Relisted — GSREIN
- 2025-05-21 Price Changed $54,000 GSREIN
- 2025-05-06 Pending — GSREIN
- 2025-04-16 Price Changed $57,000 AcadianaMLS
- 2025-04-16 Price Changed $57,000 GSREIN
- 2025-03-18 Listed $60,000 GSREIN
- 2025-03-18 Listed $60,000 AcadianaMLS
- 2025-03-18 Listed $46,750 AcadianaMLS
Property tax history
-0.2%/yrLatest (2025): $296 · -1.7% YoY. Source: county tax records.
Cash-flow waterfall
monthlySold comps — $/sqft
last 12 mo · ≤1 miLoading sold comps…