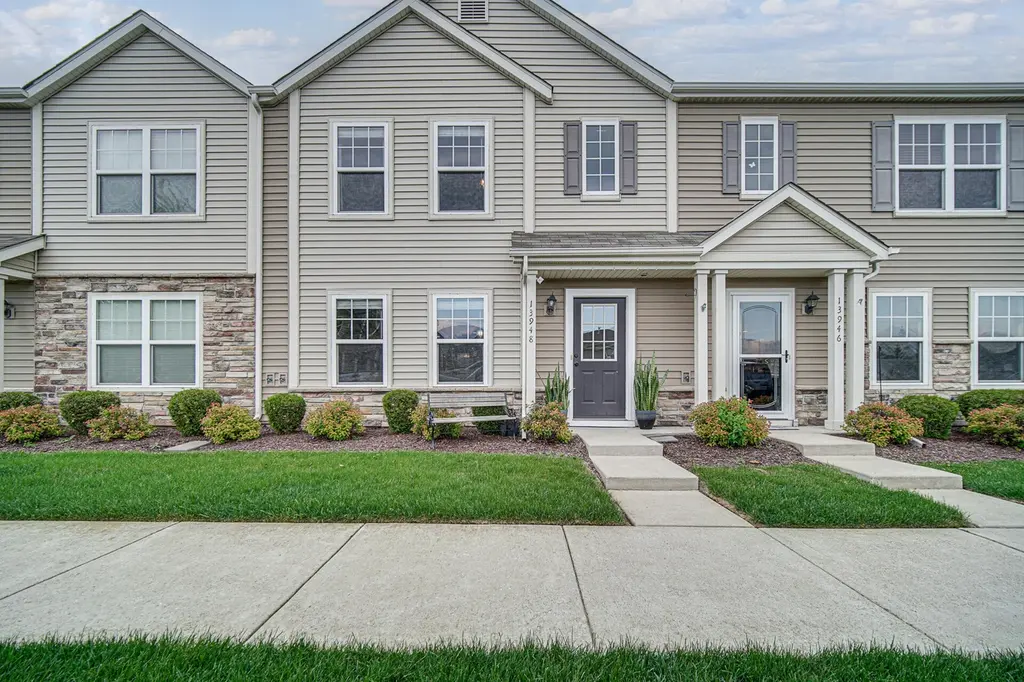
13948 Paramount Way · Cedar Lake, IN
Flood risk 1/10 · Minimal
- FEMA flood zone
- X (unshaded)
- Chance of flooding over 30 yrs
- 0.0%
- Est. flood insurance / yr
- $507 – $1,088
Fire risk 2/10 · Minimal
- Est. fire insurance / yr
- $717 – $1,331
Heat risk 3/10 · Minor
- Hot days now (above 101°F)
- 7 days/yr
- Hot days in 30 yrs
- 16 days/yr
Wind risk 2/10 · Minimal
- Chance of severe wind over 30 yrs
- 1.0%
Air-quality risk 2/10 · Minimal
- Unhealthy air days now
- 2 days/yr
- Unhealthy air days in 30 yrs
- 2 days/yr
Risk factors via First Street. Map © Google.
Why this score? — see what drove the D+ grade
The composite is a weighted blend of 9 inputs, each scored 0–100. Each bar is that input's sub-score; the figure is the points it added to the 100-point composite (weight × sub-score).
- Cash flow +19.0/30.0
- ARV discount +6.4/15.0
- DSCR +6.0/10.0
- 1% rule +4.8/10.0
- Schools +4.5/10.0
- Livability +3.2/5.0
- Rent growth +2.5/5.0
- Condition / age +2.5/5.0
- Appreciation +0.0/10.0
$241,000
🖨 Deal sheet (PDF) 📄 Offer letter ✓ Due diligence
Listing remarks MLS
THIS NEW HOME IS READY NOW! Olthof Homes presents the HER rated, energy saving Heritage Townhome! These homes are maintenance free and ready to move in! This townhome has 1,450 sf, attached garage, three bedrooms and a full bathroom on the upper level and a half bath on the lower level. This home features an open floor plan with a large great room. The beautiful kitchen comes equipped with upgrades such as maple cabinets, recessed lighting, and chrome fixtures. The large owner's bedroom comes complete with it's own walk in closet. Outside the home features cultured stone and private entrance and patio in the back. Our townhomes are fully landscaped and maintenance free including lawn care, snow removal, use of community pool. Energy features incl Low E energy star qualified windows, Tyvek exterior house wrap, sealed air ducts/registers, 3rd party inspections and 10 year structural, transferable warranty w/ industry best customer care program.
Key facts
- $90 HOA
- Garage
- Community pool
Property features AI
Finance
- HOA & community: Homeowners association with monthly fee; Community clubhouse; Community pool; Association fee $90 monthly
Exterior
- Parking: On-street parking available; Additional parking; Garage faces rear; 1-car garage
- Utilities: Public water; Public sewer
- Home design: Attached property; Two-story home; Built in 2017
- Construction: Shingle roof; Built in 2017
- Exterior features: Neighborhood view; Shingle roof
Interior
- Kitchen: Refrigerator; Gas range; Dishwasher
- Bedrooms: Primary bedroom; Two additional bedrooms
- Flooring: Carpet; Vinyl
- Bathrooms: 1 full bathroom; 1 half bathroom
- Heating & cooling: Natural gas heating; Central air conditioning; Ceiling fans
- Interior features: Ceiling fans; Open floor plan; Laundry room
- Laundry & utility: Washer; Dryer
Neighborhood map
What this means for you Summary
Snapshot
- This is a 3-bed/1.5-bath single-family listed at $241k.
Deal economics
- At list price, monthly cash flow is $250 ($3k/yr) — positive.
- The deal already cash-flows at list — no discount required.
- To meet the 1% rule (rent ≥ 1% of price), the offer needs to be $236k (2.2% below list).
- Recommended offer: $236k (2.2% below list) — sets the bar for 1% rule.
- Cap rate 7.5% vs local median 3.5% in Cedar Lake — top-decile yield for the area; either an underpriced asset or a hidden risk that comps aren't pricing in. Stress-test before assuming the spread holds.
Location & tenants
- Location reads 65/100 on livability (#354 in IN) — a middle-class / working-renter tenant base. Strengths: crime A+, cost of living A+, housing A+; Watch: amenities F, commute F, health & safety F.
- Hanover Community School Corporation (suburban): math 49% / reading 53% proficiency, ranked #38 of 301 in IN (top 13%) — acceptable for families but not a draw, mixed tenant base, ~2y average lease; only 20% free/reduced lunch — higher-income household profile.
- Zoned schools: Jane Ball Elementary School (math 62% / reading 52%, grade C+, #172 of 994 statewide, top 18%, 371 students, 31% FRL); Hanover Central Middle School (math 44% / reading 47%, grade D+, #79 of 330 statewide, top 24%, 650 students, 25% FRL); Hanover Central High School (math 47% / reading 72%, grade C+, #49 of 369 statewide, top 16%, 782 students, 22% FRL).
- Market conditions: 270 active listings in the ZIP; 5 comparable units currently listed for rent nearby; rentals leasing fast (median 9d on market — plan ~1-2 weeks tenant-placement turnaround); solid renter incomes; 1,642 units permitted in Lake County in 2024 (14 in 5+ unit buildings).
- This rent runs 34% of the median local income ($84k/yr) — at the standard rent-burdened threshold; future hikes will face affordability resistance.
Forward outlook
- Local home prices are declining (-3.0%/yr); year-one equity from $2k of loan paydown is wiped out by about $7k of value loss. Plan a longer hold.
- Lake County population projected to shrink 7% by 2050 — rents likely to lag national; underwrite the cash flow, not the appreciation.
Negotiation context
- Only 5 days on market — expect competitive offers; lowballing is unlikely to land.
- 2 sale attempts since 10y ago with the ask held roughly flat each time — persistent listings suggest the price (not the market) is what's stuck; bring a comps-based counter.
- Current owner paid $132k; list at $241k implies a 83% gain — meaningful room to come down on a strong offer.
Questions for the listing agent
- What does the HOA fee cover, when was the last increase, and are there any pending special assessments or reserve-fund shortfalls?
- Is there a deadline driving the sale (1031 exchange, divorce, estate, relocation)? That informs how much negotiation room exists.
- The area grade is low — what's the realistic commute time and amenity access for the typical tenant pool here? Any planned neighborhood developments (good or bad) we should know about?
- What's the average days-on-market for RENTAL listings here right now (not sales)? A rising rental-DOM trend means longer vacancies and softer asking-rent achievability than the comps imply.
- What's the recent tenant-quality profile in this submarket — average credit score on applications, eviction rate, late-payment / NSF rate, and stable-employment percentage? A property-management company in the area should have these aggregated.
- How much new for-sale + rental construction is in the pipeline within 1–3 miles? Heavy new supply typically softens prices + rents 12–24 months out; constrained supply supports both.
Investment metrics
- 1% rule
- 0.98% ✗
- Cap rate
- 7.54%
- Cash-on-cash
- 4.44%
- DSCR
- 1.20
- GRM
- 8.5
CMA / ARV
- ARV (median comp)
- $235,499
- List price
- $241,000
- Delta
- 2.34%
- Verdict
- FAIR
- Comps
- 20 within 1.0 mi
Show comp detail 12 sales within ~0.75 mi
| Address | Dist | Beds/Ba | Sqft | Sold | Price | $/sf | Match |
|---|---|---|---|---|---|---|---|
| 10014 W 141st Ln | 0.30mi | 3/2.0 | 1,785 (+10%) | 0mo | $365,000 | $204 | 68 |
| 10013 W 141st Ln | 0.31mi | 3/2.0 | 1,792 (+10%) | 4mo | $410,000 | $229 | 63 |
| 9992 W 141st Ln | 0.31mi | 3/2.0 | 1,845 (+13%) | 2mo | $356,500 | $193 | 60 |
| 10439 Richmond Ave | 0.15mi | 2/2.0 (-1) | 1,533 (-6%) | 21mo | $270,000 | $176 | 59 |
| 14117 Heritage Way | 0.33mi | 3/2.0 | 1,693 (+4%) | 21mo | $360,000 | $213 | 59 |
| 13685 Freedom Way | 0.40mi | 2/2.0 (-1) | 1,632 (+0%) | 18mo | $307,900 | $189 | 59 |
| 9803 W 136th Pl | 0.61mi | 3/2.0 | 1,600 (-2%) | 13mo | $285,000 | $178 | 56 |
| 13972 Breakwater Ln | 0.66mi | 2/2.0 (-1) | 1,659 (+2%) | 11mo | $345,000 | $208 | 49 |
| 13547 Drummond St | 0.62mi | 3/3.0 | 1,824 (+12%) | 2mo | $350,000 | $192 | 44 |
| 14346 Clover Ave | 0.50mi | 2/2.0 (-1) | 1,825 (+12%) | 9mo | $310,000 | $170 | 42 |
| 13614 Ivy St | 0.64mi | 4/2.5 (+1) | 1,412 (-13%) | 15mo | $313,500 | $222 | 26 |
| 10182 W 146th Ave | 0.74mi | 3/2.0 | 1,872 (+15%) | 18mo | $375,000 | $200 | 24 |
Match score weights: distance 35% · size 25% · config 20% · recency 20%. Top-matched comps best support the ARV.
Projected returns pro-forma
-3.0% appreciation · 3.0% rent growth · sell at horizon
- IRR
- -9.4%
- Equity multiple
- 0.66×
- Total profit
- $-23,153
- Equity at exit
- $35,934
- IRR
- 0.1%
- Equity multiple
- 1.00×
- Total profit
- $319
- Equity at exit
- $20,837
Cash invested: $67,480 (down + closing). Projections, not guarantees.
Landlord ↔ Tenant lean methodology
- Overall (STATE)
- 90 Strongly Landlord-Friendly
- State Indiana
- 90 Strongly Landlord-Friendly · R+11
- County
- — inherits STATE
- City
- — inherits STATE
ZIP-level market 46303
- Active inventory
- 270
- Price-to-rent
- 8.5×
Monthly cashflow live
- Estimated rent
- $2,356 high interval (Pro) →
- Mortgage (P&I)
- −$1,264
- Tax from tax record
- −$158 /mo · $1,892/yr
- Insurance
- −$100
- HOA
- −$90
- Vacancy / Maint / Mgmt
- −$495
- Net cashflow
- $250
Break-even live
Sensitivity live
| Price | -10% $386 | -5% $318 | +0% $250 | +5% $181 | +10% $113 |
|---|---|---|---|---|---|
| Rent | -10% $63 | -5% $157 | +0% $250 | +5% $343 | +10% $436 |
| Rate | -1.0pp $371 | -0.5pp $311 | base $250 | +0.5pp $187 | +1.0pp $124 |
UW: 25.0% down · 7.5% · 30yr · 1.5% tax · 5.0% vac · 8.0% maint · 8.0% mgmt
Financing live
Cash to close
- Down payment
- $60,250
- Closing costs
- $7,230
- Reserves months
- —
- Total cash needed
- —
Loan-product check · same deal, 3 products live
Conventional
25% down · 7.5% · 30yr
- Down + closing
- —
- Monthly P&I
- —
- Monthly cashflow
- —
- DSCR
- —
- Eligible?
- —
Personal DTI + credit; lowest rate.
DSCR
20% down · 8.5% · 30yr
- Down + closing
- —
- Monthly P&I
- —
- Monthly cashflow
- —
- DSCR
- —
- Eligible?
- —
No personal income docs; deal must DSCR.
Hard money
10% down · 12.0% · 12mo
- Down + closing
- —
- Monthly P&I
- —
- Monthly cashflow
- —
- DSCR
- —
- Eligible?
- —
Short-term bridge; refi at stabilization.
Rent comps 5 comps
| Address | Beds | Baths | Sqft | Rent | $/sqft | DOM | Units | Dist |
|---|---|---|---|---|---|---|---|---|
| 14153 Magnolia St Cedar Lake, IN | 2.0 | 1.5 | 1340 | $2,500 | $1.87 | 0d | 1 | 0.37mi |
| 14347 Clover Ave Cedar Lake, IN | 3.0 | 2.0 | 1475 | $2,775 | $1.88 | 25d | 1 | 0.52mi |
| 9705 W 134th Pl Cedar Lake, IN | 3.0 | 2.0 | 1656 | $2,900 | $1.75 | 16d | 1 | 0.78mi |
| 14630 Euclid St Unit 1UNIT A Cedar Lake, IN | 2.0 | 2.0 | 1400 | $2,000 | $1.43 | 0d | 1 | 0.96mi |
| 13135 Schneider St Cedar Lake, IN | 2.0 | 1.0 | 1100 | $1,395 | $1.27 | 8d | 1 | 1.08mi |
HOA detail
- Monthly dues
- $90 · $1,080/yr
- Likely covers
- landscapingsnow removalpool
Listing history 4 events
-
2026-05-06status Pending 615-char remark
-
2026-04-30$241,000 Active 615-char remark
-
2017-01-12soldstatus $132,004 956-char remark
Show marketing remark (956 chars)
THIS NEW HOME IS READY NOW! Olthof Homes presents the HER rated, energy saving Heritage Townhome! These homes are maintenance free and ready to move in! This townhome has 1,450 sf, attached garage, three bedrooms and a full bathroom on the upper level and a half bath on the lower level. This home features an open floor plan with a large great room. The beautiful kitchen comes equipped with upgrades such as maple cabinets, recessed lighting, and chrome fixtures. The large owner's bedroom comes complete with it's own walk in closet. Outside the home features cultured stone and private entrance and patio in the back. Our townhomes are fully landscaped and maintenance free including lawn care, snow removal, use of community pool. Energy features incl Low E energy star qualified windows, Tyvek exterior house wrap, sealed air ducts/registers, 3rd party inspections and 10 year structural, transferable warranty w/ industry best customer care program.
-
2016-11-01$132,004 956-char remark
Show marketing remark (956 chars)
THIS NEW HOME IS READY NOW! Olthof Homes presents the HER rated, energy saving Heritage Townhome! These homes are maintenance free and ready to move in! This townhome has 1,450 sf, attached garage, three bedrooms and a full bathroom on the upper level and a half bath on the lower level. This home features an open floor plan with a large great room. The beautiful kitchen comes equipped with upgrades such as maple cabinets, recessed lighting, and chrome fixtures. The large owner's bedroom comes complete with it's own walk in closet. Outside the home features cultured stone and private entrance and patio in the back. Our townhomes are fully landscaped and maintenance free including lawn care, snow removal, use of community pool. Energy features incl Low E energy star qualified windows, Tyvek exterior house wrap, sealed air ducts/registers, 3rd party inspections and 10 year structural, transferable warranty w/ industry best customer care program.
ⓘ Source: listings_history table (triggers on properties + properties_extension) + one-shot
backfill from property_details.listing_events for pre-trigger history.
Tax reassessment forecast IN · Partial reset (capped growth)
- Current annual tax
- $1,892 · $158/mo
- Projected year-2 tax
- $1,970 · $164/mo
- Expected delta
- +$78/yr (+$7/mo · 4.1%)
ⓘ Screening estimate from a state-policy table — verify with the county assessor before closing.
Climate risk First Street
- Flood 1/10 Low FEMA zone X (unshaded) · 0% chance over 30 yrs
- Wildfire 2/10 Low
- Heat 3/10 Moderate 7 d/yr ≥101°F today · 16 d/yr by 30 yrs out
- Wind 2/10 Low 100% chance of damaging wind over 30 yrs
- Air quality 2/10 Low 2 unhealthy d/yr today · 2 by 30 yrs out
Nearby sold comps map
Loading sold comps map…
Walkable amenities ~0.75 mi
Loading nearby amenities…
Taxation est. · year 1
- Rental income
- $28,276
- − Mortgage interest
- −$13,500
- − Property taxes
- −$1,892
- − Insurance
- −$1,205
- − Repairs & maintenance
- −$2,262
- − Management
- −$2,262
- − HOA
- −$1,080
- − Depreciation
- −$7,011
- Taxable loss
- −$936
- Est. tax savings @ 24.0%
- +$225
- After-tax cash flow
- $3,220/yr
For passive investors: Depreciation is non-cash, so a rental often shows a tax loss while cash-flowing — sheltering income. Rental losses are passive: they offset passive income freely, and up to $25,000/yr can offset ordinary (W-2) income if you actively participate and your MAGI is under $100k (phasing out to $0 by $150k); unused losses carry forward. On sale, claimed depreciation is recaptured at up to 25%, and gains may owe capital-gains tax (a 1031 exchange can defer both). Figures are a year-1 estimate at your 24.0% rate — not tax advice; consult a CPA.
Schools (NCES district)
- District
- Hanover Community School Corporation
- NCES district ID
- 1804350
- Math proficiency
- 49% ▼ -11.00%
- Reading proficiency
- 53% ▼ -7.00%
- Median HH income
- $68,151
- Composite
- 45.34/100
- National rank
- #2637
- State rank
- #38 of 301 in IN
Livability — Cedar Lake
- Score
- 65/100
- State rank
- #354
- US rank
- #13482
Category grades
Schools grade is shown separately in the Schools card above.
Census & demographics
- Census place
- Cedar Lake, IN
- County
- Lake County · 422,878 people
- City population
- 17,680
- Metro
- Chicago-Naperville-Elgin, IL-IN-WI
- Population (ZIP)
- 17,680
- Household income
- $84,211
- Rent vs Own
- Severe rent burden
- 84.0
Population outlook (Lake County) Hauer SSP2
- Today (2025)
- 484,026 people
- By 2030
- 478,091 · -1.2%
- By 2040
- 462,974 · -4.3%
- By 2050
- 449,894 · -7.1%
- By 2075
- 436,169 · -9.9%
- By 2100
- 426,607 · -11.9%
Race, ethnicity, and origin ACS 2023
- Neighborhood character
- Predominantly White (88%)
- Race & ethnicity
- White 88% Hispanic / Latino 8% Two or more races 7%
- Hispanic origin (detail)
- Mexican 7%
- Common ancestry
- Romanian 16% Iranian 9% Italian 1%
- Foreign-born
- 2% · China
- Languages at home
- 95% English-only · Other Indo-European 2% Russian/Polish/Slavic 2% Spanish 2%
Political lean MEDSL · Lake
- 2024 margin
- Lean D (+5.6) · D 52.1% · R 46.5% · Other 1.5%
- 2008→2024 swing
- -28.6pp toward R · 2008: 34.3pp · 2024: 5.6pp
- All cycles
- 2024: D+5.6 2020: D+15.1 2016: D+20.6 2012: D+31.0 2008: D+34.3
Not yet ingested
- Civics
- —
Market trends
- HPI YoY
- ▼ -182.94%
- Current HPI
- 267.4434
- Rent YoY
- —
- Metro
- Chicago-Naperville-Elgin, IL-IN-WI
- State GDP YoY
- ▲ 2.90%
- F500 in state
- 18
Industry mix (Fortune 500 HQ in IN)
| Industry | F500 HQs | Revenue |
|---|---|---|
| Industrial Machinery | 2 | $37B |
|
||
| Healthcare | 1 | $177B |
|
||
| Pharmaceuticals | 1 | $45B |
|
||
| Metals / Steel | 1 | $18B |
|
||
| Agriculture | 1 | $17B |
|
||
| Packaging | 1 | $12B |
|
||
Price history
+82.6% since first listed4 events — show timeline
- 2026-05-06 Pending — NIRA MLS as Distributed by MLS Grid
- 2026-04-30 Listed $241,000 NIRA MLS as Distributed by MLS Grid
- 2017-01-12 Sold (MLS) $132,004 NIRA MLS as Distributed by MLS Grid
- 2016-11-01 Listed $132,004 NIRA MLS as Distributed by MLS Grid
Property tax history
+71.5%/yrLatest (2024): $1,892 · +3.2% YoY. Source: county tax records.
Cash-flow waterfall
monthlySold comps — $/sqft
last 12 mo · ≤1 miLoading sold comps…