 Multi-family
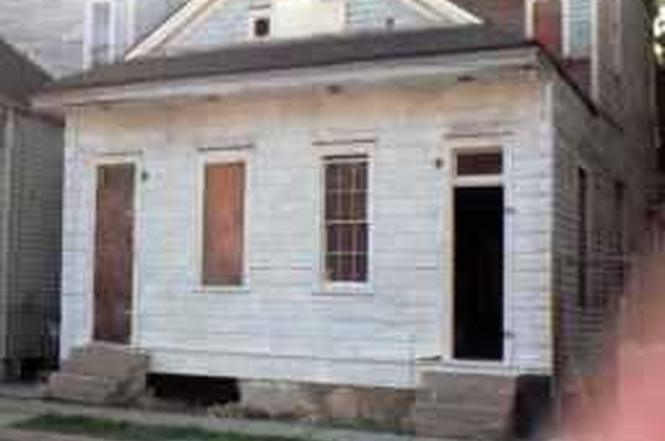
1141-43 N Robertson St · New Orleans, LA
Flood risk 8/10 · Major
- FEMA flood zone
- X
- Chance of flooding over 30 yrs
- 0.6%
- Est. flood insurance / yr
- $507 – $1,088
Fire risk 1/10 · Minimal
- Est. fire insurance / yr
- $1,269 – $2,357
Heat risk 10/10 · Severe
- Hot days now (above 108°F)
- 7 days/yr
- Hot days in 30 yrs
- 21 days/yr
Wind risk 10/10 · Severe
- Chance of severe wind over 30 yrs
- 99.0%
Air-quality risk 4/10 · Minor
- Unhealthy air days now
- 4 days/yr
- Unhealthy air days in 30 yrs
- 4 days/yr
Risk factors via First Street. Map © Google.
Why this score? — see what drove the D grade
The composite is a weighted blend of 9 inputs, each scored 0–100. Each bar is that input's sub-score; the figure is the points it added to the 100-point composite (weight × sub-score).
- Cash flow +15.0/30.0
- ARV discount +7.5/15.0
- 1% rule +5.0/10.0
- DSCR +5.0/10.0
- Livability +4.0/5.0
- Rent growth +2.5/5.0
- Condition / age +2.5/5.0
- Schools +1.6/10.0
- Appreciation +0.0/10.0
$74,000
🖨 Deal sheet 📄 Offer letter ✓ Due diligence
Multi-family units
County records classify this as Multi-Family (2-4 Unit). Listing-text estimate: 1 unit. estimate disagrees with records
Listing remarks MLS
Great lot, great location!
Key facts
- 2,112 sq ft lot
- Listed 364 days
Property features AI
Exterior
- Utilities: Public water; Public sewer
- Home design: Zoned HMR-1
- Exterior features: City lot; Irregularly shaped lot; 25 ft frontage
Interior
- Interior features: Property is suitable for single-family or multi-family residential use
Neighborhood map
What this means for you Summary
Snapshot
- This is a 4-bed/2.0-bath multifamily listed at $74k.
Deal economics
- At list price, monthly cash flow is $2k ($24k/yr) — positive.
- The deal already cash-flows at list — no discount required.
- Meets the 1% rule at list price ($3k rent vs $74k).
- Recommended offer: $65k (12.0% below list) — sets the bar for market timing.
- Cap rate 39.9% vs local median 4.4% in New Orleans — top-decile yield for the area; either an underpriced asset or a hidden risk that comps aren't pricing in. Stress-test before assuming the spread holds.
Location & tenants
- Location reads 81/100 on livability (#3 in LA, #1,383 nationally) — a professional / high-income tenant draw. Strengths: amenities A+, commute A+, health & safety A+; Watch: crime C-, employment D.
- Orleans Parish (urban): math 11% / reading 27% proficiency, ranked #69 of 98 in LA (top 70%) — low school quality limits family demand, transient renter base, plan for 1-2y turnover; 68% free/reduced lunch — lower-income household profile, screen leases tightly.
- Market conditions: Rents flat; 350 active listings in the ZIP; 40 comparable units currently listed for rent nearby; rentals at typical pace (median 24d on market — plan ~3-4 weeks tenant-placement turnaround); 710 units permitted in Orleans Parish in 2024 (244 in 5+ unit buildings).
- At $3,209/mo this rent would consume 74% of the median local household income ($52k/yr) (locally 1001% of renters already pay >50% of income on rent) — very limited rent-growth headroom before tenants either downsize or default.
Forward outlook
- Local home prices are declining (-3.0%/yr); year-one equity from $512 of loan paydown is wiped out by about $2k of value loss. Plan a longer hold.
- Orleans County population projected at +61% by 2050 — long-run rental-demand tailwind backs the buy-and-hold thesis.
- At projected returns (-3.0% appreciation + 0.2% rent growth), your $21k cash investment doubles in ~1 year — after that, you're playing with house money.
Negotiation context
- It's been on market 364 days — a 12% lower offer ($65k) is reasonable based on typical stale-listing flexibility.
- 4 sale attempts since 29y ago; this cycle's ask has dropped $18k (20%) from the opening price — seller is motivated, your offer sets the floor, not the list.
- Current owner paid $7k; list at $74k implies a 957% gain — meaningful room to come down on a strong offer.
Risks & watch-outs
- Watch-outs: flood insurance adds $66/mo; built in 1920 — expect roof / HVAC / electrical / plumbing capex.
- Climate carrying-cost: severe flood risk; severe wind risk, 99% chance of damaging wind over 30y; extreme-heat days projected 7→21/yr by 2055 (HVAC capex compounding) — expect insurance premiums to compound above CPI over the hold.
Questions for the listing agent
- It's been on market 364 days. Have you received any prior offers? Is the seller open to a 12% concession, seller financing, or rate buy-down credit?
- Built in 1920 — when were the roof, HVAC, electrical panel, plumbing, and water heater last replaced?
- What's the actual annual flood-insurance premium (NFIP or private), and is the property in a SFHA with mandatory coverage?
- Why hasn't it sold? Are there any deal-killer items the seller is aware of (foundation, flood, title, zoning, code violations)?
- Is there a deadline driving the sale (1031 exchange, divorce, estate, relocation)? That informs how much negotiation room exists.
- The area grade is low — what's the realistic commute time and amenity access for the typical tenant pool here? Any planned neighborhood developments (good or bad) we should know about?
- What's the average days-on-market for RENTAL listings here right now (not sales)? A rising rental-DOM trend means longer vacancies and softer asking-rent achievability than the comps imply.
- What's the recent tenant-quality profile in this submarket — average credit score on applications, eviction rate, late-payment / NSF rate, and stable-employment percentage? A property-management company in the area should have these aggregated.
- How much new apartment / multifamily construction is in the pipeline within 1–3 miles? Heavy new supply (>2% of stock underway) typically softens rents 12–24 months out; light construction supports rent growth.
Investment metrics
- 1% rule
- 4.34% ✓
- Cap rate
- 39.87%
- Cash-on-cash
- 119.92%
- DSCR
- 6.34
- GRM
- 1.9
CMA / ARV
- ARV (on-the-fly)
- $264,990
- Comps found
- 12
Show comp detail 12 sales within ~0.75 mi
| Address | Dist | Beds/Ba | Sqft | Sold | Price | $/sf | Match |
|---|---|---|---|---|---|---|---|
| 1124-1126 Henriette Delille St | 0.26mi | 4/2.0 | 2,071 (-5%) | 2mo | $157,000 | $76 | 77 |
| 1722 24 St Ann St | 0.31mi | 4/3.5 | 2,240 (+2%) | 1mo | $410,000 | $183 | 75 |
| 1128-1130 Henriette Delille St | 0.25mi | 4/2.0 | 2,020 (-8%) | 8mo | $157,000 | $78 | 69 |
| 1432-1434 Ursulines Ave | 0.11mi | 4/1.0 | 1,888 (-14%) | 6mo | $228,000 | $121 | 63 |
| 1614 16 Annette St | 0.55mi | 4/2.0 | 1,998 (-9%) | 4mo | $120,000 | $60 | 56 |
| 1705 07 Pauger St | 0.53mi | 4/2.0 | 2,022 (-8%) | 8mo | $502,500 | $249 | 56 |
| 2117 19 Marais St | 0.70mi | 4/2.0 | 2,084 (-5%) | 5mo | $295,000 | $142 | 56 |
| 1428-1430 Chartres St | 0.70mi | 4/3.0 | 2,011 (-8%) | 1mo | $556,000 | $276 | 48 |
| 1923-25 Pauger St | 0.56mi | 4/2.0 | 1,879 (-14%) | 4mo | $70,000 | $37 | 47 |
| 1810 Allen St | 0.61mi | 4/4.0 | 2,390 (+9%) | 4mo | $265,000 | $111 | 45 |
| 1932-34 Dauphine St | 0.60mi | 3/3.0 (-1) | 1,990 (-9%) | 6mo | $625,000 | $314 | 43 |
| 2601 03 St Ann St | 0.74mi | 4/2.0 | 1,946 (-11%) | 5mo | $220,000 | $113 | 42 |
Match score weights: distance 35% · size 25% · config 20% · recency 20%. Top-matched comps best support the ARV.
Projected returns pro-forma
-3.0% appreciation · 0.18% rent growth · sell at horizon
- IRR
- —
- Equity multiple
- 6.16×
- Total profit
- $106,861
- Equity at exit
- $11,034
- IRR
- —
- Equity multiple
- 11.78×
- Total profit
- $223,320
- Equity at exit
- $6,398
Cash invested: $20,720 (down + closing). Projections, not guarantees.
Landlord ↔ Tenant lean methodology
- Overall (STATE)
- 90 Strongly Landlord-Friendly
- State Louisiana
- 90 Strongly Landlord-Friendly · R+12
- County
- — inherits STATE
- City
- — inherits STATE
ZIP-level market 70116
- Home prices YoY
- -34.5%
- Rents YoY
- 0.2%
- Active inventory
- 350
- Price-to-rent
- 1.9×
Monthly cashflow live
- Estimated rent
- $3,209 high interval (Pro) →
- Mortgage (P&I)
- −$388
- Tax from tax record
- −$45 /mo · $545/yr
- Insurance
- −$31
- Flood insurance flood zone
- −$66 /mo · $798/yr
- HOA
- −$0
- Vacancy / Maint / Mgmt
- −$674
- Net cashflow
- $2,004
Break-even live
UW: 25.0% down · 7.5% · 30yr · 1.5% tax · 5.0% vac · 8.0% maint · 8.0% mgmt
Financing live
Cash to close
- Down payment
- $18,500
- Closing costs
- $2,220
- Reserves months
- —
- Total cash needed
- —
Loan-product check · same deal, 3 products live
Conventional
25% down · 7.5% · 30yr
- Down + closing
- —
- Monthly P&I
- —
- Monthly cashflow
- —
- DSCR
- —
- Eligible?
- —
Personal DTI + credit; lowest rate.
DSCR
20% down · 8.5% · 30yr
- Down + closing
- —
- Monthly P&I
- —
- Monthly cashflow
- —
- DSCR
- —
- Eligible?
- —
No personal income docs; deal must DSCR.
Hard money
10% down · 12.0% · 12mo
- Down + closing
- —
- Monthly P&I
- —
- Monthly cashflow
- —
- DSCR
- —
- Eligible?
- —
Short-term bridge; refi at stabilization.
Rent comps 40 comps
| Address | Beds | Baths | Sqft | Rent | $/sqft | DOM | Units | Dist |
|---|---|---|---|---|---|---|---|---|
| 1433 Esplanade Ave New Orleans, LA | 3.0 | 2.0 | 2411 | $5,000 | $2.07 | 2d | 1 | 0.15mi |
| 1021 Henriette Delille St New Orleans, LA | 3.0 | 2.0 | 2012 | $2,250 | $1.12 | 17d | 1 | 0.23mi |
| 1247 Kerlerec St New Orleans, LA | 3.0 | 2.0 | 1500 | $2,500 | $1.67 | 44d | 1 | 0.28mi |
| 1245 Kerlerec St New Orleans, LA | 3.0 | 2.0 | 1500 | $2,500 | $1.67 | 44d | 1 | 0.28mi |
| 1000 Saint Philip St New Orleans, LA | 3.0 | 2.5 | 2650 | $4,800 | $1.81 | 44d | 1 | 0.38mi |
| 811 Burgundy St New Orleans, LA | 4.0 | 2.5 | 2059 | $5,000 | $2.43 | 44d | 1 | 0.44mi |
| 928 Kerlerec St New Orleans, LA | 3.0 | 3.5 | 1684 | $2,750 | $1.63 | 3d | 1 | 0.45mi |
| 928 Kerlerec St New Orleans, LA | 3.0 | 3.5 | 1684 | $2,750 | $1.63 | 3d | 1 | 0.45mi |
| 618 N Rampart St #204 New Orleans, LA | 3.0 | 2.5 | 1904 | $4,500 | $2.36 | 44d | 1 | 0.49mi |
| 839 Dumaine St New Orleans, LA | 3.0 | 4.0 | 2740 | $6,500 | $2.37 | 44d | 1 | 0.49mi |
| 1860 Burgundy St New Orleans, LA | 4.0 | 4.0 | 3000 | $3,500 | $1.17 | 23d | 1 | 0.51mi |
| 324 N Roman St New Orleans, LA | 3.0 | 3.0 | 2100 | $2,500 | $1.19 | 44d | 1 | 0.60mi |
| 2331 Columbus St New Orleans, LA | 3.0 | 1.0 | 1976 | $1,850 | $0.94 | 23d | 1 | 0.67mi |
| 751 Chartres St New Orleans, LA | 2.0–3.0 | 2.0 | 1461 | $3,450 | $2.36 | 44d | 1 | 0.69mi |
| 527 Saint Ann St Unit 3 New Orleans, LA | 3.0 | 2.0 | 1687 | $3,500 | $2.07 | 44d | 1 | 0.73mi |
| 515 Saint Ann St Unit 3 New Orleans, LA | 3.0 | 2.0 | 1644 | $3,600 | $2.19 | 44d | 1 | 0.74mi |
| 939 Iberville St New Orleans, LA | 1.0–3.0 | 1.0 | 1502 | $3,800 | $2.53 | 12d | 7 | 0.78mi |
| 810 Bienville St New Orleans, LA | 1.0–3.0 | 1.0–2.0 | 995 | $2,688 | $2.70 | 3d | 9 | 0.79mi |
| 1936 N Johnson St Unit 36 New Orleans, LA | 3.0 | 2.0 | 1844 | $2,400 | $1.30 | 23d | 1 | 0.80mi |
| 1938 N Johnson St Unit 38 New Orleans, LA | 3.0 | 2.0 | 1844 | $2,400 | $1.30 | 23d | 1 | 0.80mi |
| 1011 Canal St Unit 1513939P New Orleans, LA | 4.0 | 4.0 | 1765 | $11,253 | $6.38 | 23d | 1 | 0.81mi |
| 1011 Canal St Unit 1513926P New Orleans, LA | 1.0–4.0 | 1.0–4.0 | 1016 | $12,077 | $11.88 | 1d | 2 | 0.81mi |
| 535 Decatur St Unit 3 New Orleans, LA | 3.0 | 2.0 | 1600 | $2,800 | $1.75 | 12d | 1 | 0.83mi |
| 2317 N Rampart St Unit 1272378P New Orleans, LA | 3.0–6.0 | 2.0–4.0 | 1581 | $4,154 | $2.63 | 3d | 2 | 0.85mi |
| 2320 N Rampart St New Orleans, LA | 3.0 | 3.0 | 2317 | $3,700 | $1.60 | 44d | 1 | 0.85mi |
| 1837 Touro St New Orleans, LA | 3.0 | 1.0 | 1994 | $2,000 | $1.00 | 23d | 1 | 0.86mi |
| 1831 N Miro St New Orleans, LA | 3.0 | 2.0 | 1882 | $2,500 | $1.33 | 44d | 1 | 0.87mi |
| 2731 Saint Philip St Unit 2733 New Orleans, LA | 4.0 | 2.0 | 2000 | $2,600 | $1.30 | 23d | 1 | 0.88mi |
| 2664 Lepage St New Orleans, LA | 3.0 | 2.0 | 1750 | $2,725 | $1.56 | 44d | 1 | 0.94mi |
| 2920 Pauger St New Orleans, LA | 4.0 | 2.0 | 1882 | $1,995 | $1.06 | 23d | 1 | 0.99mi |
| 1466 N White St New Orleans, LA | 3.0 | 1.5 | 1500 | $2,250 | $1.50 | 3d | 1 | 1.05mi |
| 800 Gravier St Unit 1272312P New Orleans, LA | 2.0–4.0 | 2.0–4.0 | 1673 | $6,169 | $3.69 | 14d | 2 | 1.07mi |
| 2738 Bienville St New Orleans, LA | 4.0 | 3.0 | 1671 | $2,200 | $1.32 | 23d | 1 | 1.08mi |
| 2107 Elysian Fields Ave New Orleans, LA | 4.0 | 2.0 | 1794 | $1,650 | $0.92 | 3d | 1 | 1.08mi |
| 822 Perdido St Unit 1272370P New Orleans, LA | 1.0–5.0 | 1.0–5.0 | 1447 | $5,974 | $4.13 | 3d | 4 | 1.14mi |
| 431 Gravier St Ste 4 New Orleans, LA | 3.0 | 2.0 | 2100 | $3,700 | $1.76 | 44d | 1 | 1.15mi |
| 419 Carondelet St Unit PHB New Orleans, LA | 3.0 | 2.5 | 2546 | $5,700 | $2.24 | 3d | 1 | 1.16mi |
| 326 S Dorgenois St Unit 326 New Orleans, LA | 4.0 | 3.0 | 1510 | $2,300 | $1.52 | 2d | 1 | 1.17mi |
| 3024 Esplanade Ave New Orleans, LA | 3.0 | 2.5 | 2300 | $4,500 | $1.96 | 44d | 1 | 1.18mi |
| 2115 Mandeville St New Orleans, LA | 3.0 | 2.0 | 1400 | $1,650 | $1.18 | 23d | 1 | 1.19mi |
Listing history 14 events
-
2026-06-18days on market $74,000 Active 364 DOM
-
2026-06-17days on market $74,000 Active 363 DOM
-
2026-06-16days on market $74,000 Active 362 DOM
-
2026-06-15days on market $74,000 Active 361 DOM
-
2026-06-13days on market $74,000 Active 359 DOM
-
2026-06-10days on market $74,000 Active 356 DOM
-
2026-06-09days on market $74,000 Active 355 DOM
-
2026-06-08days on market $74,000 Active 354 DOM
-
2026-06-07days on market $74,000 Active 353 DOM
-
2026-06-05days on market $74,000 Active 350 DOM
-
2026-06-03days on market $74,000 Active 349 DOM
-
2026-06-02days on market $74,000 Active 348 DOM
-
2026-06-02remarks 26-char remark
-
2026-06-02$74,000 Active 347 DOM
ⓘ Source: listings_history table (triggers on properties + properties_extension) + one-shot
backfill from property_details.listing_events for pre-trigger history.
Tax reassessment forecast LA · Resets to sale price
- Current annual tax
- $545 · $45/mo
- Projected year-2 tax
- $545 · $45/mo
- Expected delta
- $0/yr ($0/mo · 0.0%)
ⓘ Screening estimate from a state-policy table — verify with the county assessor before closing.
Climate risk First Street
- Flood 8/10 Severe FEMA zone X · 60% chance over 30 yrs
- Wildfire 1/10 Low
- Heat 10/10 Extreme 7 d/yr ≥108°F today · 21 d/yr by 30 yrs out
- Wind 10/10 Extreme 99% chance of damaging wind over 30 yrs
- Air quality 4/10 Moderate 4 unhealthy d/yr today · 4 by 30 yrs out
Nearby sold comps map
Loading sold comps map…
Walkable amenities ~0.75 mi
Loading nearby amenities…
Taxation est. · year 1
- Rental income
- $38,505
- − Mortgage interest
- −$4,145
- − Property taxes
- −$545
- − Insurance
- −$1,168
- − Repairs & maintenance
- −$3,080
- − Management
- −$3,080
- − Depreciation
- −$2,153
- Taxable income
- $24,334
- Est. tax owed @ 24.0%
- −$5,840
- After-tax cash flow
- $18,210/yr
For passive investors: Depreciation is non-cash, so a rental often shows a tax loss while cash-flowing — sheltering income. Rental losses are passive: they offset passive income freely, and up to $25,000/yr can offset ordinary (W-2) income if you actively participate and your MAGI is under $100k (phasing out to $0 by $150k); unused losses carry forward. On sale, claimed depreciation is recaptured at up to 25%, and gains may owe capital-gains tax (a 1031 exchange can defer both). Figures are a year-1 estimate at your 24.0% rate — not tax advice; consult a CPA.
Schools (NCES district)
- District
- Orleans Parish
- NCES district ID
- 2201170
- Math proficiency
- 11% ▼ -52.00%
- Reading proficiency
- 27% ▼ -46.00%
- Median HH income
- $37,011
- Composite
- 15.78/100
- National rank
- #9271
- State rank
- #69 of 98 in LA
Livability — New Orleans
- Score
- 81/100
- State rank
- #3
- US rank
- #1383
Category grades
Schools grade is shown separately in the Schools card above.
Census & demographics
- Census place
- New Orleans, LA
- County
- Orleans Parish · 338,817 people
- City population
- 338,817
- Metro
- New Orleans-Metairie, LA
- Population (ZIP)
- 10,404
- Household income
- $52,306
- Rent vs Own
- Severe rent burden
- 1001.0
Population outlook (Orleans County) Hauer SSP2
- Today (2025)
- 513,025 people
- By 2030
- 575,781 · +12.2%
- By 2040
- 700,174 · +36.5%
- By 2050
- 826,541 · +61.1%
- By 2075
- 1,123,374 · +119.0%
- By 2100
- 1,355,609 · +164.2%
Race, ethnicity, and origin ACS 2023
- Neighborhood character
- Diverse neighborhood (Simpson 0.63)
- Race & ethnicity
- White 45% Black 40% Hispanic / Latino 10% Two or more races 8%
- Hispanic origin (detail)
- Mexican 1% Cuban 3%
- Common ancestry
- Lithuanian 6% Slovak 3% Romanian 3%
- Foreign-born
- 5% · Canada
- Languages at home
- 90% English-only · Spanish 6% French/Haitian/Cajun 2%
Political lean MEDSL · Orleans
- 2024 margin
- Solid D (+67.0) · D 82.2% · R 15.2% · Other 2.7%
- 2008→2024 swing
- +6.7pp toward D · 2008: 60.3pp · 2024: 67.0pp
- All cycles
- 2024: D+67.0 2020: D+68.2 2016: D+66.2 2012: D+62.5 2008: D+60.3
Not yet ingested
- Civics
- —
Market trends
- HPI YoY
- ▼ -144.83%
- Current HPI
- 275.5453
- Rent YoY
- ▲ 0.18%
- Metro
- New Orleans-Metairie, LA
- State GDP YoY
- ▲ 3.29%
- F500 in state
- 10
Industry mix (Fortune 500 HQ in LA)
| Industry | F500 HQs | Revenue |
|---|---|---|
| Telecommunications | 2 | $23B |
|
||
| Utilities | 1 | $12B |
|
||
| Wholesale / Distribution | 1 | $5B |
|
||
| Advertising | 1 | $2B |
|
||
Price history
+647.5% since first listed11 events — show timeline
- 2026-06-01 Price Changed $74,000 AcadianaMLS
- 2026-06-01 Price Changed $74,000 GSREIN
- 2025-07-07 Price Changed $79,000 AcadianaMLS
- 2025-07-07 Price Changed $79,000 GSREIN
- 2025-06-24 Price Changed $85,000 AcadianaMLS
- 2025-06-24 Price Changed $85,000 GSREIN
- 2025-06-19 Listed $92,500 GSREIN
- 2025-06-19 Listed $92,500 AcadianaMLS
- 1997-04-22 Sold (MLS) $7,000 GSREIN
- 1997-02-25 Listed $9,900 AcadianaMLS
- 1997-02-25 Listed $9,900 GSREIN
Property tax history
+20.0%/yrLatest (2026): $545 · +1.1% YoY. Source: county tax records.
Cash-flow waterfall
monthlySold comps — $/sqft
last 12 mo · ≤1 miLoading sold comps…