1024 S 3rd Ave E · Newton, IA
Flood risk 1/10 · Minimal
- FEMA flood zone
- X (unshaded)
- Chance of flooding over 30 yrs
- 0.0%
- Est. flood insurance / yr
- $507 – $1,088
Fire risk 1/10 · Minimal
- Est. fire insurance / yr
- $902 – $1,676
Heat risk 3/10 · Minor
- Hot days now (above 104°F)
- 7 days/yr
- Hot days in 30 yrs
- 15 days/yr
Wind risk 2/10 · Minimal
- Chance of severe wind over 30 yrs
- —
Air-quality risk 1/10 · Minimal
- Unhealthy air days now
- 0 days/yr
- Unhealthy air days in 30 yrs
- 0 days/yr
Risk factors via First Street. Map © Google.
Why this score? — see what drove the C- grade
The composite is a weighted blend of 9 inputs, each scored 0–100. Each bar is that input's sub-score; the figure is the points it added to the 100-point composite (weight × sub-score).
- Cash flow +16.0/30.0
- ARV discount +15.0/15.0
- Schools +5.1/10.0
- DSCR +4.9/10.0
- 1% rule +4.3/10.0
- Livability +3.9/5.0
- Rent growth +2.5/5.0
- Condition / age +2.5/5.0
- Appreciation +0.0/10.0
$87,500
🖨 Deal sheet (PDF) 📄 Offer letter ✓ Due diligence
Listing remarks
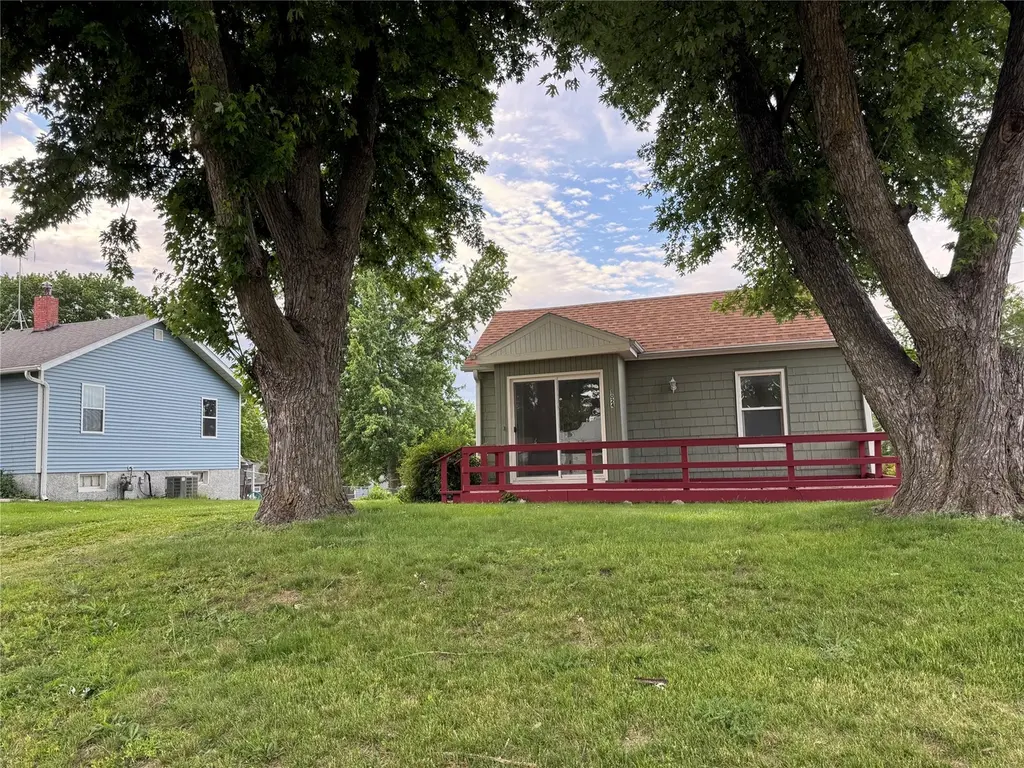
If you've been collecting cottage-core inspiration boards, dreaming of fresh flowers, garden paths, and a cozy place to call your own, this charming little home might be your perfect match. This adorable 1-bedroom cottage is packed with character and updates, including a new roof, new flooring, and a recently renovated kitchen that's ready for everything from morning coffee to ambitious pie-baking projects. Set on a large corner lot, there's plenty of room for gardening, relaxing, entertaining, or simply enjoying a little extra elbow room. Established perennial landscaping provides colorful blooms throughout the growing season and keeps the yard looking cheerful year after year. Cute, cozy,
Key facts
- Large corner lot
- New flooring
- Renovated kitchen
Tags
Property features AI
Exterior
- Utilities: Public water; Public sewer
- Home design: Wood-siding exterior
- Construction: Asphalt shingle roof; Brick/mortar and stone foundation; Built with wood siding
- Exterior features: Deck; Storage
Interior
- Kitchen: Dishwasher; Stove; Refrigerator
- Bedrooms: One main-level bedroom
- Flooring: Carpet; Vinyl
- Bathrooms: One full bathroom
- Heating & cooling: Forced air heating; Natural gas heating
- Interior features: Unfinished basement
- Laundry & utility: Washer and dryer on the main level
Neighborhood map
What this means for you Summary
Snapshot
- This is a 2-bed/1.0-bath single-family listed at $88k.
Deal economics
- At list price, monthly cash flow is $43 ($518/yr) — positive.
- The deal already cash-flows at list — no discount required.
- To meet the 1% rule (rent ≥ 1% of price), the offer needs to be $81k (6.9% below list).
- Recommended offer: $81k (6.9% below list) — sets the bar for 1% rule.
- Cap rate 6.9% vs local median 3.1% in Newton — top-decile yield for the area; either an underpriced asset or a hidden risk that comps aren't pricing in. Stress-test before assuming the spread holds.
Location & tenants
- Location reads 77/100 on livability (#169 in IA, #3,069 nationally) — a middle-class / working-renter tenant base. Strengths: cost of living A+, housing A+, health & safety A+; Watch: crime C-, employment D+, amenities F.
- Newton Community School District (town): math 59% / reading 62% proficiency, ranked #245 of 289 in IA (top 85%) — acceptable for families but not a draw, mixed tenant base, ~2y average lease.
- Market conditions: 242 active listings in the ZIP; 10 comparable units currently listed for rent nearby; rentals lingering (median 45d on market — plan ~5-8 weeks vacancy on turnover, expect pricing pressure); 60% of comp listings sitting > 30 days — soft ceiling on asking rent; 16 units permitted in Jasper County in 2024 (0 in 5+ unit buildings).
- This rent is only 16% of the median local income ($62k/yr) — well below the 30% rent-burden line; pricing power to push rent on renewal without tenant pushback.
Forward outlook
- Local home prices are declining (-3.0%/yr); year-one equity from $605 of loan paydown is wiped out by about $3k of value loss. Plan a longer hold.
- Jasper County population projected to shrink 7% by 2050 — rents likely to lag national; underwrite the cash flow, not the appreciation.
Negotiation context
- It's been on market 22 days — a 2% lower offer ($86k) is reasonable based on typical stale-listing flexibility.
- 2 sale attempts since 12y ago with the ask held roughly flat each time — persistent listings suggest the price (not the market) is what's stuck; bring a comps-based counter.
Risks & watch-outs
- Watch-outs: built in 1900 — expect roof / HVAC / electrical / plumbing capex.
Questions for the listing agent
- Built in 1900 — when were the roof, HVAC, electrical panel, plumbing, and water heater last replaced?
- Is there a deadline driving the sale (1031 exchange, divorce, estate, relocation)? That informs how much negotiation room exists.
- Schools are A-rated — typically a magnet for longer-tenancy family renters. What's the average tenant stay here, and is there a school-zone premium baked into asking?
- What's the average days-on-market for RENTAL listings here right now (not sales)? A rising rental-DOM trend means longer vacancies and softer asking-rent achievability than the comps imply.
- What's the recent tenant-quality profile in this submarket — average credit score on applications, eviction rate, late-payment / NSF rate, and stable-employment percentage? A property-management company in the area should have these aggregated.
- How much new for-sale + rental construction is in the pipeline within 1–3 miles? Heavy new supply typically softens prices + rents 12–24 months out; constrained supply supports both.
Investment metrics
- 1% rule
- 0.93% ✗
- Cap rate
- 6.88%
- Cash-on-cash
- 2.11%
- DSCR
- 1.09
- GRM
- 8.9
CMA / ARV
- ARV (on-the-fly)
- $142,740
- Comps found
- 12
Show comp detail 12 sales within ~0.75 mi
| Address | Dist | Beds/Ba | Sqft | Sold | Price | $/sf | Match |
|---|---|---|---|---|---|---|---|
| 123 E 8th St S | 0.20mi | 2/1.0 | 702 (-4%) | 8mo | $130,000 | $185 | 78 |
| 709 E 9th St S | 0.34mi | 2/1.0 | 704 (-4%) | 2mo | $145,900 | $207 | 76 |
| 314 E 14th St N | 0.39mi | 2/1.0 | 720 (-2%) | 6mo | $148,000 | $206 | 74 |
| 1108 N 6th Ave E | 0.45mi | 2/1.5 | 720 (-2%) | 1mo | $134,500 | $187 | 73 |
| 2 Bungalow Ct | 0.13mi | 2/1.0 | 816 (+12%) | 4mo | $60,000 | $74 | 72 |
| 201 E 13th St N | 0.23mi | 2/1.0 | 816 (+12%) | 0mo | $125,000 | $153 | 70 |
| 207 E 16th St N | 0.48mi | 2/1.0 | 720 (-2%) | 8mo | $160,000 | $222 | 69 |
| 408 E 21st St S | 0.72mi | 2/1.0 | 732 (0%) | 0mo | $156,000 | $213 | 66 |
| 512 E 19th St S | 0.64mi | 2/1.0 | 786 (+7%) | 1mo | $153,000 | $195 | 56 |
| 1421 N 4th Ave E | 0.45mi | 3/1.0 (+1) | 812 (+11%) | 7mo | $150,000 | $185 | 50 |
| 806 E 12th St N | 0.64mi | 3/1.0 (+1) | 792 (+8%) | 6mo | $157,000 | $198 | 46 |
| 1112 N 8th Ave E | 0.60mi | 3/1.0 (+1) | 816 (+12%) | 2mo | $140,000 | $172 | 46 |
Match score weights: distance 35% · size 25% · config 20% · recency 20%. Top-matched comps best support the ARV.
Projected returns pro-forma
-3.0% appreciation · 3.0% rent growth · sell at horizon
- IRR
- -12.9%
- Equity multiple
- 0.53×
- Total profit
- $-11,420
- Equity at exit
- $13,047
- IRR
- -3.9%
- Equity multiple
- 0.74×
- Total profit
- $-6,364
- Equity at exit
- $7,565
Cash invested: $24,500 (down + closing). Projections, not guarantees.
Landlord ↔ Tenant lean methodology
- Overall (STATE)
- 83 Strongly Landlord-Friendly
- State Iowa
- 83 Strongly Landlord-Friendly · R+6
- County
- — inherits STATE
- City
- — inherits STATE
ZIP-level market 50208
- Home prices YoY
- -14.4%
- Active inventory
- 242
- Price-to-rent
- 8.9×
Monthly cashflow live
- Estimated rent
- $815 high interval (Pro) →
- Mortgage (P&I)
- −$459
- Tax from tax record
- −$105 /mo · $1,264/yr
- Insurance
- −$36
- HOA
- −$0
- Vacancy / Maint / Mgmt
- −$171
- Net cashflow
- $43
Break-even live
Sensitivity live
| Price | -10% $93 | -5% $68 | +0% $43 | +5% $18 | +10% $-6 |
|---|---|---|---|---|---|
| Rent | -10% $-21 | -5% $11 | +0% $43 | +5% $75 | +10% $108 |
| Rate | -1.0pp $87 | -0.5pp $65 | base $43 | +0.5pp $20 | +1.0pp $-3 |
UW: 25.0% down · 7.5% · 30yr · 1.5% tax · 5.0% vac · 8.0% maint · 8.0% mgmt
Financing live
Cash to close
- Down payment
- $21,875
- Closing costs
- $2,625
- Reserves months
- —
- Total cash needed
- —
Loan-product check · same deal, 3 products live
Conventional
25% down · 7.5% · 30yr
- Down + closing
- —
- Monthly P&I
- —
- Monthly cashflow
- —
- DSCR
- —
- Eligible?
- —
Personal DTI + credit; lowest rate.
DSCR
20% down · 8.5% · 30yr
- Down + closing
- —
- Monthly P&I
- —
- Monthly cashflow
- —
- DSCR
- —
- Eligible?
- —
No personal income docs; deal must DSCR.
Hard money
10% down · 12.0% · 12mo
- Down + closing
- —
- Monthly P&I
- —
- Monthly cashflow
- —
- DSCR
- —
- Eligible?
- —
Short-term bridge; refi at stabilization.
Rent comps 10 comps
| Address | Beds | Baths | Sqft | Rent | $/sqft | DOM | Units | Dist |
|---|---|---|---|---|---|---|---|---|
| 126 E 5th St S Newton, IA | 1.0 | 1.0 | 550 | $599 | $1.09 | 24d | 1 | 0.42mi |
| 427 N 2nd Ave E Newton, IA | 1.0 | 1.0 | 575 | $599 | $1.04 | 44d | 1 | 0.47mi |
| 723 E 6th St S Newton, IA | 2.0 | 1.0 | 650 | $775 | $1.19 | 44d | 1 | 0.49mi |
| 605 E 7 1/2 St N Newton, IA | 2.0 | 1.0 | 672 | $1,200 | $1.79 | 44d | 1 | 0.50mi |
| 726 E 8th St N Newton, IA | 1.0 | 1.0 | 708 | $895 | $1.26 | 15d | 1 | 0.58mi |
| 602 E 2nd St S Newton, IA | 2.0 | 1.0 | 750 | $775 | $1.03 | 44d | 1 | 0.67mi |
| 1026 E 12th St N Newton, IA | 1.0 | 1.0 | 590 | $625 | $1.06 | 22d | 1 | 0.78mi |
| 320 W 3rd St N Unit 207 Newton, IA | 1.0 | 1.0 | 609 | $1,050 | $1.72 | 44d | 1 | 0.86mi |
| 706 S 2nd Ave W Unit 706 Newton, IA | 1.0 | 1.0 | 550 | $625 | $1.14 | 44d | 1 | 1.13mi |
| 1800 W 4th St N Newton, IA | 1.0–3.0 | 1.0–2.0 | 792 | $840 | $1.06 | 15d | 7 | 1.45mi |
Listing history 17 events
-
2026-06-21days on market $87,500 Active 22 DOM
-
2026-06-18days on market $87,500 Active 19 DOM
-
2026-06-17days on market $87,500 Active 18 DOM
-
2026-06-16days on market $87,500 Active 17 DOM
-
2026-06-15days on market $87,500 Active 16 DOM
-
2026-06-14days on market $87,500 Active 14 DOM
-
2026-06-13days on market $87,500 Active 13 DOM
-
2026-06-10days on market $87,500 Active 11 DOM
-
2026-06-09days on market $87,500 Active 10 DOM
-
2026-06-08days on market $87,500 Active 9 DOM
-
2026-06-07days on market $87,500 Active 8 DOM
-
2026-06-05days on market $87,500 Active 5 DOM
-
2026-06-03days on market $87,500 Active 4 DOM
-
2026-06-02days on market $87,500 Active 3 DOM
-
2026-06-01days on market $87,500 Active 2 DOM
-
2026-05-31remarks 699-char remark
-
2026-05-31$87,500 Active 1 DOM
ⓘ Source: listings_history table (triggers on properties + properties_extension) + one-shot
backfill from property_details.listing_events for pre-trigger history.
Tax reassessment forecast IA · Partial reset (capped growth)
- Current annual tax
- $1,264 · $105/mo
- Projected year-2 tax
- $1,319 · $110/mo
- Expected delta
- +$55/yr (+$5/mo · 4.3%)
ⓘ Screening estimate from a state-policy table — verify with the county assessor before closing.
Climate risk First Street
- Flood 1/10 Low FEMA zone X (unshaded) · 0% chance over 30 yrs
- Wildfire 1/10 Low
- Heat 3/10 Moderate 7 d/yr ≥104°F today · 15 d/yr by 30 yrs out
- Wind 2/10 Low
- Air quality 1/10 Low 0 unhealthy d/yr today · 0 by 30 yrs out
Nearby sold comps map
Loading sold comps map…
Walkable amenities ~0.75 mi
Loading nearby amenities…
Taxation est. · year 1
- Rental income
- $9,780
- − Mortgage interest
- −$4,901
- − Property taxes
- −$1,264
- − Insurance
- −$438
- − Repairs & maintenance
- −$782
- − Management
- −$782
- − Depreciation
- −$2,545
- Taxable loss
- −$934
- Est. tax savings @ 24.0%
- +$224
- After-tax cash flow
- $742/yr
For passive investors: Depreciation is non-cash, so a rental often shows a tax loss while cash-flowing — sheltering income. Rental losses are passive: they offset passive income freely, and up to $25,000/yr can offset ordinary (W-2) income if you actively participate and your MAGI is under $100k (phasing out to $0 by $150k); unused losses carry forward. On sale, claimed depreciation is recaptured at up to 25%, and gains may owe capital-gains tax (a 1031 exchange can defer both). Figures are a year-1 estimate at your 24.0% rate — not tax advice; consult a CPA.
Schools (NCES district)
- District
- Newton Community School District
- NCES district ID
- 1920610
- Math proficiency
- 59% ▼ -13.00%
- Reading proficiency
- 62% ▼ -9.00%
- Median HH income
- $46,447
- Composite
- 51.15/100
- National rank
- #1762
- State rank
- #245 of 289 in IA
Livability — Newton
- Score
- 77/100
- State rank
- #169
- US rank
- #3069
Category grades
Schools grade is shown separately in the Schools card above.
Census & demographics
- Census place
- Newton, IA
- County
- Jasper County · 20,595 people
- City population
- 20,595
- Metro
- Des Moines-West Des Moines, IA
- Population (ZIP)
- 20,595
- Household income
- $62,306
- Rent vs Own
- Severe rent burden
- 536.0
Population outlook (Jasper County) Hauer SSP2
- Today (2025)
- 36,216 people
- By 2030
- 35,730 · -1.3%
- By 2040
- 34,727 · -4.1%
- By 2050
- 33,802 · -6.7%
- By 2075
- 33,382 · -7.8%
- By 2100
- 32,761 · -9.5%
Race, ethnicity, and origin ACS 2023
- Neighborhood character
- Predominantly White (88%)
- Race & ethnicity
- White 88% Hispanic / Latino 5% Two or more races 4% Black 3%
- Common ancestry
- Iranian 8% Portuguese 3% Lithuanian 2%
- Foreign-born
- 4% · Canada
- Languages at home
- 92% English-only · Spanish 4% Arabic 2% Chinese 1%
Political lean MEDSL · Jasper
- 2024 margin
- Strong R (+27.6) · D 35.4% · R 63.0% · Other 1.5%
- 2008→2024 swing
- -35.1pp toward R · 2008: 7.5pp · 2024: -27.6pp
- All cycles
- 2024: R+27.6 2020: R+21.5 2016: R+18.4 2012: D+7.1 2008: D+7.5
Not yet ingested
- Civics
- —
Market trends
- HPI YoY
- ▼ -45.48%
- Current HPI
- 269.6454
- Rent YoY
- —
- Metro
- Des Moines-West Des Moines, IA
- State GDP YoY
- ▲ 2.48%
- F500 in state
- 4
Industry mix (Fortune 500 HQ in IA)
| Industry | F500 HQs | Revenue |
|---|---|---|
| Financial Services | 1 | $16B |
|
||
| Retail / Convenience | 1 | $15B |
|
||
Price history
+225.3% since first listed3 events — show timeline
- 2026-05-30 Listed $87,500 DMMLS
- 2014-07-30 Listing Removed — NORTHSTARMLS as Distributed by MLS Grid
- 2014-05-06 Listed $26,900 NORTHSTARMLS as Distributed by MLS Grid
Property tax history
+9.2%/yrLatest (2025): $1,264 · +27.9% YoY. Source: county tax records.
Cash-flow waterfall
monthlySold comps — $/sqft
last 12 mo · ≤1 miLoading sold comps…