36 Dallas Dr · East Hanover, PA
Flood risk 1/10 · Minimal
- FEMA flood zone
- X (unshaded)
- Chance of flooding over 30 yrs
- 0.0%
- Est. flood insurance / yr
- $473 – $860
Fire risk 2/10 · Minimal
- Est. fire insurance / yr
- $511 – $949
Heat risk 5/10 · Moderate
- Hot days now (above 100°F)
- 7 days/yr
- Hot days in 30 yrs
- 15 days/yr
Wind risk 3/10 · Minor
- Chance of severe wind over 30 yrs
- 7.0%
Air-quality risk 3/10 · Minor
- Unhealthy air days now
- 3 days/yr
- Unhealthy air days in 30 yrs
- 4 days/yr
Risk factors via First Street. Map © Google.
Why this score? — see what drove the B+ grade
The composite is a weighted blend of 9 inputs, each scored 0–100. Each bar is that input's sub-score; the figure is the points it added to the 100-point composite (weight × sub-score).
- Cash flow +30.0/30.0
- 1% rule +10.0/10.0
- DSCR +10.0/10.0
- Appreciation +10.0/10.0
- ARV discount +7.5/15.0
- Schools +4.6/10.0
- Rent growth +2.5/5.0
- Livability +2.5/5.0
- Condition / age +2.5/5.0
$49,900
🖨 Deal sheet (PDF) 📄 Offer letter ✓ Due diligence
Listing remarks MLS
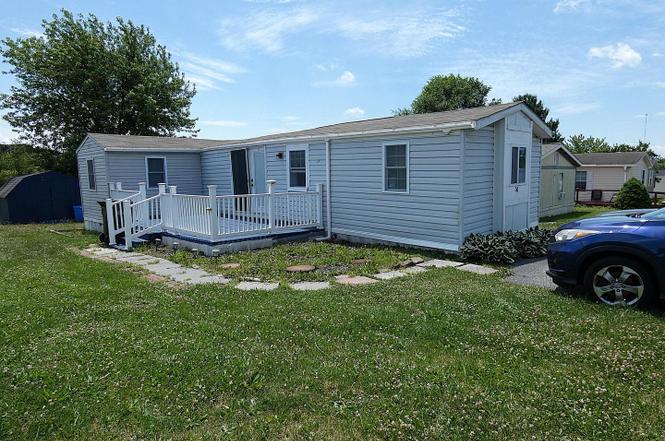
Welcome to 36 Dallas Dr. Grantville in Chesapeake Estates. This 3 bedroom 2 full bath home has a large master suite with vaulted ceilings and it's own full bath. The living space is open and bright. Wood laminate flooring throughout. The front deck measures 20 x 10. Shed stays with the property . Subject to Park approval. Property sold as is. Water, sewer and trash included in park fee. Park Lot Rent breakdown. .. $688 ground rent includes water +$67.52 Sewer +$13 Trash, +Storm water $9.63 = total a month $778.15. See Bright documents for Park Community Rules and Regulations.
Key facts
- Front deck
- Large master suite
- Vaulted ceilings
Tags
Property features AI
Finance
- Financial info: Land lease / ground rent exists (years remaining listed as 0); Annual ground rent referenced in income/expense list
- HOA & community: Located in Chesapeake Estates mobile home park; Ground rent paid annually
Exterior
- Parking: Off-street parking with two spaces (total of 2 garage/parking spaces noted)
- Utilities: Community water; Electric hot water; 100 amp electric service
- Home design: Manufactured home; Single-story (main living on one level); Estimated year built
- Construction: Frame construction; Liberty model manufactured home
- Exterior features: Deck(s); Shed; Rented lot in a community park (ground rent paid annually); Located in a non-federal flood zone; Two or more access exits
Interior
- Kitchen: Microwave; Electric oven/range
- Bedrooms: Three bedrooms on the main level
- Bathrooms: Two full bathrooms (both on the main level)
- Heating & cooling: Electric heating; Window air conditioning units
- Interior features: Dining area; Living room, kitchen, master bedroom, two additional bedrooms, master bathroom and a full hall bathroom
- Laundry & utility: Laundry room (main level)
Neighborhood map
What this means for you Summary
Snapshot
- This is a 3-bed/2.0-bath manufactured listed at $50k.
Deal economics
- At list price, monthly cash flow is $730 ($9k/yr) — positive.
- The deal already cash-flows at list — no discount required.
- Meets the 1% rule at list price ($1k rent vs $50k).
Location & tenants
- Location reads: area grade B — affects rentability + tenant quality, not the cash-flow math above.
- Lower Dauphin SD (suburban): math 45% / reading 59% proficiency, ranked #130 of 539 in PA (top 24%) — acceptable for families but not a draw, mixed tenant base, ~2y average lease; only 18% free/reduced lunch — higher-income household profile.
- Zoned schools: South Hanover El Sch (math 62% / reading 72%, grade B+, #202 of 1,518 statewide, top 15%, 385 students, 16% FRL); Lower Dauphin Ms (math 28% / reading 53%, grade F, #248 of 512 statewide, top 50%, 883 students, 27% FRL); Lower Dauphin Hs (math 82%, 1,085 students, 22% FRL) — zoned schools at 22% FRL track the district average.
- Market conditions: 18 active listings in the ZIP; 540 units permitted in Dauphin County in 2024 (194 in 5+ unit buildings).
Forward outlook
- In year one you build about $5k of equity ($345 loan paydown + $5k appreciation (10.0% local appreciation)).
- At projected returns (10.0% appreciation + 3.0% rent growth), your $14k cash investment doubles in ~1 year — after that, you're playing with house money.
- By year 6, paydown + projected appreciation supports a ~$31k cash-out refi (75% LTV) — recoverable capital for the next deal without selling this one.
Negotiation context
- Only 3 days on market — expect competitive offers; lowballing is unlikely to land.
- 3 sale attempts since 6y ago with the ask held roughly flat each time — persistent listings suggest the price (not the market) is what's stuck; bring a comps-based counter.
- Current owner paid $42k; 17% above their basis — modest negotiation headroom, anchor on the comps not their cost.
Risks & watch-outs
- Climate carrying-cost: extreme-heat days projected 7→15/yr by 2055 (HVAC capex compounding) — expect insurance premiums to compound above CPI over the hold.
Questions for the listing agent
- Is there a deadline driving the sale (1031 exchange, divorce, estate, relocation)? That informs how much negotiation room exists.
- What's the average days-on-market for RENTAL listings here right now (not sales)? A rising rental-DOM trend means longer vacancies and softer asking-rent achievability than the comps imply.
- What's the recent tenant-quality profile in this submarket — average credit score on applications, eviction rate, late-payment / NSF rate, and stable-employment percentage? A property-management company in the area should have these aggregated.
- How much new for-sale + rental construction is in the pipeline within 1–3 miles? Heavy new supply typically softens prices + rents 12–24 months out; constrained supply supports both.
Investment metrics
- 1% rule
- 2.63% ✓
- Cap rate
- 23.84%
- Cash-on-cash
- 62.68%
- DSCR
- 3.79
- GRM
- 3.2
CMA / ARV
No comps found within radius.
Projected returns pro-forma
10.0% appreciation · 3.0% rent growth · sell at horizon
- IRR
- 74.5%
- Equity multiple
- 6.27×
- Total profit
- $73,655
- Equity at exit
- $44,954
- IRR
- 68.5%
- Equity multiple
- 13.91×
- Total profit
- $180,342
- Equity at exit
- $96,945
Cash invested: $13,972 (down + closing). Projections, not guarantees.
Landlord ↔ Tenant lean methodology
- Overall (STATE)
- 62 Landlord-Friendly
- State Pennsylvania
- 62 Landlord-Friendly · EVEN
- County
- — inherits STATE
- City
- — inherits STATE
ZIP-level market 17028
- Home prices YoY
- 11.6%
- Active inventory
- 18
- Price-to-rent
- 3.2×
Monthly cashflow live
- Estimated rent
- $1,313 medium interval (Pro) →
- Mortgage (P&I)
- −$262
- Tax from tax record
- −$25 /mo · $297/yr
- Insurance
- −$21
- HOA
- −$0
- Vacancy / Maint / Mgmt
- −$276
- Net cashflow
- $730
Break-even live
Sensitivity live
| Price | -10% $758 | -5% $744 | +0% $730 | +5% $716 | +10% $702 |
|---|---|---|---|---|---|
| Rent | -10% $626 | -5% $678 | +0% $730 | +5% $782 | +10% $833 |
| Rate | -1.0pp $755 | -0.5pp $742 | base $730 | +0.5pp $717 | +1.0pp $704 |
UW: 25.0% down · 7.5% · 30yr · 1.5% tax · 5.0% vac · 8.0% maint · 8.0% mgmt
Financing live
Cash to close
- Down payment
- $12,475
- Closing costs
- $1,497
- Reserves months
- —
- Total cash needed
- —
Loan-product check · same deal, 3 products live
Conventional
25% down · 7.5% · 30yr
- Down + closing
- —
- Monthly P&I
- —
- Monthly cashflow
- —
- DSCR
- —
- Eligible?
- —
Personal DTI + credit; lowest rate.
DSCR
20% down · 8.5% · 30yr
- Down + closing
- —
- Monthly P&I
- —
- Monthly cashflow
- —
- DSCR
- —
- Eligible?
- —
No personal income docs; deal must DSCR.
Hard money
10% down · 12.0% · 12mo
- Down + closing
- —
- Monthly P&I
- —
- Monthly cashflow
- —
- DSCR
- —
- Eligible?
- —
Short-term bridge; refi at stabilization.
Listing history 3 events
-
2026-06-22days on market $49,900 Active 3 DOM
-
2026-06-19remarks 690-char remark
-
2026-06-19$49,900 Active 1 DOM
ⓘ Source: listings_history table (triggers on properties + properties_extension) + one-shot
backfill from property_details.listing_events for pre-trigger history.
Tax reassessment forecast PA · Partial reset (capped growth)
- Current annual tax
- $297 · $25/mo
- Projected year-2 tax
- $543 · $45/mo
- Expected delta
- +$246/yr (+$20/mo · 82.8%)
ⓘ Screening estimate from a state-policy table — verify with the county assessor before closing.
Climate risk First Street
- Flood 1/10 Low FEMA zone X (unshaded) · 0% chance over 30 yrs
- Wildfire 2/10 Low
- Heat 5/10 Major 7 d/yr ≥100°F today · 15 d/yr by 30 yrs out
- Wind 3/10 Moderate 7% chance of damaging wind over 30 yrs
- Air quality 3/10 Moderate 3 unhealthy d/yr today · 4 by 30 yrs out
Nearby sold comps map
Loading sold comps map…
Walkable amenities ~0.75 mi
Loading nearby amenities…
Taxation est. · year 1
- Rental income
- $15,752
- − Mortgage interest
- −$2,795
- − Property taxes
- −$297
- − Insurance
- −$250
- − Repairs & maintenance
- −$1,260
- − Management
- −$1,260
- − Depreciation
- −$1,452
- Taxable income
- $8,438
- Est. tax owed @ 24.0%
- −$2,025
- After-tax cash flow
- $6,732/yr
For passive investors: Depreciation is non-cash, so a rental often shows a tax loss while cash-flowing — sheltering income. Rental losses are passive: they offset passive income freely, and up to $25,000/yr can offset ordinary (W-2) income if you actively participate and your MAGI is under $100k (phasing out to $0 by $150k); unused losses carry forward. On sale, claimed depreciation is recaptured at up to 25%, and gains may owe capital-gains tax (a 1031 exchange can defer both). Figures are a year-1 estimate at your 24.0% rate — not tax advice; consult a CPA.
Schools (NCES district)
- District
- Lower Dauphin SD
- NCES district ID
- 4214100
- Math proficiency
- 45% ▼ -10.00%
- Reading proficiency
- 59% ▼ -13.00%
- Median HH income
- $67,760
- Composite
- 46.09/100
- National rank
- #2513
- State rank
- #130 of 539 in PA
Livability — East Hanover
No livability data for this city. (Only ~50 U.S. cities are tracked.)
Census & demographics
- Population (ZIP)
- 3,331
Population outlook (Dauphin County) Hauer SSP2
- Today (2025)
- 281,628 people
- By 2030
- 283,549 · +0.7%
- By 2040
- 285,385 · +1.3%
- By 2050
- 286,188 · +1.6%
- By 2075
- 291,053 · +3.3%
- By 2100
- 282,374 · +0.3%
Race, ethnicity, and origin ACS 2023
- Neighborhood character
- Predominantly White (90%)
- Race & ethnicity
- White 90% Two or more races 7% Hispanic / Latino 6%
- Hispanic origin (detail)
- Puerto Rican 1% Dominican 1%
- Common ancestry
- Italian 4% Serbian 3% Subsaharan African 1%
- Foreign-born
- 2% · Canada
- Languages at home
- 97% English-only · Spanish 3%
Political lean MEDSL · Dauphin
- 2024 margin
- Lean D (+5.9) · D 52.4% · R 46.5% · Other 1.1%
- 2008→2024 swing
- -3.1pp toward R · 2008: 9.1pp · 2024: 5.9pp
- All cycles
- 2024: D+5.9 2020: D+8.5 2016: D+2.8 2012: D+6.0 2008: D+9.1
Not yet ingested
- Civics
- —
Market trends
- HPI YoY
- ▲ 30.02%
- Current HPI
- 289.4564
- Rent YoY
- —
- Metro
- —
- State GDP YoY
- ▲ 1.68%
- F500 in state
- 34
Industry mix (Fortune 500 HQ in PA)
| Industry | F500 HQs | Revenue |
|---|---|---|
| Healthcare | 2 | $309B |
|
||
| Insurance | 2 | $27B |
|
||
| Telecommunications / Media | 1 | $124B |
|
||
| Industrial Distribution | 1 | $22B |
|
||
| Financial Services | 1 | $20B |
|
||
| Chemicals / Materials | 1 | $18B |
|
||
Price history
+137.6% since first listed13 events — show timeline
- 2026-06-18 Listed $49,900 BRIGHT MLS
- 2025-01-17 Sold (MLS) $42,500 BRIGHT MLS
- 2024-12-05 Pending — BRIGHT MLS
- 2024-09-19 Listed $45,000 BRIGHT MLS
- 2021-02-24 Pending — BRIGHT MLS
- 2021-02-22 Sold (MLS) $23,000 BRIGHT MLS
- 2021-02-22 Sold (MLS) $23,000 BRIGHT MLS
- 2021-01-27 Pending — BRIGHT MLS
- 2021-01-14 Price Changed $25,500 BRIGHT MLS
- 2020-12-11 Price Changed $33,000 BRIGHT MLS
- 2020-11-17 Listed $35,999 BRIGHT MLS
- 1996-07-24 Sold (Public Records) $19,900 Public Records
- 1988-10-12 Sold (Public Records) $21,000 Public Records
Property tax history
+1.7%/yrLatest (2026): $297 · +6.0% YoY. Source: county tax records.
Cash-flow waterfall
monthlySold comps — $/sqft
last 12 mo · ≤1 miLoading sold comps…