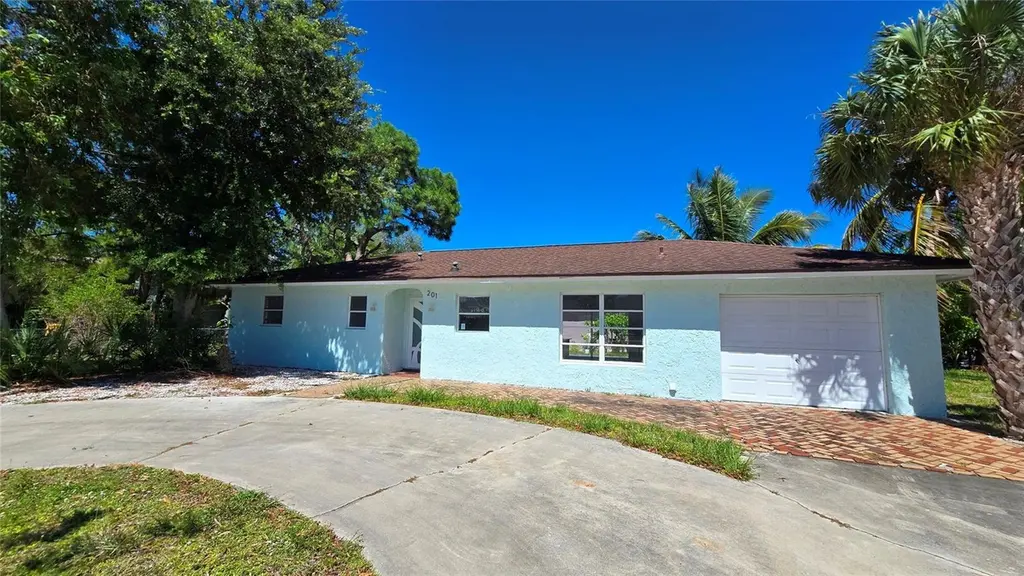
201 Marco Lake Dr · Marco Island, FL
Flood risk 9/10 · Severe
- FEMA flood zone
- AE
- Chance of flooding over 30 yrs
- 0.99%
- Est. flood insurance / yr
- $1,737 – $8,500
Fire risk 3/10 · Minor
- Est. fire insurance / yr
- $947 – $1,759
Heat risk 10/10 · Severe
- Hot days now (above 107°F)
- 7 days/yr
- Hot days in 30 yrs
- 30 days/yr
Wind risk 10/10 · Severe
- Chance of severe wind over 30 yrs
- 99.0%
Air-quality risk 3/10 · Minor
- Unhealthy air days now
- 3 days/yr
- Unhealthy air days in 30 yrs
- 3 days/yr
Risk factors via First Street. Map © Google.
Why this score? — see what drove the C+ grade
The composite is a weighted blend of 9 inputs, each scored 0–100. Each bar is that input's sub-score; the figure is the points it added to the 100-point composite (weight × sub-score).
- Cash flow +24.5/30.0
- DSCR +7.9/10.0
- ARV discount +7.5/15.0
- 1% rule +5.6/10.0
- Schools +5.0/10.0
- Rent growth +4.1/5.0
- Livability +3.6/5.0
- Condition / age +2.5/5.0
- Appreciation +0.0/10.0
$435,000
🖨 Deal sheet (PDF) 📄 Offer letter ✓ Due diligence
Listing remarks MLS
Welcome to the spectacular community of Marco Island. Just minutes from the heart of the city and the best restaurants in town, you could not hope for a better location. Enjoy a 4 minute drive to the Esplanade Shoppes at Marco Island where you can shop, eat, relax or wander. If you prefer to cook at home, take a left instead and visit Winn-Dixie or the Italian Market. There are also several highly rated restaurants you could walk to. This adorable 2 bedroom home with a spacious den and 2 baths is waiting for your finishing touches. White cabinetry and vinyl plank flooring are the foundation, you get to finish the vision. Bring your Pinterest Board to life and make this the home you've been waiting for in a location far better than you hoped for. If you prefer, this would be an outstanding vacation rental. Guests will appreciate the easy to navigate city with quick access to Bald Eagle Drive, N Collier and N Barfield. It's only an 8 minute drive to the famous Tigertail Beach and your guests will have an outstanding chance of seeing gopher tortoises and burrowing owls on the drive over.
Key facts
- 7,841 sq ft lot
- Garage
- Built 1975
Property features AI
Finance
- Other: Zoning: RSF-4
- HOA & community: No association listed; Development: Not Assigned
Exterior
- Parking: Circular driveway; Driveway; Attached garage (1-car)
- Utilities: Public water; Public sewer; Electricity connected; Water connected; Sewer connected
- Home design: Single-family residence; One story; Faces south; Residential property
- Construction: Shingle roof; Other construction materials; Concrete perimeter foundation; Built on a 0.18-acre lot (approx. 68 x 120)
- Exterior features: Patio; Landscaped lot; Paved surfaces
Interior
- Kitchen: Dishwasher; Range
- Bedrooms: 2 bedrooms
- Flooring: Laminate flooring; Tile flooring
- Bathrooms: 2 full bathrooms
- Heating & cooling: Electric heating; Central air conditioning
- Interior features: Ceiling fans
- Laundry & utility: No laundry in home (none listed)
Neighborhood map
What this means for you Summary
Snapshot
- This is a 2-bed/2.0-bath single-family listed at $435k.
Deal economics
- At list price, monthly cash flow is $466 ($6k/yr) — positive.
- The deal already cash-flows at list — no discount required.
- Meets the 1% rule at list price ($5k rent vs $435k).
- Recommended offer: $422k (3.0% below list) — sets the bar for market timing.
Location & tenants
- Location reads 71/100 on livability (#404 in FL) — a middle-class / working-renter tenant base. Strengths: crime A+, employment A+, health & safety A+; Watch: amenities F, commute F, cost of living F.
- Collier (suburban): math 60% / reading 56% proficiency, ranked #16 of 73 in FL (top 22%) — acceptable for families but not a draw, mixed tenant base, ~2y average lease.
- Market conditions: Rents rising fast (+6.6%/yr); 687 active listings in the ZIP; 37 comparable units currently listed for rent nearby; rentals at typical pace (median 24d on market — plan ~3-4 weeks tenant-placement turnaround); solid renter incomes; 3,520 units permitted in Collier County in 2024 (959 in 5+ unit buildings).
- At $4,600/mo this rent would consume 54% of the median local household income ($102k/yr) (locally 314% of renters already pay >50% of income on rent) — very limited rent-growth headroom before tenants either downsize or default.
Forward outlook
- Local home prices are declining (-3.0%/yr); year-one equity from $3k of loan paydown is wiped out by about $13k of value loss. Plan a longer hold.
- Collier County population projected at +30% by 2050 — long-run rental-demand tailwind backs the buy-and-hold thesis.
- At projected returns (-3.0% appreciation + 6.6% rent growth), your $122k cash investment doubles in ~10 years — after that, you're playing with house money.
Negotiation context
- It's been on market 35 days — a 3% lower offer ($422k) is reasonable based on typical stale-listing flexibility.
- 8 sale attempts since 3y ago with the ask held roughly flat each time — persistent listings suggest the price (not the market) is what's stuck; bring a comps-based counter.
Risks & watch-outs
- Watch-outs: flood insurance adds $427/mo.
- Climate carrying-cost: in FEMA flood zone AE (mandatory federal flood insurance); severe wind risk, 99% chance of damaging wind over 30y; extreme-heat days projected 7→30/yr by 2055 (HVAC capex compounding) — expect insurance premiums to compound above CPI over the hold.
Questions for the listing agent
- It's been on market 35 days. Have you received any prior offers? Is the seller open to a 3% concession, seller financing, or rate buy-down credit?
- Built in 1975 — when were the roof, HVAC, electrical panel, plumbing, and water heater last replaced?
- What's the actual annual flood-insurance premium (NFIP or private), and is the property in a SFHA with mandatory coverage?
- Is there a deadline driving the sale (1031 exchange, divorce, estate, relocation)? That informs how much negotiation room exists.
- Schools are A-rated — typically a magnet for longer-tenancy family renters. What's the average tenant stay here, and is there a school-zone premium baked into asking?
- What's the average days-on-market for RENTAL listings here right now (not sales)? A rising rental-DOM trend means longer vacancies and softer asking-rent achievability than the comps imply.
- What's the recent tenant-quality profile in this submarket — average credit score on applications, eviction rate, late-payment / NSF rate, and stable-employment percentage? A property-management company in the area should have these aggregated.
- How much new for-sale + rental construction is in the pipeline within 1–3 miles? Heavy new supply typically softens prices + rents 12–24 months out; constrained supply supports both.
Investment metrics
- 1% rule
- 1.06% ✓
- Cap rate
- 8.76%
- Cash-on-cash
- 8.80%
- DSCR
- 1.39
- GRM
- 7.9
CMA / ARV
No comps found within radius.
Projected returns pro-forma
-3.0% appreciation · 6.59% rent growth · sell at horizon
- IRR
- -5.0%
- Equity multiple
- 0.81×
- Total profit
- $-23,404
- Equity at exit
- $64,860
- IRR
- 8.7%
- Equity multiple
- 1.78×
- Total profit
- $94,606
- Equity at exit
- $37,611
Cash invested: $121,800 (down + closing). Projections, not guarantees.
Landlord ↔ Tenant lean methodology
- Overall (STATE)
- 87 Strongly Landlord-Friendly
- State Florida
- 87 Strongly Landlord-Friendly · R+3
- County
- — inherits STATE
- City
- — inherits STATE
ZIP-level market 34145
- Rents YoY
- 6.6%
- Active inventory
- 687
- Price-to-rent
- 7.9×
Monthly cashflow live
- Estimated rent
- $4,600 medium interval (Pro) →
- Mortgage (P&I)
- −$2,281
- Tax from tax record
- −$278 /mo · $3,340/yr
- Insurance
- −$181
- Flood insurance flood zone
- −$427 /mo · $5,118/yr
- HOA
- −$0
- Vacancy / Maint / Mgmt
- −$966
- Net cashflow
- $466
Break-even live
Sensitivity live
| Price | -10% $713 | -5% $590 | +0% $466 | +5% $343 | +10% $220 |
|---|---|---|---|---|---|
| Rent | -10% $103 | -5% $285 | +0% $466 | +5% $648 | +10% $830 |
| Rate | -1.0pp $685 | -0.5pp $577 | base $466 | +0.5pp $354 | +1.0pp $239 |
UW: 25.0% down · 7.5% · 30yr · 1.5% tax · 5.0% vac · 8.0% maint · 8.0% mgmt
Financing live
Cash to close
- Down payment
- $108,750
- Closing costs
- $13,050
- Reserves months
- —
- Total cash needed
- —
Loan-product check · same deal, 3 products live
Conventional
25% down · 7.5% · 30yr
- Down + closing
- —
- Monthly P&I
- —
- Monthly cashflow
- —
- DSCR
- —
- Eligible?
- —
Personal DTI + credit; lowest rate.
DSCR
20% down · 8.5% · 30yr
- Down + closing
- —
- Monthly P&I
- —
- Monthly cashflow
- —
- DSCR
- —
- Eligible?
- —
No personal income docs; deal must DSCR.
Hard money
10% down · 12.0% · 12mo
- Down + closing
- —
- Monthly P&I
- —
- Monthly cashflow
- —
- DSCR
- —
- Eligible?
- —
Short-term bridge; refi at stabilization.
Rent comps 37 comps
| Address | Beds | Baths | Sqft | Rent | $/sqft | DOM | Units | Dist |
|---|---|---|---|---|---|---|---|---|
| 1080 N Collier Blvd Unit 308 Marco Island, FL | 2.0 | 2.0 | 1300 | $13,400 | $10.31 | 24d | 1 | 0.36mi |
| 324 Waterleaf Ct Marco Island, FL | 3.0 | 2.0 | 1288 | $13,500 | $10.48 | 24d | 1 | 0.49mi |
| 694 W Elkcam Cir #1123 Marco Island, FL | 2.0 | 2.0 | 945 | $2,530 | $2.68 | 24d | 1 | 0.58mi |
| 731 W Elkcam Cir Unit A109 Marco Island, FL | 2.0 | 2.5 | 1066 | $2,500 | $2.35 | 24d | 1 | 0.59mi |
| 651 W Elkcam Cir #815 Marco Island, FL | 2.0 | 2.0 | 813 | $4,700 | $5.78 | 24d | 1 | 0.61mi |
| 740 N Collier Blvd #408 Marco Island, FL | 2.0 | 2.0 | 1400 | $6,000 | $4.29 | 24d | 1 | 0.62mi |
| 761 W Elkcam Cir Unit B110 Marco Island, FL | 2.0 | 2.5 | 1066 | $3,500 | $3.28 | 24d | 1 | 0.63mi |
| 750 W Elkcam Cir #315 Marco Island, FL | 2.0 | 2.0 | 990 | $5,600 | $5.66 | 24d | 1 | 0.67mi |
| 991 N Barfield Dr #401 Marco Island, FL | 2.0 | 2.0 | 1396 | $9,000 | $6.45 | 24d | 1 | 0.77mi |
| 167 N Collier Blvd Marco Island, FL | 2.0 | 1.0 | 555 | $2,100 | $3.78 | 14d | 2 | 1.02mi |
| 651 Seaview Ct Unit B207 Marco Island, FL | 2.0 | 2.0 | 1075 | $6,000 | $5.58 | 24d | 1 | 1.05mi |
| 601 Seaview Ct Unit C208 Marco Island, FL | 2.0 | 2.0 | 1170 | $6,800 | $5.81 | 24d | 1 | 1.09mi |
| 601 Seaview Ct Unit C106 Marco Island, FL | 2.0 | 2.0 | 964 | $5,700 | $5.91 | 24d | 1 | 1.09mi |
| 69 Marco Villas E Unit 1546079P Marco Island, FL | 2.0 | 1.0 | 1151 | $3,122 | $2.71 | 14d | 1 | 1.11mi |
| 591 Seaview Ct Unit A306 Marco Island, FL | 2.0 | 2.0 | 964 | $6,000 | $6.22 | 24d | 1 | 1.11mi |
| 130 N Collier Blvd Unit A6 Marco Island, FL | 2.0 | 1.0 | 704 | $1,900 | $2.70 | 24d | 1 | 1.11mi |
| 87 N Collier Blvd Unit J16 Marco Island, FL | 2.0 | 1.5 | 787 | $5,550 | $7.05 | 14d | 1 | 1.13mi |
| 68 Marco Villas Dr Unit R-5 Marco Island, FL | 2.0 | 2.5 | 1046 | $4,750 | $4.54 | 24d | 1 | 1.14mi |
| 87 N Collier Blvd Marco Island, FL | 1.0–2.0 | 1.0–1.5 | 663 | $5,550 | $8.36 | 24d | 3 | 1.15mi |
| 240 Seaview Ct #413 Marco Island, FL | 1.0 | 1.0 | 750 | $6,500 | $8.67 | 24d | 1 | 1.18mi |
| 146 Clyburn St Unit I-6 Marco Island, FL | 2.0 | 2.5 | 1046 | $2,000 | $1.91 | 24d | 1 | 1.19mi |
| 140 Seaview Ct Unit 902S Marco Island, FL | 2.0 | 2.0 | 837 | $9,000 | $10.75 | 24d | 1 | 1.19mi |
| 762 San Marco Rd Unit 4-108 Marco Island, FL | 2.0 | 2.0 | 814 | $4,500 | $5.53 | 24d | 1 | 1.20mi |
| 240 Seaview Ct #211 Marco Island, FL | 2.0 | 2.0 | 1075 | $11,000 | $10.23 | 21d | 1 | 1.20mi |
| 260 Seaview Ct #404 Marco Island, FL | 2.0 | 2.0 | 1132 | $5,995 | $5.30 | 14d | 1 | 1.20mi |
| 260 Seaview Ct #1505 Marco Island, FL | 2.0 | 2.0 | 1166 | $8,500 | $7.29 | 24d | 1 | 1.20mi |
| 260 Seaview Ct #604 Marco Island, FL | 2.0 | 2.0 | 1070 | $8,000 | $7.48 | 14d | 1 | 1.20mi |
| 320 Seaview Ct #2004 Marco Island, FL | 2.0 | 2.0 | 1132 | $8,000 | $7.07 | 24d | 1 | 1.22mi |
| 320 Seaview Ct #1208 Marco Island, FL | 2.0 | 2.0 | 1154 | $10,000 | $8.67 | 24d | 1 | 1.22mi |
| 380 Seaview Ct #305 Marco Island, FL | 2.0 | 2.0 | 1100 | $6,000 | $5.45 | 14d | 1 | 1.23mi |
| 180 Seaview Ct Marco Island, FL | 1.0–2.0 | 1.5–2.0 | 721 | $4,500 | $6.24 | 24d | 2 | 1.23mi |
| 1533 San Marco Rd Marco Island, FL | 2.0 | 2.0 | 1189 | $7,500 | $6.31 | 24d | 1 | 1.25mi |
| 100 N Collier Blvd Marco Island, FL | 2.0 | 2.0 | 1445 | $11,750 | $8.13 | 24d | 2 | 1.25mi |
| 440 Seaview Ct #912 Marco Island, FL | 2.0 | 2.0 | 1099 | $6,500 | $5.91 | 14d | 1 | 1.27mi |
| 58 N Collier Blvd Marco Island, FL | 2.0 | 2.0 | 1071 | $9,750 | $9.10 | 24d | 2 | 1.27mi |
| 201 S Collier Blvd Unit 3-102 Marco Island, FL | 2.0 | 2.0 | 808 | $5,500 | $6.81 | 24d | 1 | 1.36mi |
| 261 S Collier Blvd #309 Marco Island, FL | 2.0 | 2.0 | 1000 | $6,200 | $6.20 | 24d | 1 | 1.42mi |
Listing history 45 events
-
2026-06-18days on market $435,000 Active 35 DOM
-
2026-06-17pricedays on market $435,000 Active 34 DOM
-
2026-06-16days on market $450,000 Active 33 DOM
-
2026-06-15days on market $450,000 Active 32 DOM
-
2026-06-14days on market $450,000 Active 30 DOM
-
2026-06-10days on market $450,000 Active 27 DOM
-
2026-06-09days on market $450,000 Active 26 DOM
-
2026-06-08days on market $450,000 Active 25 DOM
-
2026-06-07days on market $450,000 Active 24 DOM
-
2026-06-03days on market $450,000 Active 20 DOM
-
2026-06-02days on market $450,000 Active 19 DOM
-
2026-06-01days on market $450,000 Active 18 DOM
-
2026-05-31days on market $450,000 Active 17 DOM
-
2026-05-30days on market $450,000 Active 16 DOM
-
2026-05-14$450,000 Active
-
2026-05-13$450,000 Active 1102-char remark
Show marketing remark (1102 chars)
Welcome to the spectacular community of Marco Island. Just minutes from the heart of the city and the best restaurants in town, you could not hope for a better location. Enjoy a 4 minute drive to the Esplanade Shoppes at Marco Island where you can shop, eat, relax or wander. If you prefer to cook at home, take a left instead and visit Winn-Dixie or the Italian Market. There are also several highly rated restaurants you could walk to. This adorable 2 bedroom home with a spacious den and 2 baths is waiting for your finishing touches. White cabinetry and vinyl plank flooring are the foundation, you get to finish the vision. Bring your Pinterest Board to life and make this the home you've been waiting for in a location far better than you hoped for. If you prefer, this would be an outstanding vacation rental. Guests will appreciate the easy to navigate city with quick access to Bald Eagle Drive, N Collier and N Barfield. It's only an 8 minute drive to the famous Tigertail Beach and your guests will have an outstanding chance of seeing gopher tortoises and burrowing owls on the drive over.
-
2026-05-12historical
-
2026-04-29price $450,000
-
2026-03-31status Active
-
2026-02-18status Pending With Contingencies
-
2026-01-23price $475,000
-
2025-12-22$500,000 Active
-
2024-12-19historical
-
2024-12-18price $553,000
-
2024-12-09price $554,000
-
2024-11-27price $555,000
-
2024-11-23status Active
-
2024-11-18status Pending
-
2024-11-15price $559,000
-
2024-10-31price $570,000
-
2024-10-27price $571,000
-
2024-10-15price $572,000
-
2024-10-04price $573,000
-
2024-10-01price $574,000
-
2024-09-25price $575,000
-
2024-09-11price $595,000
-
2024-08-30$659,000 Active
-
2023-10-18soldstatus $450,000
-
2023-10-13soldstatus $450,000 Closed
-
2023-10-13soldstatus $450,000 Sold
-
2023-09-25status Pending With Contingencies
-
2023-08-25status Pending
-
2023-08-25status Pending
-
2023-08-17$494,000 Active
-
2023-08-16$494,000 Active
ⓘ Source: listings_history table (triggers on properties + properties_extension) + one-shot
backfill from property_details.listing_events for pre-trigger history.
Tax reassessment forecast FL · Resets to sale price
- Current annual tax
- $3,340 · $278/mo
- Projected year-2 tax
- $3,610 · $301/mo
- Expected delta
- +$270/yr (+$23/mo · 8.1%)
ⓘ Screening estimate from a state-policy table — verify with the county assessor before closing.
Climate risk First Street
- Flood 9/10 Extreme FEMA zone AE · 99% chance over 30 yrs
- Wildfire 3/10 Moderate
- Heat 10/10 Extreme 7 d/yr ≥107°F today · 30 d/yr by 30 yrs out
- Wind 10/10 Extreme 99% chance of damaging wind over 30 yrs
- Air quality 3/10 Moderate 3 unhealthy d/yr today · 3 by 30 yrs out
Nearby sold comps map
Loading sold comps map…
Walkable amenities ~0.75 mi
Loading nearby amenities…
Taxation est. · year 1
- Rental income
- $55,196
- − Mortgage interest
- −$24,367
- − Property taxes
- −$3,340
- − Insurance
- −$7,294
- − Repairs & maintenance
- −$4,416
- − Management
- −$4,416
- − Depreciation
- −$12,655
- Taxable loss
- −$1,291
- Est. tax savings @ 24.0%
- +$310
- After-tax cash flow
- $5,906/yr
For passive investors: Depreciation is non-cash, so a rental often shows a tax loss while cash-flowing — sheltering income. Rental losses are passive: they offset passive income freely, and up to $25,000/yr can offset ordinary (W-2) income if you actively participate and your MAGI is under $100k (phasing out to $0 by $150k); unused losses carry forward. On sale, claimed depreciation is recaptured at up to 25%, and gains may owe capital-gains tax (a 1031 exchange can defer both). Figures are a year-1 estimate at your 24.0% rate — not tax advice; consult a CPA.
Schools (NCES district)
- District
- Collier
- NCES district ID
- 1200330
- Math proficiency
- 60% ▼ -4.00%
- Reading proficiency
- 56% ▼ -2.00%
- Median HH income
- $58,275
- Composite
- 50.23/100
- National rank
- #1892
- State rank
- #16 of 73 in FL
Livability — Marco Island
- Score
- 71/100
- State rank
- #404
- US rank
- #7149
Category grades
Schools grade is shown separately in the Schools card above.
Census & demographics
- Census place
- Marco Island, FL
- County
- Collier County · 396,295 people
- City population
- 16,205
- Metro
- Naples-Marco Island, FL
- Population (ZIP)
- 16,205
- Household income
- $101,523
- Rent vs Own
- Severe rent burden
- 314.0
Population outlook (Collier County) Hauer SSP2
- Today (2025)
- 420,858 people
- By 2030
- 450,054 · +6.9%
- By 2040
- 502,232 · +19.3%
- By 2050
- 544,932 · +29.5%
- By 2075
- 627,203 · +49.0%
- By 2100
- 659,015 · +56.6%
Race, ethnicity, and origin ACS 2023
- Neighborhood character
- Predominantly White (90%)
- Race & ethnicity
- White 90% Hispanic / Latino 7% Two or more races 6%
- Hispanic origin (detail)
- Mexican 1% Puerto Rican 1% Cuban 2%
- Common ancestry
- Romanian 5% Lithuanian 2% Slovak 2%
- Foreign-born
- 9% · Canada
- Languages at home
- 90% English-only · Spanish 5% Other Indo-European 1% German/W. Germanic 1%
Political lean MEDSL · Collier
- 2024 margin
- Solid R (+33.1) · D 33.1% · R 66.2%
- 2008→2024 swing
- -10.6pp toward R · 2008: -22.5pp · 2024: -33.1pp
- All cycles
- 2024: R+33.1 2020: R+24.7 2016: R+26.0 2012: R+30.1 2008: R+22.5
Not yet ingested
- Civics
- —
Market trends
- HPI YoY
- ▼ -374.55%
- Current HPI
- 284.7538
- Rent YoY
- ▲ 6.59%
- Metro
- Naples-Marco Island, FL
- State GDP YoY
- ▲ 3.28%
- F500 in state
- 36
Industry mix (Fortune 500 HQ in FL)
| Industry | F500 HQs | Revenue |
|---|---|---|
| Industrial Technology | 2 | $29B |
|
||
| Insurance | 2 | $17B |
|
||
| Retail | 1 | $60B |
|
||
| Technology Distribution | 1 | $58B |
|
||
| Homebuilding | 1 | $35B |
|
||
| Technology Manufacturing | 1 | $35B |
|
||
Price history
-8.9% since first listed31 events — show timeline
- 2026-05-14 Listed $450,000 Stellar MLS as Distributed by MLS Grid
- 2026-05-13 Listed $450,000 FORTMLS
- 2026-05-12 Listing Removed — NAPLESMLS
- 2026-04-29 Price Changed $450,000 NAPLESMLS
- 2026-03-31 Relisted — NAPLESMLS
- 2026-02-18 Pending — NAPLESMLS
- 2026-01-23 Price Changed $475,000 NAPLESMLS
- 2025-12-22 Listed $500,000 NAPLESMLS
- 2024-12-19 Listing Removed — NAPLESMLS
- 2024-12-18 Price Changed $553,000 NAPLESMLS
- 2024-12-09 Price Changed $554,000 NAPLESMLS
- 2024-11-27 Price Changed $555,000 NAPLESMLS
- 2024-11-23 Relisted — NAPLESMLS
- 2024-11-18 Pending — NAPLESMLS
- 2024-11-15 Price Changed $559,000 NAPLESMLS
- 2024-10-31 Price Changed $570,000 NAPLESMLS
- 2024-10-27 Price Changed $571,000 NAPLESMLS
- 2024-10-15 Price Changed $572,000 NAPLESMLS
- 2024-10-04 Price Changed $573,000 NAPLESMLS
- 2024-10-01 Price Changed $574,000 NAPLESMLS
- 2024-09-25 Price Changed $575,000 NAPLESMLS
- 2024-09-11 Price Changed $595,000 NAPLESMLS
- 2024-08-30 Listed $659,000 NAPLESMLS
- 2023-10-18 Sold (Public Records) $450,000 Public Records
- 2023-10-13 Sold (MLS) $450,000 NAPLESMLS
- 2023-10-13 Sold (MLS) $450,000 MIML
- 2023-09-25 Pending — NAPLESMLS
- 2023-08-25 Pending — NAPLESMLS
- 2023-08-25 Pending — MIML
- 2023-08-17 Listed $494,000 NAPLESMLS
- 2023-08-16 Listed $494,000 MIML
Property tax history
+19.3%/yrLatest (2025): $3,340 · -1.1% YoY. Source: county tax records.
Cash-flow waterfall
monthlySold comps — $/sqft
last 12 mo · ≤1 miLoading sold comps…