 Duplex
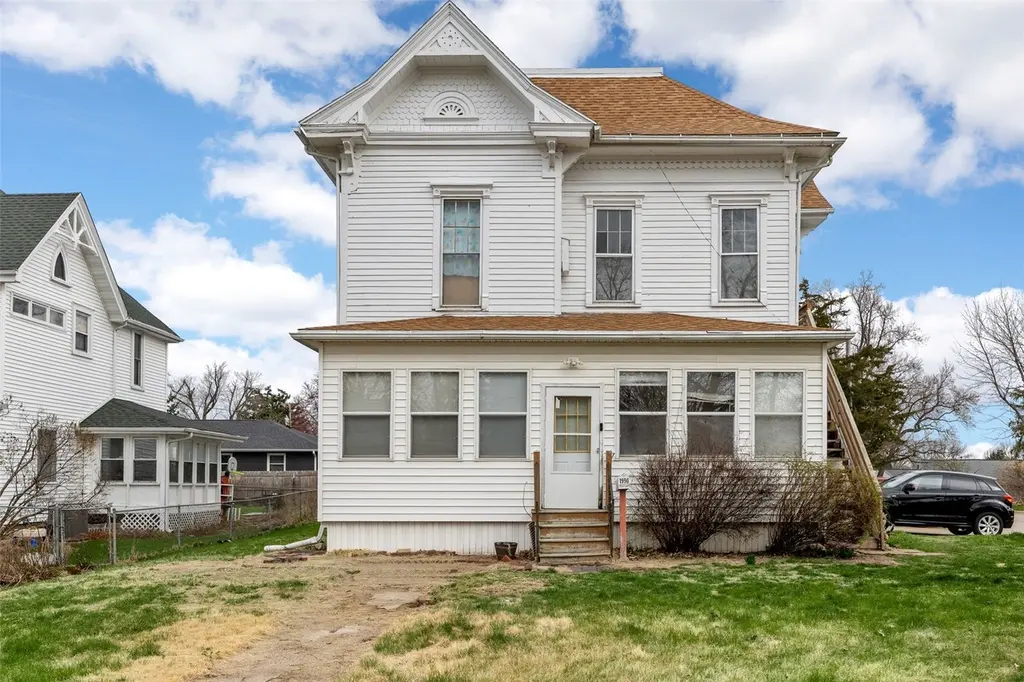
1990 8th Ave · Marion, IA
Flood risk 1/10 · Minimal
- FEMA flood zone
- X (unshaded)
- Chance of flooding over 30 yrs
- 0.0%
- Est. flood insurance / yr
- $473 – $860
Fire risk 2/10 · Minimal
- Est. fire insurance / yr
- $902 – $1,676
Heat risk 3/10 · Minor
- Hot days now (above 104°F)
- 7 days/yr
- Hot days in 30 yrs
- 15 days/yr
Wind risk 2/10 · Minimal
- Chance of severe wind over 30 yrs
- —
Air-quality risk 2/10 · Minimal
- Unhealthy air days now
- 1 days/yr
- Unhealthy air days in 30 yrs
- 2 days/yr
Risk factors via First Street. Map © Google.
Why this score? — see what drove the B- grade
The composite is a weighted blend of 9 inputs, each scored 0–100. Each bar is that input's sub-score; the figure is the points it added to the 100-point composite (weight × sub-score).
- Cash flow +30.0/30.0
- DSCR +10.0/10.0
- 1% rule +9.8/10.0
- Schools +5.8/10.0
- Rent growth +4.6/5.0
- Livability +4.2/5.0
- Condition / age +2.5/5.0
- ARV discount +0.0/15.0
- Appreciation +0.0/10.0
$230,000
🖨 Deal sheet (PDF) 📄 Offer letter ✓ Due diligence
Multi-family units
County records classify this as Multi-Family (2-4 Unit). Listing-text estimate: 2 units. confirmed
Listing remarks MLS
Located in the heart of Marion’s historic district, this charming turn-of-the-century duplex offers character, space, and strong income potential. Conveniently situated near uptown Marion, local shops, and community amenities, this property is ideally positioned for both tenants and investors alike. The upper and lower units each offer 3 bedrooms and 1 bathroom, providing spacious layouts that comfortably accommodate individuals, couples, or families. With tenants already in place, this is an excellent turnkey opportunity for an investor seeking immediate rental income. Whether you are looking to expand your portfolio or secure a well-located income-producing property, this duplex is one you will want to see. Please allow 24 hours notice to show, tenants rights.
Key facts
- 8,886 sq ft lot
- 4 parking spots
- Built 1900
Neighborhood map
What this means for you Summary
Snapshot
- This is a 2 × 3-bed/1-bath units multifamily listed at $230k.
Deal economics
- At list price, monthly cash flow is $1k ($13k/yr) — positive. Per door: $542/mo.
- The deal already cash-flows at list — no discount required.
- Meets the 1% rule at list price ($3k rent vs $230k).
- Recommended offer: $216k (6.0% below list) — sets the bar for market timing.
- Cap rate 12.0% vs local median 2.7% in Marion — top-decile yield for the area; either an underpriced asset or a hidden risk that comps aren't pricing in. Stress-test before assuming the spread holds.
Location & tenants
- Location reads 84/100 on livability (#19 in IA, #633 nationally) — a professional / high-income tenant draw. Strengths: schools A+, crime A+, cost of living A+; Watch: amenities D-, commute F.
- Marion Independent School District (suburban): math 68% / reading 70% proficiency, ranked #158 of 289 in IA (top 55%) — acceptable for families but not a draw, mixed tenant base, ~2y average lease.
- Market conditions: Rents rising fast (+8.4%/yr); 455 active listings in the ZIP; 1 comparable units currently listed for rent nearby; solid renter incomes; 1,023 units permitted in Linn County in 2024 (456 in 5+ unit buildings).
- At $3,405/mo this rent would consume 46% of the median local household income ($88k/yr) (locally 940% of renters already pay >50% of income on rent) — very limited rent-growth headroom before tenants either downsize or default.
Forward outlook
- Local home prices are declining (-3.0%/yr); year-one equity from $2k of loan paydown is wiped out by about $7k of value loss. Plan a longer hold.
- Linn County population projected at +16% by 2050 — long-run rental-demand tailwind backs the buy-and-hold thesis.
- At projected returns (-3.0% appreciation + 8.0% rent growth), your $64k cash investment doubles in ~5 years — after that, you're playing with house money.
Negotiation context
- It's been on market 78 days — a 6% lower offer ($216k) is reasonable based on typical stale-listing flexibility.
- 10 sale attempts since 8y ago with the ask held roughly flat each time — persistent listings suggest the price (not the market) is what's stuck; bring a comps-based counter.
- Current owner paid $200k; 15% above their basis — modest negotiation headroom, anchor on the comps not their cost.
Risks & watch-outs
- Watch-outs: built in 1900 — expect roof / HVAC / electrical / plumbing capex.
Questions for the listing agent
- It's been on market 78 days. Have you received any prior offers? Is the seller open to a 6% concession, seller financing, or rate buy-down credit?
- Can we see the unit-by-unit rent roll, current vacancy, and any below-market leases? What's the average tenancy length?
- What capital expenditures (roof, boiler, parking lot, exteriors) have been made in the last 5 years, and what's planned in the next 2?
- Built in 1900 — when were the roof, HVAC, electrical panel, plumbing, and water heater last replaced?
- Why hasn't it sold? Are there any deal-killer items the seller is aware of (foundation, flood, title, zoning, code violations)?
- Is there a deadline driving the sale (1031 exchange, divorce, estate, relocation)? That informs how much negotiation room exists.
- Schools are A-rated — typically a magnet for longer-tenancy family renters. What's the average tenant stay here, and is there a school-zone premium baked into asking?
- What's the average days-on-market for RENTAL listings here right now (not sales)? A rising rental-DOM trend means longer vacancies and softer asking-rent achievability than the comps imply.
- What's the recent tenant-quality profile in this submarket — average credit score on applications, eviction rate, late-payment / NSF rate, and stable-employment percentage? A property-management company in the area should have these aggregated.
- How much new apartment / multifamily construction is in the pipeline within 1–3 miles? Heavy new supply (>2% of stock underway) typically softens rents 12–24 months out; light construction supports rent growth.
Investment metrics
- 1% rule
- 1.48% ✓
- Cap rate
- 11.95%
- Cash-on-cash
- 20.21%
- DSCR
- 1.90
- GRM
- 5.6
CMA / ARV
- ARV (median comp)
- $188,817
- List price
- $230,000
- Delta
- 21.81%
- Verdict
- OVERPRICED
- Comps
- 9 within 1.0 mi
Projected returns pro-forma
-3.0% appreciation · 8.0% rent growth · sell at horizon
- IRR
- 18.0%
- Equity multiple
- 1.77×
- Total profit
- $49,867
- Equity at exit
- $34,294
- IRR
- 29.8%
- Equity multiple
- 4.33×
- Total profit
- $214,526
- Equity at exit
- $19,886
Cash invested: $64,400 (down + closing). Projections, not guarantees.
Landlord ↔ Tenant lean methodology
- Overall (STATE)
- 83 Strongly Landlord-Friendly
- State Iowa
- 83 Strongly Landlord-Friendly · R+6
- County
- — inherits STATE
- City
- — inherits STATE
ZIP-level market 52302
- Rents YoY
- 8.4%
- Active inventory
- 455
- Price-to-rent
- 11.3×
Monthly cashflow live
- Estimated rent
- $3,405 high interval (Pro) →
- Mortgage (P&I)
- −$1,206
- Tax from tax record
- −$303 /mo · $3,640/yr
- Insurance
- −$96
- HOA
- −$0
- Vacancy / Maint / Mgmt
- −$715
- Net cashflow
- $1,085
Break-even live
Sensitivity live
| Price | -10% $1,215 | -5% $1,150 | +0% $1,085 | +5% $1,020 | +10% $954 |
|---|---|---|---|---|---|
| Rent | -10% $816 | -5% $950 | +0% $1,085 | +5% $1,219 | +10% $1,354 |
| Rate | -1.0pp $1,200 | -0.5pp $1,143 | base $1,085 | +0.5pp $1,025 | +1.0pp $964 |
2-unit breakdown (identical units grouped — click to expand)
| Units | Beds | Baths | Est. rent |
|---|---|---|---|
| 2× units | 3 | 1 | $3,404 |
| #1 | 3 | 1 | $1,702 |
| #2 | 3 | 1 | $1,702 |
| Total (2 units) | $3,405 | ||
UW: 25.0% down · 7.5% · 30yr · 1.5% tax · 5.0% vac · 8.0% maint · 8.0% mgmt
Financing live
Cash to close
- Down payment
- $57,500
- Closing costs
- $6,900
- Reserves months
- —
- Total cash needed
- —
Loan-product check · same deal, 3 products live
Conventional
25% down · 7.5% · 30yr
- Down + closing
- —
- Monthly P&I
- —
- Monthly cashflow
- —
- DSCR
- —
- Eligible?
- —
Personal DTI + credit; lowest rate.
DSCR
20% down · 8.5% · 30yr
- Down + closing
- —
- Monthly P&I
- —
- Monthly cashflow
- —
- DSCR
- —
- Eligible?
- —
No personal income docs; deal must DSCR.
Hard money
10% down · 12.0% · 12mo
- Down + closing
- —
- Monthly P&I
- —
- Monthly cashflow
- —
- DSCR
- —
- Eligible?
- —
Short-term bridge; refi at stabilization.
Rent comps 1 comps
| Address | Beds | Baths | Sqft | Rent | $/sqft | DOM | Units | Dist |
|---|---|---|---|---|---|---|---|---|
| 2785 Ridgeview Way Marion, IA | 3.0 | 1.5 | 2015 | $1,650 | $0.82 | 14d | 1 | 1.18mi |
Listing history 37 events
-
2026-06-19days on market $230,000 Active 78 DOM
-
2026-06-18days on market $230,000 Active 77 DOM
-
2026-06-17days on market $230,000 Active 76 DOM
-
2026-06-16price $230,000 Active 75 DOM
-
2026-06-16days on market $235,000 Active 75 DOM
-
2026-06-15days on market $235,000 Active 74 DOM
-
2026-06-14days on market $235,000 Active 72 DOM
-
2026-06-13days on market $235,000 Active 71 DOM
-
2026-06-10days on market $235,000 Active 69 DOM
-
2026-06-09days on market $235,000 Active 68 DOM
-
2026-06-08days on market $235,000 Active 67 DOM
-
2026-06-07days on market $235,000 Active 66 DOM
-
2026-06-03days on market $235,000 Active 62 DOM
-
2026-06-02days on market $235,000 Active 61 DOM
-
2026-06-01days on market $235,000 Active 60 DOM
-
2026-05-31days on market $235,000 Active 59 DOM
-
2026-05-30days on market $235,000 Active 58 DOM
-
2026-04-27price $235,000 778-char remark
Show marketing remark (778 chars)
Located in the heart of Marion’s historic district, this charming turn-of-the-century duplex offers character, space, and strong income potential. Conveniently situated near uptown Marion, local shops, and community amenities, this property is ideally positioned for both tenants and investors alike. The upper and lower units each offer 3 bedrooms and 1 bathroom, providing spacious layouts that comfortably accommodate individuals, couples, or families. With tenants already in place, this is an excellent turnkey opportunity for an investor seeking immediate rental income. Whether you are looking to expand your portfolio or secure a well-located income-producing property, this duplex is one you will want to see. Please allow 24 hours notice to show, tenants rights.
-
2026-04-02$240,000 Active 778-char remark
Show marketing remark (778 chars)
Located in the heart of Marion’s historic district, this charming turn-of-the-century duplex offers character, space, and strong income potential. Conveniently situated near uptown Marion, local shops, and community amenities, this property is ideally positioned for both tenants and investors alike. The upper and lower units each offer 3 bedrooms and 1 bathroom, providing spacious layouts that comfortably accommodate individuals, couples, or families. With tenants already in place, this is an excellent turnkey opportunity for an investor seeking immediate rental income. Whether you are looking to expand your portfolio or secure a well-located income-producing property, this duplex is one you will want to see. Please allow 24 hours notice to show, tenants rights.
-
2023-11-10price $210,000
-
2023-10-06$220,000 Active
-
2023-09-05price $205,000
-
2023-09-05price $205,000
-
2023-08-30status Active
-
2023-08-22historical
-
2023-08-09status Active
-
2023-08-09price $209,900
-
2023-08-04historical
-
2023-06-13$220,000 Active
-
2023-06-13$220,000 Active
-
2022-03-28soldstatus $200,000
-
2022-03-15soldstatus $200,000
-
2021-11-08$210,000
-
2021-11-08$210,000
-
2018-10-10soldstatus $95,000
-
2018-06-29$114,500
-
2018-06-29$114,500
ⓘ Source: listings_history table (triggers on properties + properties_extension) + one-shot
backfill from property_details.listing_events for pre-trigger history.
Tax reassessment forecast IA · Partial reset (capped growth)
- Current annual tax
- $3,640 · $303/mo
- Projected year-2 tax
- $3,640 · $303/mo
- Expected delta
- $0/yr ($0/mo · 0.0%)
ⓘ Screening estimate from a state-policy table — verify with the county assessor before closing.
Climate risk First Street
- Flood 1/10 Low FEMA zone X (unshaded) · 0% chance over 30 yrs
- Wildfire 2/10 Low
- Heat 3/10 Moderate 7 d/yr ≥104°F today · 15 d/yr by 30 yrs out
- Wind 2/10 Low
- Air quality 2/10 Low 1 unhealthy d/yr today · 2 by 30 yrs out
Nearby sold comps map
Loading sold comps map…
Walkable amenities ~0.75 mi
Loading nearby amenities…
Taxation est. · year 1
- Rental income
- $40,860
- − Mortgage interest
- −$12,884
- − Property taxes
- −$3,640
- − Insurance
- −$1,150
- − Repairs & maintenance
- −$3,269
- − Management
- −$3,269
- − Depreciation
- −$6,691
- Taxable income
- $9,958
- Est. tax owed @ 24.0%
- −$2,390
- After-tax cash flow
- $10,626/yr
For passive investors: Depreciation is non-cash, so a rental often shows a tax loss while cash-flowing — sheltering income. Rental losses are passive: they offset passive income freely, and up to $25,000/yr can offset ordinary (W-2) income if you actively participate and your MAGI is under $100k (phasing out to $0 by $150k); unused losses carry forward. On sale, claimed depreciation is recaptured at up to 25%, and gains may owe capital-gains tax (a 1031 exchange can defer both). Figures are a year-1 estimate at your 24.0% rate — not tax advice; consult a CPA.
Schools (NCES district)
- District
- Marion Independent School District
- NCES district ID
- 1918690
- Math proficiency
- 68% ▼ -6.00%
- Reading proficiency
- 70% ▲ 2.00%
- Median HH income
- $49,541
- Composite
- 58.49/100
- National rank
- #997
- State rank
- #158 of 289 in IA
Livability — Marion
- Score
- 84/100
- State rank
- #19
- US rank
- #633
Category grades
Schools grade is shown separately in the Schools card above.
Census & demographics
- Census place
- Marion, IA
- County
- Linn County · 179,860 people
- City population
- 42,706
- Metro
- Cedar Rapids, IA
- Population (ZIP)
- 42,706
- Household income
- $87,983
- Rent vs Own
- Severe rent burden
- 940.0
Population outlook (Linn County) Hauer SSP2
- Today (2025)
- 239,589 people
- By 2030
- 248,587 · +3.8%
- By 2040
- 264,817 · +10.5%
- By 2050
- 278,685 · +16.3%
- By 2075
- 311,754 · +30.1%
- By 2100
- 336,773 · +40.6%
Race, ethnicity, and origin ACS 2023
- Neighborhood character
- Predominantly White (89%)
- Race & ethnicity
- White 89% Two or more races 4% Hispanic / Latino 3% Black 3% Asian 2%
- Common ancestry
- Portuguese 6% Iranian 3% Slovak 2%
- Foreign-born
- 3% · Canada
- Languages at home
- 96% English-only · Spanish 1% Other Indo-European 1%
Political lean MEDSL · Linn
- 2024 margin
- Lean D (+9.9) · D 54.2% · R 44.3% · Other 1.4%
- 2008→2024 swing
- -11.6pp toward R · 2008: 21.5pp · 2024: 9.9pp
- All cycles
- 2024: D+9.9 2020: D+13.7 2016: D+9.0 2012: D+17.6 2008: D+21.5
Not yet ingested
- Civics
- —
Market trends
- HPI YoY
- ▼ -144.98%
- Current HPI
- 199.2949
- Rent YoY
- ▲ 8.37%
- Metro
- Cedar Rapids, IA
- State GDP YoY
- ▲ 2.48%
- F500 in state
- 4
Industry mix (Fortune 500 HQ in IA)
| Industry | F500 HQs | Revenue |
|---|---|---|
| Financial Services | 1 | $16B |
|
||
| Retail / Convenience | 1 | $15B |
|
||
Price history
+105.2% since first listed20 events — show timeline
- 2026-04-27 Price Changed $235,000 CRAAR, CDRMLS
- 2026-04-02 Listed $240,000 CRAAR, CDRMLS
- 2023-11-10 Price Changed $210,000 CRAAR, CDRMLS
- 2023-10-06 Listed $220,000 CRAAR, CDRMLS
- 2023-09-05 Price Changed $205,000 ICAARMLS
- 2023-09-05 Price Changed $205,000 CRAAR, CDRMLS
- 2023-08-30 Relisted — ICAARMLS
- 2023-08-22 Delisted — ICAARMLS
- 2023-08-09 Relisted — CRAAR, CDRMLS
- 2023-08-09 Price Changed $209,900 CRAAR, CDRMLS
- 2023-08-04 Delisted — CRAAR, CDRMLS
- 2023-06-13 Listed $220,000 ICAARMLS
- 2023-06-13 Listed $220,000 CRAAR, CDRMLS
- 2022-03-28 Sold (Public Records) $200,000 Public Records
- 2022-03-15 Sold (MLS) $200,000 CRAAR, CDRMLS
- 2021-11-08 Listed $210,000 CRAAR, CDRMLS
- 2021-11-08 Listed $210,000 CRAAR, CDRMLS
- 2018-10-10 Sold (MLS) $95,000 CRAAR, CDRMLS
- 2018-06-29 Listed $114,500 CRAAR, CDRMLS
- 2018-06-29 Listed $114,500 CRAAR, CDRMLS
Property tax history
+4.8%/yrLatest (2025): $3,640 · +2.8% YoY. Source: county tax records.
Cash-flow waterfall
monthlySold comps — $/sqft
last 12 mo · ≤1 miLoading sold comps…