 🏷️ Likely Rental
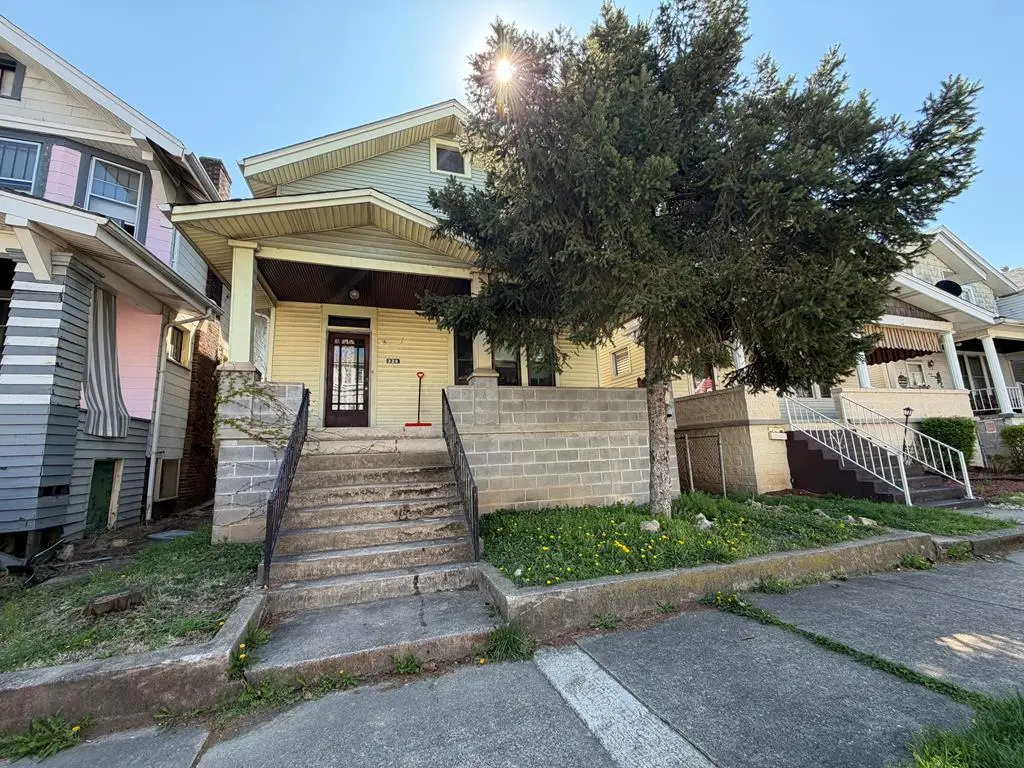
320 North Huron St · Wheeling, WV
Flood risk 10/10 · Severe
- FEMA flood zone
- AE
- Chance of flooding over 30 yrs
- 0.99%
- Est. flood insurance / yr
- $2,026 – $9,024
Fire risk 1/10 · Minimal
- Est. fire insurance / yr
- $787 – $1,461
Heat risk 4/10 · Minor
- Hot days now (above 98°F)
- 8 days/yr
- Hot days in 30 yrs
- 21 days/yr
Wind risk 1/10 · Minimal
- Chance of severe wind over 30 yrs
- —
Air-quality risk 2/10 · Minimal
- Unhealthy air days now
- 1 days/yr
- Unhealthy air days in 30 yrs
- 2 days/yr
Risk factors via First Street. Map © Google.
Why this score? — see what drove the B+ grade
The composite is a weighted blend of 9 inputs, each scored 0–100. Each bar is that input's sub-score; the figure is the points it added to the 100-point composite (weight × sub-score).
- Cash flow +30.0/30.0
- ARV discount +15.0/15.0
- 1% rule +10.0/10.0
- DSCR +10.0/10.0
- Schools +3.5/10.0
- Livability +3.5/5.0
- Rent growth +3.3/5.0
- Condition / age +2.5/5.0
- Appreciation +0.0/10.0
$45,000
🖨 Deal sheet (PDF) 📄 Offer letter ✓ Due diligence
Listing remarks MLS
Great investment opportunity or affordable home! This tenant-occupied property offers a strong rental history and immediate income potential. The second floor features 3 bedrooms and 1 full bath, while the main level includes a spacious living room, dining room, sunroom, and a well-sized kitchen. Outside, enjoy a level, fenced yard and a 2-car garage. Conveniently located close to many amenities, this property is a solid addition to any portfolio or a great option for an affordable home.
Key facts
- Tenant occupied
- Dining room
- Spacious living room
Tags
Neighborhood map
What this means for you Summary
Snapshot
- This is a 3-bed/1.0-bath single-family listed at $45k.
Deal economics
- At list price, monthly cash flow is $363 ($4k/yr) — positive.
- The deal already cash-flows at list — no discount required.
- Meets the 1% rule at list price ($1k rent vs $45k).
- Recommended offer: $42k (6.0% below list) — sets the bar for market timing.
- Cap rate 28.3% vs local median 4.3% in Wheeling — top-decile yield for the area; either an underpriced asset or a hidden risk that comps aren't pricing in. Stress-test before assuming the spread holds.
Location & tenants
- Location reads 69/100 on livability (#74 in WV) — a middle-class / working-renter tenant base. Strengths: cost of living A+, housing A+, health & safety A-; Watch: crime F, amenities F, commute F.
- Ohio County Schools (urban): math 34% / reading 49% proficiency, ranked #5 of 55 in WV (top 9%) — families likely to look elsewhere, expect single-tenant / working-renter base with shorter leases.
- Zoned schools: Madison Elementary School (math 32% / reading 37%, grade F, #148 of 377 statewide, top 49%, 277 students, 0% FRL); Triadelphia Middle School (math 34% / reading 56%, grade D, #9 of 109 statewide, top 7%, 390 students, 0% FRL); Wheeling Park High School (math 27% / reading 57%, grade F, #14 of 110 statewide, top 16%, 1,490 students, 0% FRL) — zoned schools average 0% FRL vs 44% district-wide (44 pts lower); this property's tenant base skews higher-income than the district average.
- Market conditions: Rents rising (+3.0%/yr); 228 active listings in the ZIP; 2 comparable units currently listed for rent nearby; 2 units permitted in Ohio County in 2024 (0 in 5+ unit buildings).
Forward outlook
- Local home prices are declining (-3.0%/yr); year-one equity from $311 of loan paydown is wiped out by about $1k of value loss. Plan a longer hold.
- Ohio County population projected at -17% by 2050 — secular population decline; favor cash flow + early exit over multi-decade hold.
- At projected returns (-3.0% appreciation + 3.0% rent growth), your $13k cash investment doubles in ~4 years — after that, you're playing with house money.
Negotiation context
- It's been on market 69 days — a 6% lower offer ($42k) is reasonable based on typical stale-listing flexibility.
- 2 sale attempts since 8y ago; this cycle's ask has dropped $4k (8%) from the opening price — seller is motivated, your offer sets the floor, not the list.
- Current owner paid $35k; 29% above their basis — modest negotiation headroom, anchor on the comps not their cost.
Risks & watch-outs
- Watch-outs: flood insurance adds $460/mo; built in 1922 — expect roof / HVAC / electrical / plumbing capex.
- Climate carrying-cost: in FEMA flood zone AE (mandatory federal flood insurance) — expect insurance premiums to compound above CPI over the hold.
Questions for the listing agent
- It's been on market 69 days. Have you received any prior offers? Is the seller open to a 6% concession, seller financing, or rate buy-down credit?
- Built in 1922 — when were the roof, HVAC, electrical panel, plumbing, and water heater last replaced?
- What's the actual annual flood-insurance premium (NFIP or private), and is the property in a SFHA with mandatory coverage?
- Why hasn't it sold? Are there any deal-killer items the seller is aware of (foundation, flood, title, zoning, code violations)?
- Is there a deadline driving the sale (1031 exchange, divorce, estate, relocation)? That informs how much negotiation room exists.
- Schools are B-rated — typically a magnet for longer-tenancy family renters. What's the average tenant stay here, and is there a school-zone premium baked into asking?
- Crime grade is F in this area — have there been break-ins, vandalism, or insurance claims at this property in the last 3 years? What carrier currently insures it and at what premium?
- What's the average days-on-market for RENTAL listings here right now (not sales)? A rising rental-DOM trend means longer vacancies and softer asking-rent achievability than the comps imply.
- What's the recent tenant-quality profile in this submarket — average credit score on applications, eviction rate, late-payment / NSF rate, and stable-employment percentage? A property-management company in the area should have these aggregated.
- How much new for-sale + rental construction is in the pipeline within 1–3 miles? Heavy new supply typically softens prices + rents 12–24 months out; constrained supply supports both.
Investment metrics
- 1% rule
- 3.27% ✓
- Cap rate
- 28.25%
- Cash-on-cash
- 78.42%
- DSCR
- 4.49
- GRM
- 2.6
CMA / ARV
- ARV (median comp)
- $68,228
- List price
- $45,000
- Delta
- -34.04%
- Verdict
- UNDERPRICED
- Comps
- 20 within 1.0 mi
Show comp detail 12 sales within ~0.75 mi
| Address | Dist | Beds/Ba | Sqft | Sold | Price | $/sf | Match |
|---|---|---|---|---|---|---|---|
| 220 N Wabash St | 0.09mi | 3/1.5 | 1,376 (-5%) | 12mo | $18,000 | $13 | 75 |
| 705 N Front St | 0.34mi | 3/1.0 | 1,536 (+6%) | 2mo | $13,500 | $9 | 72 |
| 428 North Erie St | 0.15mi | 2/1.5 (-1) | 1,344 (-7%) | 2mo | $75,500 | $56 | 72 |
| 71 Indiana St | 0.11mi | 2/1.5 (-1) | 1,470 (+1%) | 17mo | $43,000 | $29 | 71 |
| 416 North Erie St | 0.13mi | 3/2.0 | 1,513 (+4%) | 15mo | $40,000 | $26 | 71 |
| 723 N Front St | 0.40mi | 3/1.0 | 1,420 (-2%) | 9mo | $85,000 | $60 | 70 |
| 626 North Front St | 0.32mi | 3/1.5 | 1,343 (-8%) | 12mo | $125,000 | $93 | 61 |
| 502 N Front St | 0.21mi | 3/1.5 | 1,247 (-14%) | 12mo | $90,000 | $72 | 55 |
| 1408 Ascension St | 0.73mi | 3/1.0 | 1,472 (+1%) | 16mo | $51,500 | $35 | 51 |
| 225 Jacquette St | 0.73mi | 3/2.0 | 1,356 (-7%) | 1mo | $65,000 | $48 | 50 |
| 718 N Front St | 0.38mi | 2/2.0 (-1) | 1,290 (-11%) | 11mo | $106,000 | $82 | 45 |
| 405 South Broadway St | 0.59mi | 2/1.0 (-1) | 1,600 (+10%) | 13mo | $65,000 | $41 | 39 |
Match score weights: distance 35% · size 25% · config 20% · recency 20%. Top-matched comps best support the ARV.
Projected returns pro-forma
-3.0% appreciation · 3.03% rent growth · sell at horizon
- IRR
- 30.5%
- Equity multiple
- 2.29×
- Total profit
- $16,195
- Equity at exit
- $6,710
- IRR
- 38.0%
- Equity multiple
- 4.60×
- Total profit
- $45,364
- Equity at exit
- $3,891
Cash invested: $12,600 (down + closing). Projections, not guarantees.
Landlord ↔ Tenant lean methodology
- Overall (STATE)
- 83 Strongly Landlord-Friendly
- State West Virginia
- 83 Strongly Landlord-Friendly · R+22
- County
- — inherits STATE
- City
- — inherits STATE
ZIP-level market 26003
- Home prices YoY
- -23.4%
- Rents YoY
- 3.0%
- Active inventory
- 228
- Price-to-rent
- 2.6×
Monthly cashflow live
- Estimated rent
- $1,470 medium interval (Pro) →
- Mortgage (P&I)
- −$236
- Tax from tax record
- −$83 /mo · $1,000/yr
- Insurance
- −$19
- Flood insurance flood zone
- −$460 /mo · $5,525/yr
- HOA
- −$0
- Vacancy / Maint / Mgmt
- −$309
- Net cashflow
- $363
Break-even live
Sensitivity live
| Price | -10% $388 | -5% $376 | +0% $363 | +5% $350 | +10% $338 |
|---|---|---|---|---|---|
| Rent | -10% $247 | -5% $305 | +0% $363 | +5% $421 | +10% $479 |
| Rate | -1.0pp $386 | -0.5pp $374 | base $363 | +0.5pp $351 | +1.0pp $339 |
UW: 25.0% down · 7.5% · 30yr · 1.5% tax · 5.0% vac · 8.0% maint · 8.0% mgmt
Financing live
Cash to close
- Down payment
- $11,250
- Closing costs
- $1,350
- Reserves months
- —
- Total cash needed
- —
Loan-product check · same deal, 3 products live
Conventional
25% down · 7.5% · 30yr
- Down + closing
- —
- Monthly P&I
- —
- Monthly cashflow
- —
- DSCR
- —
- Eligible?
- —
Personal DTI + credit; lowest rate.
DSCR
20% down · 8.5% · 30yr
- Down + closing
- —
- Monthly P&I
- —
- Monthly cashflow
- —
- DSCR
- —
- Eligible?
- —
No personal income docs; deal must DSCR.
Hard money
10% down · 12.0% · 12mo
- Down + closing
- —
- Monthly P&I
- —
- Monthly cashflow
- —
- DSCR
- —
- Eligible?
- —
Short-term bridge; refi at stabilization.
Rent comps 2 comps
| Address | Beds | Baths | Sqft | Rent | $/sqft | DOM | Units | Dist |
|---|---|---|---|---|---|---|---|---|
| 614 N Front St Wheeling, WV | 2.0 | 1.0 | 1000 | $1,500 | $1.50 | 45d | 1 | 0.28mi |
| 2 16th St Wheeling, WV | 1.0–3.0 | 1.0–2.0 | 1000 | $17,100 | $17.10 | 45d | 1 | 1.04mi |
Listing history 21 events
-
2026-06-21days on market $45,000 Active 69 DOM
-
2026-06-19days on market $45,000 Active 67 DOM
-
2026-06-18days on market $45,000 Active 66 DOM
-
2026-06-17days on market $45,000 Active 65 DOM
-
2026-06-16days on market $45,000 Active 64 DOM
-
2026-06-15days on market $45,000 Active 63 DOM
-
2026-06-14days on market $45,000 Active 61 DOM
-
2026-06-12days on market $45,000 Active 60 DOM
-
2026-06-09days on market $45,000 Active 57 DOM
-
2026-06-08days on market $45,000 Active 56 DOM
-
2026-06-07pricedays on market $45,000 Active 55 DOM
-
2026-06-05days on market $49,000 Active 52 DOM
-
2026-06-03days on market $49,000 Active 51 DOM
-
2026-06-02days on market $49,000 Active 50 DOM
-
2026-06-01days on market $49,000 Active 49 DOM
-
2026-05-31days on market $49,000 Active 48 DOM
-
2026-05-30days on market $49,000 Active 47 DOM
-
2026-04-13$49,000 Active 492-char remark
Show marketing remark (492 chars)
Great investment opportunity or affordable home! This tenant-occupied property offers a strong rental history and immediate income potential. The second floor features 3 bedrooms and 1 full bath, while the main level includes a spacious living room, dining room, sunroom, and a well-sized kitchen. Outside, enjoy a level, fenced yard and a 2-car garage. Conveniently located close to many amenities, this property is a solid addition to any portfolio or a great option for an affordable home.
-
2018-06-09soldstatus $35,000 113-char remark
Show marketing remark (113 chars)
This 3 bedroom home is located on Wheeling Island. This home has Hardwood floors, detached garage, and much more.
-
2018-06-08soldstatus $35,000
-
2018-04-26$49,900 113-char remark
Show marketing remark (113 chars)
This 3 bedroom home is located on Wheeling Island. This home has Hardwood floors, detached garage, and much more.
ⓘ Source: listings_history table (triggers on properties + properties_extension) + one-shot
backfill from property_details.listing_events for pre-trigger history.
Tax reassessment forecast WV · Resets to sale price
- Current annual tax
- $1,000 · $83/mo
- Projected year-2 tax
- $1,000 · $83/mo
- Expected delta
- $0/yr ($0/mo · 0.0%)
ⓘ Screening estimate from a state-policy table — verify with the county assessor before closing.
Climate risk First Street
- Flood 10/10 Extreme FEMA zone AE · 99% chance over 30 yrs
- Wildfire 1/10 Low
- Heat 4/10 Moderate 8 d/yr ≥98°F today · 21 d/yr by 30 yrs out
- Wind 1/10 Low
- Air quality 2/10 Low 1 unhealthy d/yr today · 2 by 30 yrs out
Nearby sold comps map
Loading sold comps map…
Walkable amenities ~0.75 mi
Loading nearby amenities…
Taxation est. · year 1
- Rental income
- $17,643
- − Mortgage interest
- −$2,521
- − Property taxes
- −$1,000
- − Insurance
- −$5,750
- − Repairs & maintenance
- −$1,411
- − Management
- −$1,411
- − Depreciation
- −$1,309
- Taxable income
- $4,240
- Est. tax owed @ 24.0%
- −$1,018
- After-tax cash flow
- $3,339/yr
For passive investors: Depreciation is non-cash, so a rental often shows a tax loss while cash-flowing — sheltering income. Rental losses are passive: they offset passive income freely, and up to $25,000/yr can offset ordinary (W-2) income if you actively participate and your MAGI is under $100k (phasing out to $0 by $150k); unused losses carry forward. On sale, claimed depreciation is recaptured at up to 25%, and gains may owe capital-gains tax (a 1031 exchange can defer both). Figures are a year-1 estimate at your 24.0% rate — not tax advice; consult a CPA.
Schools (NCES district)
- District
- Ohio County Schools
- NCES district ID
- 5401050
- Math proficiency
- 34% ▼ -9.00%
- Reading proficiency
- 49% ▼ -6.00%
- Median HH income
- $41,572
- Composite
- 34.88/100
- National rank
- #5085
- State rank
- #5 of 55 in WV
Livability — Wheeling
- Score
- 69/100
- State rank
- #74
- US rank
- #8950
Category grades
Schools grade is shown separately in the Schools card above.
Census & demographics
- Census place
- Wheeling, WV
- County
- Ohio County · 39,982 people
- City population
- 39,982
- Metro
- Wheeling, WV-OH
- Population (ZIP)
- 39,982
- Household income
- $57,703
- Rent vs Own
- Severe rent burden
- 1630.0
Population outlook (Ohio County) Hauer SSP2
- Today (2025)
- 40,604 people
- By 2030
- 39,150 · -3.6%
- By 2040
- 36,039 · -11.2%
- By 2050
- 33,582 · -17.3%
- By 2075
- 28,662 · -29.4%
- By 2100
- 22,963 · -43.4%
Race, ethnicity, and origin ACS 2023
- Neighborhood character
- Predominantly White (90%)
- Race & ethnicity
- White 90% Two or more races 6% Black 3% Hispanic / Latino 2%
- Common ancestry
- Romanian 6% Serbian 3% Slovak 2%
- Foreign-born
- 3% · Canada
- Languages at home
- 97% English-only · Other Indo-European 1% Spanish 1% German/W. Germanic 1%
Political lean MEDSL · Ohio
- 2024 margin
- Strong R (+26.0) · D 36.0% · R 62.0% · Other 2.0%
- 2008→2024 swing
- -15.3pp toward R · 2008: -10.8pp · 2024: -26.0pp
- All cycles
- 2024: R+26.0 2020: R+25.8 2016: R+31.6 2012: R+22.5 2008: R+10.8
Not yet ingested
- Civics
- —
Market trends
- HPI YoY
- ▼ -68.09%
- Current HPI
- 223.4106
- Rent YoY
- ▲ 3.03%
- Metro
- Wheeling, WV-OH
- State GDP YoY
- —
- F500 in state
- 0
Price history
-1.8% since first listed4 events — show timeline
- 2026-04-13 Listed $49,000 WBOR
- 2018-06-09 Sold (MLS) $35,000 WBOR
- 2018-06-08 Sold (Public Records) $35,000 Public Records
- 2018-04-26 Listed $49,900 WBOR
Property tax history
+22.4%/yrLatest (2025): $1,000 · +4.4% YoY. Source: county tax records.
Cash-flow waterfall
monthlySold comps — $/sqft
last 12 mo · ≤1 miLoading sold comps…