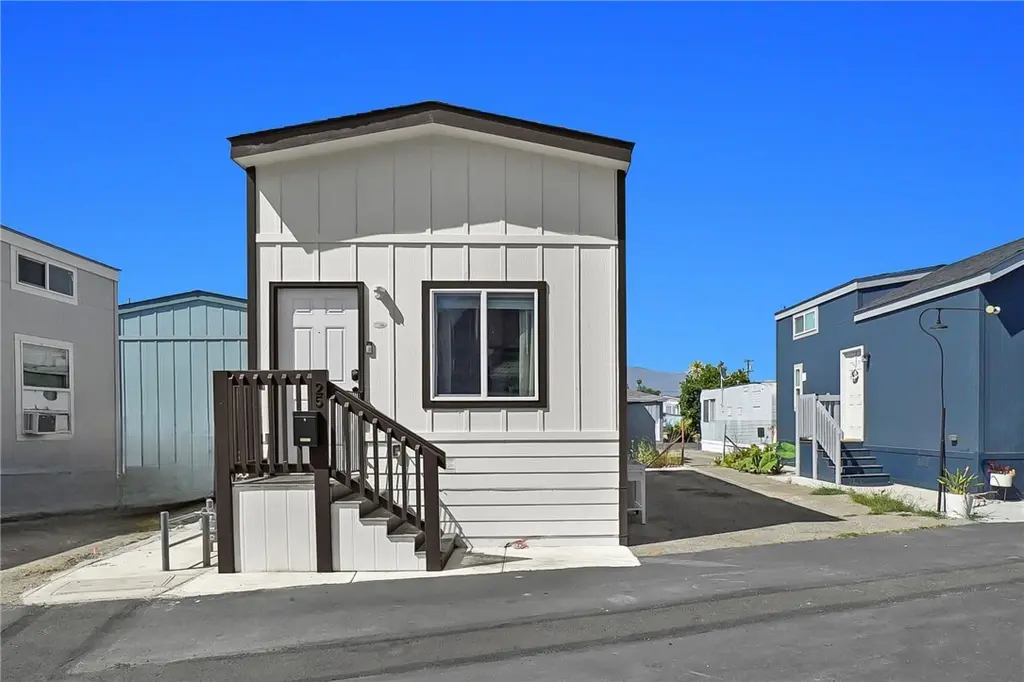
4849 Peck Rd #25 · El Monte, CA
Flood risk 1/10 · Minimal
- FEMA flood zone
- X (unshaded)
- Chance of flooding over 30 yrs
- 0.0%
- Est. flood insurance / yr
- $507 – $1,088
Fire risk 1/10 · Minimal
- Est. fire insurance / yr
- $659 – $1,223
Heat risk 6/10 · Moderate
- Hot days now (above 100°F)
- 7 days/yr
- Hot days in 30 yrs
- 20 days/yr
Wind risk 1/10 · Minimal
- Chance of severe wind over 30 yrs
- —
Air-quality risk 7/10 · Major
- Unhealthy air days now
- 12 days/yr
- Unhealthy air days in 30 yrs
- 14 days/yr
Risk factors via First Street. Map © Google.
Why this score? — see what drove the B grade
The composite is a weighted blend of 9 inputs, each scored 0–100. Each bar is that input's sub-score; the figure is the points it added to the 100-point composite (weight × sub-score).
- Cash flow +30.0/30.0
- ARV discount +10.7/15.0
- 1% rule +10.0/10.0
- DSCR +10.0/10.0
- Schools +4.2/10.0
- Condition / age +4.0/5.0
- Livability +3.1/5.0
- Rent growth +2.5/5.0
- Appreciation +0.0/10.0
$88,900
🖨 Deal sheet 📄 Offer letter ✓ Due diligence
Listing remarks
Freshly painted and meticulously maintained, this former model home offers a unique and efficient two-story layout featuring 1 bedroom, 1 bathroom, and two versatile loft spaces—perfect for a home office, guest area, or additional storage. With approximately 400 square feet of living space, the home showcases soaring ceilings and recessed lighting throughout, creating a bright and open atmosphere. The kitchen is equipped with stainless steel appliances, refrigerator, dishwasher, stove & storage shed are all included in the sale. Additional features include a storage shed, two dedicated parking spaces, and access to convenient community laundry facilities. Move-in ready and thoug
Key facts
- Built 2020
- Listed 14 days
Property features AI
Finance
- Other: Located on Peck Rd between Hallwood Dr and Lower Azusa Rd (lat 34.092502, long -118.013992)
- HOA & community: Community has street lighting and sidewalks; Monthly land lease of $1,607 (current)
Exterior
- Parking: Located in El Rovia Trailer Village
- Utilities: Public sewer; District/public water
- Home design: Single-story mobile home (Silvercrest model); Mobile home remains on site; Mobile dimensions approximately 12 ft by 28 ft; Estimated living area
- Construction: Year built per assessor
- Exterior features: No pool; Corner lot
Interior
- Bathrooms: One full bathroom
- Interior features: Entry on the main level
- Laundry & utility: Washer hookup; Gas dryer hookup
Neighborhood map
What this means for you Summary
Snapshot
- This is a 1-bed/1.0-bath manufactured listed at $89k. Condition is rated good.
Deal economics
- At list price, monthly cash flow is $642 ($8k/yr) — positive.
- The deal already cash-flows at list — no discount required.
- Meets the 1% rule at list price ($2k rent vs $89k).
- Recommended offer: $88k (1.5% below list) — sets the bar for market timing.
- Cap rate 15.0% vs local median 2.4% in El Monte — top-decile yield for the area; either an underpriced asset or a hidden risk that comps aren't pricing in. Stress-test before assuming the spread holds.
Location & tenants
- Location reads 61/100 on livability (#554 in CA) — a middle-class / working-renter tenant base. Strengths: commute A+; Watch: schools D+, crime D, amenities F.
- El Monte Union High (suburban): math 34% / reading 59% proficiency, ranked #543 of 1,400 in CA (top 39%) — families likely to look elsewhere, expect single-tenant / working-renter base with shorter leases.
- Market conditions: 84 active listings in the ZIP; 1 comparable units currently listed for rent nearby; solid renter incomes; 19,697 units permitted in Los Angeles County in 2024 (9,426 in 5+ unit buildings).
Forward outlook
- Local home prices are declining (-3.0%/yr); year-one equity from $615 of loan paydown is wiped out by about $3k of value loss. Plan a longer hold.
- Los Angeles County population projected at +9% by 2050 — modest demand growth; plan on rents tracking national, not racing it.
- At projected returns (-3.0% appreciation + 3.0% rent growth), your $25k cash investment doubles in ~4 years — after that, you're playing with house money.
Negotiation context
- It's been on market 15 days — a 2% lower offer ($88k) is reasonable based on typical stale-listing flexibility.
Risks & watch-outs
- Climate carrying-cost: extreme-heat days projected 7→20/yr by 2055 (HVAC capex compounding) — expect insurance premiums to compound above CPI over the hold.
Questions for the listing agent
- Is there a deadline driving the sale (1031 exchange, divorce, estate, relocation)? That informs how much negotiation room exists.
- Schools are D-rated, which usually means shorter tenancies and higher turnover. Who's the typical renter profile here, and what's been the actual vacancy rate?
- Crime grade is D in this area — have there been break-ins, vandalism, or insurance claims at this property in the last 3 years? What carrier currently insures it and at what premium?
- What's the average days-on-market for RENTAL listings here right now (not sales)? A rising rental-DOM trend means longer vacancies and softer asking-rent achievability than the comps imply.
- What's the recent tenant-quality profile in this submarket — average credit score on applications, eviction rate, late-payment / NSF rate, and stable-employment percentage? A property-management company in the area should have these aggregated.
- How much new for-sale + rental construction is in the pipeline within 1–3 miles? Heavy new supply typically softens prices + rents 12–24 months out; constrained supply supports both.
Investment metrics
- 1% rule
- 1.79% ✓
- Cap rate
- 14.96%
- Cash-on-cash
- 30.96%
- DSCR
- 2.38
- GRM
- 4.7
CMA / ARV
- ARV (on-the-fly)
- $95,600
- Comps found
- 1
Show comp detail 1 sale within ~0.75 mi
| Address | Dist | Beds/Ba | Sqft | Sold | Price | $/sf | Match |
|---|---|---|---|---|---|---|---|
| 4849 Peck Rd #29 | 0.00mi | 1/1.0 | 377 (-6%) | 17mo | $89,950 | $239 | 76 |
Match score weights: distance 35% · size 25% · config 20% · recency 20%. Top-matched comps best support the ARV.
Projected returns pro-forma
-3.0% appreciation · 3.0% rent growth · sell at horizon
- IRR
- 25.8%
- Equity multiple
- 2.07×
- Total profit
- $26,526
- Equity at exit
- $13,255
- IRR
- 33.5%
- Equity multiple
- 4.05×
- Total profit
- $75,871
- Equity at exit
- $7,686
Cash invested: $24,892 (down + closing). Projections, not guarantees.
Landlord ↔ Tenant lean methodology
- Overall (STATE)
- 18 Strongly Tenant-Friendly
- State California
- 18 Strongly Tenant-Friendly · D+13
- County
- — inherits STATE
- City
- — inherits STATE
ZIP-level market 91732
- Active inventory
- 84
- Price-to-rent
- 4.7×
Monthly cashflow live
- Estimated rent
- $1,591 medium interval (Pro) →
- Mortgage (P&I)
- −$466
- Tax est. 1.5%
- −$111 /mo · $1,334/yr
- Insurance
- −$37
- HOA
- −$0
- Vacancy / Maint / Mgmt
- −$334
- Net cashflow
- $642
Break-even live
UW: 25.0% down · 7.5% · 30yr · 1.5% tax · 5.0% vac · 8.0% maint · 8.0% mgmt
Financing live
Cash to close
- Down payment
- $22,225
- Closing costs
- $2,667
- Reserves months
- —
- Total cash needed
- —
Loan-product check · same deal, 3 products live
Conventional
25% down · 7.5% · 30yr
- Down + closing
- —
- Monthly P&I
- —
- Monthly cashflow
- —
- DSCR
- —
- Eligible?
- —
Personal DTI + credit; lowest rate.
DSCR
20% down · 8.5% · 30yr
- Down + closing
- —
- Monthly P&I
- —
- Monthly cashflow
- —
- DSCR
- —
- Eligible?
- —
No personal income docs; deal must DSCR.
Hard money
10% down · 12.0% · 12mo
- Down + closing
- —
- Monthly P&I
- —
- Monthly cashflow
- —
- DSCR
- —
- Eligible?
- —
Short-term bridge; refi at stabilization.
Rent comps 1 comps
| Address | Beds | Baths | Sqft | Rent | $/sqft | DOM | Units | Dist |
|---|---|---|---|---|---|---|---|---|
| 4030 E Live Oak Ave Unit 105 Arcadia, CA | — | 1.0 | 260 | $1,400 | $5.38 | 1d | 1 | 1.12mi |
Listing history 11 events
-
2026-06-18days on market $88,900 Active 15 DOM
-
2026-06-17days on market $88,900 Active 14 DOM
-
2026-06-16days on market $88,900 Active 13 DOM
-
2026-06-15days on market $88,900 Active 12 DOM
-
2026-06-13days on market $88,900 Active 10 DOM
-
2026-06-13days on market $88,900 Active 9 DOM
-
2026-06-09days on market $88,900 Active 6 DOM
-
2026-06-08days on market $88,900 Active 5 DOM
-
2026-06-07remarks 689-char remark
-
2026-06-07days on market $88,900 Active 4 DOM
-
2026-06-04$88,900 Active 1 DOM
ⓘ Source: listings_history table (triggers on properties + properties_extension) + one-shot
backfill from property_details.listing_events for pre-trigger history.
Climate risk First Street
- Flood 1/10 Low FEMA zone X (unshaded) · 0% chance over 30 yrs
- Wildfire 1/10 Low
- Heat 6/10 Major 7 d/yr ≥100°F today · 20 d/yr by 30 yrs out
- Wind 1/10 Low
- Air quality 7/10 Severe 12 unhealthy d/yr today · 14 by 30 yrs out
Nearby sold comps map
Loading sold comps map…
Walkable amenities ~0.75 mi
Loading nearby amenities…
Taxation est. · year 1
- Rental income
- $19,088
- − Mortgage interest
- −$4,980
- − Property taxes
- −$1,334
- − Insurance
- −$444
- − Repairs & maintenance
- −$1,527
- − Management
- −$1,527
- − Depreciation
- −$2,586
- Taxable income
- $6,690
- Est. tax owed @ 24.0%
- −$1,606
- After-tax cash flow
- $6,102/yr
For passive investors: Depreciation is non-cash, so a rental often shows a tax loss while cash-flowing — sheltering income. Rental losses are passive: they offset passive income freely, and up to $25,000/yr can offset ordinary (W-2) income if you actively participate and your MAGI is under $100k (phasing out to $0 by $150k); unused losses carry forward. On sale, claimed depreciation is recaptured at up to 25%, and gains may owe capital-gains tax (a 1031 exchange can defer both). Figures are a year-1 estimate at your 24.0% rate — not tax advice; consult a CPA.
Condition & rehab AI · 13 photos
This manufactured home is in good condition with minimal repairs needed. It has a good curb appeal and is move-in ready.
Value-add opportunities
- Both Painting the exterior — Enhances curb appeal and value
- Both Landscaping improvements — Enhances curb appeal and value
- Both New flooring in kitchen and bathrooms — Improves aesthetics and value
- Both New kitchen appliances — Modernizes the space and adds value
Renovation cost estimate screening
Value-add ROI direction
- Both Painting the exterior — Enhances curb appeal and value ↑
- Both Landscaping improvements — Enhances curb appeal and value ↑
- Both New flooring in kitchen and bathrooms — Improves aesthetics and value ↑
- Both New kitchen appliances — Modernizes the space and adds value ↑
ⓘ Cost ranges are severity-bucket heuristics (US national rule-of-thumb). Get contractor quotes + a written scope before underwriting a rehab budget.
Schools (NCES district)
- District
- El Monte Union High
- NCES district ID
- 0612120
- Math proficiency
- 34% ▲ 4.00%
- Reading proficiency
- 59% ▲ 3.00%
- Median HH income
- $46,859
- Composite
- 41.69/100
- National rank
- #7198
- State rank
- #543 of 1400 in CA
Livability — El Monte
- Score
- 61/100
- State rank
- #554
- US rank
- #18369
Category grades
Schools grade is shown separately in the Schools card above.
Census & demographics
- Census place
- El Monte, CA
- County
- Los Angeles County · 9,444,647 people
- City population
- 85,051
- Metro
- Los Angeles-Long Beach-Anaheim, CA
- Population (ZIP)
- 57,431
- Household income
- $75,108
- Rent vs Own
- Severe rent burden
- 2538.0
Population outlook (Los Angeles County) Hauer SSP2
- Today (2025)
- 10,940,515 people
- By 2030
- 11,256,481 · +2.9%
- By 2040
- 11,729,929 · +7.2%
- By 2050
- 11,948,407 · +9.2%
- By 2075
- 11,818,114 · +8.0%
- By 2100
- 10,842,928 · -0.9%
Race, ethnicity, and origin ACS 2023
- Neighborhood character
- Predominantly Hispanic (65%)
- Race & ethnicity
- Hispanic / Latino 65% Asian 29% Two or more races 22% White 3% Native American 2%
- Hispanic origin (detail)
- Mexican 57%
- Foreign-born
- 49% · Canada, China, Vietnam
- Languages at home
- 20% English-only · Spanish 54% Chinese 16% Vietnamese 7%
Political lean MEDSL · Los Angeles
- 2024 margin
- Solid D (+32.9) · D 64.8% · R 31.9% · Other 3.3%
- 2008→2024 swing
- -7.4pp toward R · 2008: 40.4pp · 2024: 32.9pp
- All cycles
- 2024: D+32.9 2020: D+44.2 2016: D+48.0 2012: D+40.0 2008: D+40.4
Not yet ingested
- Civics
- —
Market trends
- HPI YoY
- ▼ -1009.25%
- Current HPI
- 413.0584
- Rent YoY
- —
- Metro
- Los Angeles-Long Beach-Anaheim, CA
- State GDP YoY
- ▲ 3.21%
- F500 in state
- 116
Industry mix (Fortune 500 HQ in CA)
| Industry | F500 HQs | Revenue |
|---|---|---|
| Technology | 27 | $1,492B |
|
||
| Financial Services | 3 | $174B |
|
||
| Retail | 3 | $44B |
|
||
| Insurance | 3 | $26B |
|
||
| Media / Entertainment | 2 | $115B |
|
||
| Pharmaceuticals / Biotech | 2 | $62B |
|
||
Price history
1 event — show timeline
- 2026-06-03 Listed $88,900 CRMLS
Cash-flow waterfall
monthlySold comps — $/sqft
last 12 mo · ≤1 miLoading sold comps…