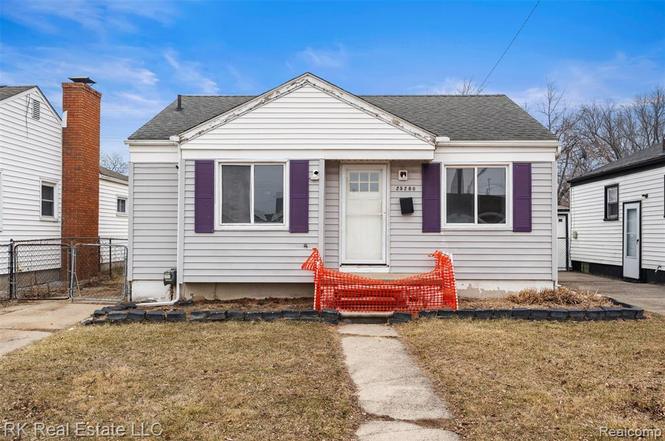
25280 Dale St · Roseville, MI
Flood risk 1/10 · Minimal
- FEMA flood zone
- X (unshaded)
- Chance of flooding over 30 yrs
- 0.0%
- Est. flood insurance / yr
- $473 – $860
Fire risk 1/10 · Minimal
- Est. fire insurance / yr
- $784 – $1,456
Heat risk 3/10 · Minor
- Hot days now (above 96°F)
- 7 days/yr
- Hot days in 30 yrs
- 15 days/yr
Wind risk 1/10 · Minimal
- Chance of severe wind over 30 yrs
- —
Air-quality risk 3/10 · Minor
- Unhealthy air days now
- 3 days/yr
- Unhealthy air days in 30 yrs
- 4 days/yr
Risk factors via First Street. Map © Google.
Why this score? — see what drove the B grade
The composite is a weighted blend of 9 inputs, each scored 0–100. Each bar is that input's sub-score; the figure is the points it added to the 100-point composite (weight × sub-score).
- Cash flow +30.0/30.0
- 1% rule +10.0/10.0
- DSCR +10.0/10.0
- ARV discount +7.5/15.0
- Appreciation +5.0/10.0
- Livability +3.6/5.0
- Rent growth +2.5/5.0
- Condition / age +2.2/5.0
- Schools +1.5/10.0
$42,000
🖨 Deal sheet (PDF) 📄 Offer letter ✓ Due diligence
Listing remarks
Attention, this two-bedroom ranch in Roseville's Felician Park subdivision presents a premier opportunity to build sweat equity. This being sold strictly as-is, requiring updates throughout to reach its full potential. Built in 1950, the home features a functional layout including a living room and bedrooms with original wood flooring plus a kitchen and a full ceramic tile bath. A full 672 square foot basement offers extensive additional space for a workshop or future finishing. Situated on a 40x112 lot north of 10 Mile and east of Hayes, this residence is located within the Roseville school district and offers immediate possession at closing. Terms offered Cash, and FHA 203K financing. All
Key facts
- 4,356 sq ft lot
- Built 1950
- Listed 5 days
Neighborhood map
What this means for you Summary
Snapshot
- This is a 2-bed/1.0-bath single-family listed at $42k. Condition is rated fair.
Deal economics
- At list price, monthly cash flow is $1k ($13k/yr) — positive.
- The deal already cash-flows at list — no discount required.
- Meets the 1% rule at list price ($2k rent vs $42k).
- Cap rate 36.3% vs local median 5.9% in Roseville — top-decile yield for the area; either an underpriced asset or a hidden risk that comps aren't pricing in. Stress-test before assuming the spread holds.
Location & tenants
- Location reads 72/100 on livability (#258 in MI) — a middle-class / working-renter tenant base. Strengths: commute A+, cost of living A+, housing A+; Watch: health & safety D+, employment D, schools F.
- Roseville Community Schools (suburban): math 11% / reading 24% proficiency, ranked #483 of 540 in MI (top 89%) — low school quality limits family demand, transient renter base, plan for 1-2y turnover; 60% free/reduced lunch — lower-income household profile, screen leases tightly.
- Market conditions: 1 active listings in the ZIP; 1 comparable units currently listed for rent nearby; 1,321 units permitted in Macomb County in 2024 (86 in 5+ unit buildings).
Forward outlook
- In year one you build about $2k of equity ($290 loan paydown + $1k appreciation (3.0% local appreciation)).
- Macomb County population projected at +9% by 2050 — modest demand growth; plan on rents tracking national, not racing it.
- At projected returns (3.0% appreciation + 3.0% rent growth), your $12k cash investment doubles in ~1 year — after that, you're playing with house money.
Negotiation context
- Only 5 days on market — expect competitive offers; lowballing is unlikely to land.
Risks & watch-outs
- Watch-outs: built in 1950 — expect roof / HVAC / electrical / plumbing capex.
Questions for the listing agent
- Have any recent inspections been done? Can we get a copy of the seller's disclosures and any deferred-maintenance estimates?
- Built in 1950 — when were the roof, HVAC, electrical panel, plumbing, and water heater last replaced?
- Is there a deadline driving the sale (1031 exchange, divorce, estate, relocation)? That informs how much negotiation room exists.
- Schools are F-rated, which usually means shorter tenancies and higher turnover. Who's the typical renter profile here, and what's been the actual vacancy rate?
- Crime grade is F in this area — have there been break-ins, vandalism, or insurance claims at this property in the last 3 years? What carrier currently insures it and at what premium?
- What's the average days-on-market for RENTAL listings here right now (not sales)? A rising rental-DOM trend means longer vacancies and softer asking-rent achievability than the comps imply.
- What's the recent tenant-quality profile in this submarket — average credit score on applications, eviction rate, late-payment / NSF rate, and stable-employment percentage? A property-management company in the area should have these aggregated.
- How much new for-sale + rental construction is in the pipeline within 1–3 miles? Heavy new supply typically softens prices + rents 12–24 months out; constrained supply supports both.
Investment metrics
- 1% rule
- 4.04% ✓
- Cap rate
- 36.33%
- Cash-on-cash
- 107.26%
- DSCR
- 5.77
- GRM
- 2.1
CMA / ARV
- ARV (on-the-fly)
- $116,610
- Comps found
- 12
Show comp detail 12 sales within ~0.75 mi
| Address | Dist | Beds/Ba | Sqft | Sold | Price | $/sf | Match |
|---|---|---|---|---|---|---|---|
| 25247 Lehner St | 0.04mi | 2/1.0 | 690 (0%) | 17mo | $143,000 | $207 | 84 |
| 25241 Rosenbusch Blvd | 0.30mi | 2/1.0 | 725 (+5%) | 3mo | $127,000 | $175 | 75 |
| 26211 Clancy St | 0.40mi | 2/1.0 | 700 (+1%) | 7mo | $119,900 | $171 | 73 |
| 25119 Leach St | 0.17mi | 2/1.0 | 700 (+1%) | 22mo | $118,000 | $169 | 72 |
| 26301 Clancy St | 0.47mi | 2/1.0 | 720 (+4%) | 3mo | $111,000 | $154 | 68 |
| 25224 Send St | 0.12mi | 2/1.0 | 792 (+15%) | 9mo | $126,000 | $159 | 63 |
| 26760 Lehner St | 0.74mi | 2/1.0 | 672 (-3%) | 2mo | $105,000 | $156 | 60 |
| 26093 Nagel St | 0.43mi | 2/1.0 | 672 (-3%) | 21mo | $130,000 | $193 | 58 |
| 25296 Send St | 0.10mi | 2/1.0 | 784 (+14%) | 20mo | $128,000 | $163 | 56 |
| 25680 Dodge St | 0.55mi | 2/1.0 | 762 (+10%) | 4mo | $90,000 | $118 | 54 |
| 26333 Belanger St | 0.49mi | 1/1.0 (-1) | 650 (-6%) | 11mo | $42,000 | $65 | 53 |
| 16655 Roberts St | 0.73mi | 2/1.0 | 620 (-10%) | 11mo | $127,000 | $205 | 40 |
Match score weights: distance 35% · size 25% · config 20% · recency 20%. Top-matched comps best support the ARV.
Projected returns pro-forma
3.0% appreciation · 3.0% rent growth · sell at horizon
- IRR
- —
- Equity multiple
- 7.13×
- Total profit
- $72,035
- Equity at exit
- $18,885
- IRR
- —
- Equity multiple
- 14.83×
- Total profit
- $162,651
- Equity at exit
- $29,104
Cash invested: $11,760 (down + closing). Projections, not guarantees.
Landlord ↔ Tenant lean methodology
- Overall (STATE)
- 62 Landlord-Friendly
- State Michigan
- 62 Landlord-Friendly · EVEN
- County
- — inherits STATE
- City
- — inherits STATE
ZIP-level market 48066 3615
- Active inventory
- 1
- Price-to-rent
- 2.1×
Monthly cashflow live
- Estimated rent
- $1,698 medium interval (Pro) →
- Mortgage (P&I)
- −$220
- Tax est. 1.5%
- −$52 /mo · $630/yr
- Insurance
- −$18
- HOA
- −$0
- Vacancy / Maint / Mgmt
- −$357
- Net cashflow
- $1,051
Break-even live
Sensitivity live
| Price | -10% $1,080 | -5% $1,066 | +0% $1,051 | +5% $1,037 | +10% $1,022 |
|---|---|---|---|---|---|
| Rent | -10% $917 | -5% $984 | +0% $1,051 | +5% $1,118 | +10% $1,185 |
| Rate | -1.0pp $1,072 | -0.5pp $1,062 | base $1,051 | +0.5pp $1,040 | +1.0pp $1,029 |
UW: 25.0% down · 7.5% · 30yr · 1.5% tax · 5.0% vac · 8.0% maint · 8.0% mgmt
Financing live
Cash to close
- Down payment
- $10,500
- Closing costs
- $1,260
- Reserves months
- —
- Total cash needed
- —
Loan-product check · same deal, 3 products live
Conventional
25% down · 7.5% · 30yr
- Down + closing
- —
- Monthly P&I
- —
- Monthly cashflow
- —
- DSCR
- —
- Eligible?
- —
Personal DTI + credit; lowest rate.
DSCR
20% down · 8.5% · 30yr
- Down + closing
- —
- Monthly P&I
- —
- Monthly cashflow
- —
- DSCR
- —
- Eligible?
- —
No personal income docs; deal must DSCR.
Hard money
10% down · 12.0% · 12mo
- Down + closing
- —
- Monthly P&I
- —
- Monthly cashflow
- —
- DSCR
- —
- Eligible?
- —
Short-term bridge; refi at stabilization.
Rent comps 1 comps
| Address | Beds | Baths | Sqft | Rent | $/sqft | DOM | Units | Dist |
|---|---|---|---|---|---|---|---|---|
| 26160 Regency Club Dr Warren, MI | 1.0–2.0 | 1.0–1.5 | 880 | $1,698 | $1.93 | 0d | 15 | 0.48mi |
Listing history 3 events
-
2026-03-16status Pending
-
2026-03-12$42,000 Active
-
2026-03-10historical $42,000
ⓘ Source: listings_history table (triggers on properties + properties_extension) + one-shot
backfill from property_details.listing_events for pre-trigger history.
Climate risk First Street
- Flood 1/10 Low FEMA zone X (unshaded) · 0% chance over 30 yrs
- Wildfire 1/10 Low
- Heat 3/10 Moderate 7 d/yr ≥96°F today · 15 d/yr by 30 yrs out
- Wind 1/10 Low
- Air quality 3/10 Moderate 3 unhealthy d/yr today · 4 by 30 yrs out
Nearby sold comps map
Loading sold comps map…
Walkable amenities ~0.75 mi
Loading nearby amenities…
Taxation est. · year 1
- Rental income
- $20,376
- − Mortgage interest
- −$2,353
- − Property taxes
- −$630
- − Insurance
- −$210
- − Repairs & maintenance
- −$1,630
- − Management
- −$1,630
- − Depreciation
- −$1,222
- Taxable income
- $12,701
- Est. tax owed @ 24.0%
- −$3,048
- After-tax cash flow
- $9,566/yr
For passive investors: Depreciation is non-cash, so a rental often shows a tax loss while cash-flowing — sheltering income. Rental losses are passive: they offset passive income freely, and up to $25,000/yr can offset ordinary (W-2) income if you actively participate and your MAGI is under $100k (phasing out to $0 by $150k); unused losses carry forward. On sale, claimed depreciation is recaptured at up to 25%, and gains may owe capital-gains tax (a 1031 exchange can defer both). Figures are a year-1 estimate at your 24.0% rate — not tax advice; consult a CPA.
Condition & rehab AI · 13 photos
This 1950s ranch requires moderate updates to its kitchen and exterior to improve its condition and value. Fresh paint and new cabinetry can significantly enhance its appeal.
Repairs flagged
- Major Exposed plumbing in kitchen — Needs immediate repair to prevent water damage
- Major Missing cabinetry in kitchen — Needs replacement for a functional kitchen
- Minor Paint touch-up throughout — Some areas of paint need touch-up
Value-add opportunities
- Resale Paint touch-up throughout — Fresh paint enhances curb appeal
- Resale Replace missing cabinetry in kitchen — Modern kitchen cabinets improve functionality and aesthetics
- Rental Replace missing cabinetry in kitchen — Modern kitchen cabinets attract renters and improve functionality
- Both Landscaping and curb appeal — Landscaping enhances curb appeal and can increase property value
Renovation cost estimate screening
| Repair item | Severity | Est. cost |
|---|---|---|
| Exposed plumbing in kitchen · Needs immediate repair to prevent water damage | Major | $15,000–50,000 |
| Missing cabinetry in kitchen · Needs replacement for a functional kitchen | Major | $15,000–50,000 |
| Paint touch-up throughout · Some areas of paint need touch-up | Minor | $500–3,000 |
| Total estimated repair cost · 3 items | $30,500–103,000 |
Value-add ROI direction
- Resale Paint touch-up throughout — Fresh paint enhances curb appeal ↑
- Resale Replace missing cabinetry in kitchen — Modern kitchen cabinets improve functionality and aesthetics ↑
- Rental Replace missing cabinetry in kitchen — Modern kitchen cabinets attract renters and improve functionality ↑
- Both Landscaping and curb appeal — Landscaping enhances curb appeal and can increase property value ↑
ⓘ Cost ranges are severity-bucket heuristics (US national rule-of-thumb). Get contractor quotes + a written scope before underwriting a rehab budget.
Schools (NCES district)
- District
- Roseville Community Schools
- NCES district ID
- 2630210
- Math proficiency
- 11% ▼ -8.00%
- Reading proficiency
- 24% ▼ -7.00%
- Median HH income
- $41,590
- Composite
- 14.98/100
- National rank
- #9363
- State rank
- #483 of 540 in MI
Livability — Roseville
- Score
- 72/100
- State rank
- #258
- US rank
- #6400
Category grades
Schools grade is shown separately in the Schools card above.
Census & demographics
- Census place
- Roseville, MI
Population outlook (Macomb County) Hauer SSP2
- Today (2025)
- 925,296 people
- By 2030
- 948,226 · +2.5%
- By 2040
- 983,961 · +6.3%
- By 2050
- 1,010,200 · +9.2%
- By 2075
- 1,076,222 · +16.3%
- By 2100
- 1,077,065 · +16.4%
Not yet ingested
- Political lean
- —
- Race & ethnicity
- —
- Common origin
- —
- Civics
- —
Market trends
- HPI YoY
- —
- Current HPI
- —
- Rent YoY
- —
- Metro
- —
- State GDP YoY
- ▲ 1.37%
- F500 in state
- 28
Industry mix (Fortune 500 HQ in MI)
| Industry | F500 HQs | Revenue |
|---|---|---|
| Automotive Parts | 3 | $48B |
|
||
| Automotive | 2 | $372B |
|
||
| Chemicals | 1 | $45B |
|
||
| Automotive Retail | 1 | $29B |
|
||
| Healthcare / Medical Devices | 1 | $23B |
|
||
| Automotive Technology | 1 | $20B |
|
||
Price history
+0.0% since first listed3 events — show timeline
- 2026-03-16 Pending — MiRealSource-MiMLS
- 2026-03-12 Listed $42,000 MiRealSource-MiMLS
- 2026-03-10 Coming Soon $42,000 MiRealSource-MiMLS
Cash-flow waterfall
monthlySold comps — $/sqft
last 12 mo · ≤1 miLoading sold comps…