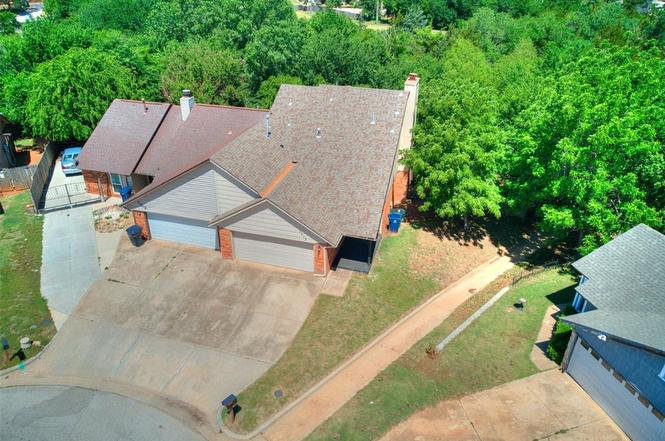
7212 Lakewood Cir · Oklahoma City, OK
Flood risk 1/10 · Minimal
- FEMA flood zone
- X (unshaded)
- Chance of flooding over 30 yrs
- 0.0%
- Est. flood insurance / yr
- $507 – $1,088
Fire risk 2/10 · Minimal
- Est. fire insurance / yr
- $2,463 – $4,575
Heat risk 6/10 · Moderate
- Hot days now (above 106°F)
- 7 days/yr
- Hot days in 30 yrs
- 19 days/yr
Wind risk 2/10 · Minimal
- Chance of severe wind over 30 yrs
- 2.0%
Air-quality risk 2/10 · Minimal
- Unhealthy air days now
- 1 days/yr
- Unhealthy air days in 30 yrs
- 2 days/yr
Risk factors via First Street. Map © Google.
Why this score? — see what drove the D grade
The composite is a weighted blend of 9 inputs, each scored 0–100. Each bar is that input's sub-score; the figure is the points it added to the 100-point composite (weight × sub-score).
- Cash flow +14.4/30.0
- ARV discount +10.2/15.0
- DSCR +4.4/10.0
- Livability +4.0/5.0
- 1% rule +3.5/10.0
- Rent growth +2.9/5.0
- Condition / age +2.5/5.0
- Schools +1.3/10.0
- Appreciation +0.0/10.0
$159,500
🖨 Deal sheet (PDF) 📄 Offer letter ✓ Due diligence
Listing remarks MLS
New paint, new carpet, new tile, updated kitchen and baths, freshly painted exterior and more. Central heat and air, cozy fireplace with lakeside view. 2 bed, 2 full baths and 1 half bath, 2 story duplex with a two car garage. Just updated throughout, central heat and air, cozy fireplace with lakeside view. Owner Licensee
Key facts
- 2 garage spots
- Built 1979
- Listed 124 days
Property features AI
Finance
- Other: Homestead exempt; Occupied by owner; Living area reported as 1,662 (source: assessor)
- Financial info: Not assumable
- HOA & community: No mandatory association dues
Exterior
- Parking: 2-car garage
- Utilities: No flood insurance indicated
- Home design: Residential half duplex; Two-level property; Slab foundation
- Construction: Brick and frame construction; Composition roof; Built as existing property
- Exterior features: Open patio; Located on a cul-de-sac
Interior
- Kitchen: Free-standing electric range; Free-standing electric oven
- Bedrooms: 2 bedrooms
- Bathrooms: 2 full bathrooms; 1 half bathroom
- Interior features: Disposal; Microwave; Water heater; Wood-burning fireplace
- Laundry & utility: Water heater (included)
Neighborhood map
What this means for you Summary
Snapshot
- This is a 2-bed/2.0-bath townhouse listed at $160k.
Deal economics
- At list price, monthly cash flow is $32 ($378/yr) — positive.
- The deal already cash-flows at list — no discount required.
- To meet the 1% rule (rent ≥ 1% of price), the offer needs to be $136k (14.7% below list).
- Recommended offer: $136k (14.7% below list) — sets the bar for 1% rule.
- Cap rate 6.5% vs local median 3.7% in Oklahoma City — top-decile yield for the area; either an underpriced asset or a hidden risk that comps aren't pricing in. Stress-test before assuming the spread holds.
Location & tenants
- Location reads 80/100 on livability (#3 in OK, #1,635 nationally) — a professional / high-income tenant draw. Strengths: amenities A+, commute A+, cost of living A+; Watch: crime F.
- Putnam City (urban): math 12% / reading 16% proficiency, ranked #227 of 270 in OK (top 84%) — low school quality limits family demand, transient renter base, plan for 1-2y turnover; 65% free/reduced lunch — lower-income household profile, screen leases tightly.
- Zoned schools: Tulakes Es (math 7% / reading 7%, grade F, #762 of 845 statewide, top 90%, 621 students, 0% FRL); Putnam City Hs (math 12% / reading 23%, grade F, #307 of 447 statewide, top 69%, 2,014 students, 0% FRL) — zoned schools average 0% FRL vs 65% district-wide (65 pts lower); this property's tenant base skews higher-income than the district average.
- Market conditions: Rents rising (+1.5%/yr); 190 active listings in the ZIP; 40 comparable units currently listed for rent nearby; rentals leasing fast (median 12d on market — plan ~1-2 weeks tenant-placement turnaround); 5,365 units permitted in Oklahoma County in 2024 (569 in 5+ unit buildings).
Forward outlook
- Local home prices are declining (-3.0%/yr); year-one equity from $1k of loan paydown is wiped out by about $5k of value loss. Plan a longer hold.
- Oklahoma County population projected at +41% by 2050 — long-run rental-demand tailwind backs the buy-and-hold thesis.
Negotiation context
- It's been on market 124 days — a 12% lower offer ($140k) is reasonable based on typical stale-listing flexibility.
- 5 sale attempts since 7y ago; this cycle's ask has dropped $9k (5%) from the opening price — seller is motivated, your offer sets the floor, not the list.
- Current owner paid $115k; 39% above their basis — modest negotiation headroom, anchor on the comps not their cost.
Risks & watch-outs
- Climate carrying-cost: extreme-heat days projected 7→19/yr by 2055 (HVAC capex compounding) — expect insurance premiums to compound above CPI over the hold.
Questions for the listing agent
- It's been on market 124 days. Have you received any prior offers? Is the seller open to a 15% concession, seller financing, or rate buy-down credit?
- Built in 1979 — when were the roof, HVAC, electrical panel, plumbing, and water heater last replaced?
- Why hasn't it sold? Are there any deal-killer items the seller is aware of (foundation, flood, title, zoning, code violations)?
- Is there a deadline driving the sale (1031 exchange, divorce, estate, relocation)? That informs how much negotiation room exists.
- Schools are F-rated, which usually means shorter tenancies and higher turnover. Who's the typical renter profile here, and what's been the actual vacancy rate?
- Crime grade is F in this area — have there been break-ins, vandalism, or insurance claims at this property in the last 3 years? What carrier currently insures it and at what premium?
- The area grade is low — what's the realistic commute time and amenity access for the typical tenant pool here? Any planned neighborhood developments (good or bad) we should know about?
- What's the average days-on-market for RENTAL listings here right now (not sales)? A rising rental-DOM trend means longer vacancies and softer asking-rent achievability than the comps imply.
- What's the recent tenant-quality profile in this submarket — average credit score on applications, eviction rate, late-payment / NSF rate, and stable-employment percentage? A property-management company in the area should have these aggregated.
- How much new for-sale + rental construction is in the pipeline within 1–3 miles? Heavy new supply typically softens prices + rents 12–24 months out; constrained supply supports both.
Investment metrics
- 1% rule
- 0.85% ✗
- Cap rate
- 6.53%
- Cash-on-cash
- 0.85%
- DSCR
- 1.04
- GRM
- 9.8
CMA / ARV
- ARV (on-the-fly)
- $169,524
- Comps found
- 6
Show comp detail 6 sales within ~0.75 mi
| Address | Dist | Beds/Ba | Sqft | Sold | Price | $/sf | Match |
|---|---|---|---|---|---|---|---|
| 7301 Kings Manor Ct | 0.05mi | 3/2.0 (+1) | 1,588 (-4%) | 10mo | $168,000 | $106 | 77 |
| 7303 Kings Manor Ct | 0.05mi | 3/2.0 (+1) | 1,588 (-4%) | 12mo | $162,500 | $102 | 75 |
| 7211 Lakewood Cir | 0.02mi | 3/2.5 (+1) | 1,761 (+6%) | 9mo | $158,000 | $90 | 75 |
| 7215 Edenborough Dr | 0.10mi | 3/2.0 (+1) | 1,570 (-6%) | 22mo | $140,000 | $89 | 62 |
| 7303 Edenborough Dr | 0.12mi | 2/2.5 | 1,901 (+14%) | 9mo | $89,000 | $47 | 61 |
| 8227 Springbrook Dr | 0.64mi | 2/2.0 | 1,455 (-12%) | 20mo | $179,900 | $124 | 33 |
Match score weights: distance 35% · size 25% · config 20% · recency 20%. Top-matched comps best support the ARV.
Projected returns pro-forma
-3.0% appreciation · 1.53% rent growth · sell at horizon
- IRR
- -16.5%
- Equity multiple
- 0.42×
- Total profit
- $-25,838
- Equity at exit
- $23,782
- IRR
- -11.1%
- Equity multiple
- 0.38×
- Total profit
- $-27,882
- Equity at exit
- $13,791
Cash invested: $44,660 (down + closing). Projections, not guarantees.
Landlord ↔ Tenant lean methodology
- Overall (STATE)
- 83 Strongly Landlord-Friendly
- State Oklahoma
- 83 Strongly Landlord-Friendly · R+20
- County
- — inherits STATE
- City
- — inherits STATE
ZIP-level market 73132
- Rents YoY
- 1.5%
- Active inventory
- 190
- Price-to-rent
- 9.8×
Monthly cashflow live
- Estimated rent
- $1,361 high interval (Pro) →
- Mortgage (P&I)
- −$836
- Tax from tax record
- −$141 /mo · $1,689/yr
- Insurance
- −$66
- HOA
- −$0
- Vacancy / Maint / Mgmt
- −$286
- Net cashflow
- $32
Break-even live
Sensitivity live
| Price | -10% $122 | -5% $77 | +0% $32 | +5% $-14 | +10% $-59 |
|---|---|---|---|---|---|
| Rent | -10% $-76 | -5% $-22 | +0% $32 | +5% $85 | +10% $139 |
| Rate | -1.0pp $112 | -0.5pp $72 | base $32 | +0.5pp $-10 | +1.0pp $-52 |
UW: 25.0% down · 7.5% · 30yr · 1.5% tax · 5.0% vac · 8.0% maint · 8.0% mgmt
Financing live
Cash to close
- Down payment
- $39,875
- Closing costs
- $4,785
- Reserves months
- —
- Total cash needed
- —
Loan-product check · same deal, 3 products live
Conventional
25% down · 7.5% · 30yr
- Down + closing
- —
- Monthly P&I
- —
- Monthly cashflow
- —
- DSCR
- —
- Eligible?
- —
Personal DTI + credit; lowest rate.
DSCR
20% down · 8.5% · 30yr
- Down + closing
- —
- Monthly P&I
- —
- Monthly cashflow
- —
- DSCR
- —
- Eligible?
- —
No personal income docs; deal must DSCR.
Hard money
10% down · 12.0% · 12mo
- Down + closing
- —
- Monthly P&I
- —
- Monthly cashflow
- —
- DSCR
- —
- Eligible?
- —
Short-term bridge; refi at stabilization.
Rent comps 40 comps
| Address | Beds | Baths | Sqft | Rent | $/sqft | DOM | Units | Dist |
|---|---|---|---|---|---|---|---|---|
| 7333 Edenborough Dr Oklahoma City, OK | 3.0 | 2.0 | 1993 | $1,895 | $0.95 | 11d | 1 | 0.19mi |
| 7333 Edenborough Dr Oklahoma City, OK | 3.0 | 2.0 | 1993 | $1,950 | $0.98 | 4d | 1 | 0.19mi |
| 7525 Knight Lake Dr Oklahoma City, OK | 1.0–3.0 | 1.0–2.0 | 1128 | $965 | $0.86 | 24d | 7 | 0.24mi |
| 7201 Galahad Cir Oklahoma City, OK | 3.0 | 2.5 | 1875 | $1,695 | $0.90 | 3d | 1 | 0.25mi |
| 6715 Lyrewood Ln Oklahoma City, OK | 3.0 | 2.0 | 1309 | $1,495 | $1.14 | 5d | 1 | 0.30mi |
| 6713 Lyrewood Ln Oklahoma City, OK | 3.0 | 2.0 | 1309 | $1,395 | $1.07 | 5d | 1 | 0.30mi |
| 7806 Lyrewood Ln Oklahoma City, OK | 3.0 | 2.0 | 1355 | $900 | $0.66 | 3d | 1 | 0.34mi |
| 6900 London Way Oklahoma City, OK | 1.0–3.0 | 1.0–3.0 | 1237 | $1,050 | $0.85 | 4d | 2 | 0.36mi |
| 6605 Lyrewood Ln Oklahoma City, OK | 2.0 | 2.0 | 1224 | $1,100 | $0.90 | 24d | 1 | 0.37mi |
| 6708 W Wilshire Blvd Oklahoma City, OK | 2.0–4.0 | 2.0 | 1259 | $1,000 | $0.79 | 3d | 1 | 0.38mi |
| 6370 W Wilshire Blvd Oklahoma City, OK | 1.0–3.0 | 1.0–2.0 | 975 | $849 | $0.87 | 24d | 8 | 0.45mi |
| 6056 Northwest Expy Unit 1 Warr Acres, OK | 2.0 | 1.5 | 1122 | $995 | $0.89 | 24d | 1 | 0.45mi |
| 6054 Northwest Expy Oklahoma City, OK | 2.0 | 1.5 | 1122 | $995 | $0.89 | 24d | 1 | 0.48mi |
| 6916 Woodlake Dr Unit 6920 Oklahoma City, OK | 3.0 | 2.0 | 1430 | $1,300 | $0.91 | 17d | 1 | 0.48mi |
| 6004 Northwest Expy Oklahoma City, OK | 3.0 | 2.5 | 1400 | $1,195 | $0.85 | 24d | 1 | 0.52mi |
| 6066 Northwest Expy Warr Acres, OK | 2.0 | 1.5 | 1122 | $1,145 | $1.02 | 24d | 1 | 0.54mi |
| 6419 NW 63rd St Unit 1 Warr Acres, OK | 3.0 | 2.5 | 1748 | $1,425 | $0.82 | 3d | 1 | 0.55mi |
| 7024 Woodlake Dr Oklahoma City, OK | 3.0 | 2.0 | 1200 | $1,450 | $1.21 | 17d | 1 | 0.55mi |
| 6103 NW 63rd St Oklahoma City, OK | 3.0 | 2.0 | 1300 | $1,325 | $1.02 | 3d | 1 | 0.56mi |
| 6001 Glencove Pl Oklahoma City, OK | 3.0 | 2.0 | 1727 | $4,500 | $2.61 | 3d | 1 | 0.75mi |
| 8501 Candlewood Dr Oklahoma City, OK | 3.0 | 2.0 | 1325 | $1,275 | $0.96 | 20d | 1 | 0.80mi |
| 8501 Candlewood Dr Oklahoma City, OK | 3.0 | 2.0 | 1325 | $1,275 | $0.96 | 12d | 1 | 0.80mi |
| 5929 NW 62nd St Oklahoma City, OK | 3.0 | 1.0 | 1103 | $1,550 | $1.41 | 3d | 1 | 0.83mi |
| 8508 Candlewood Dr Oklahoma City, OK | 3.0 | 2.5 | 1527 | $1,395 | $0.91 | 3d | 1 | 0.88mi |
| 8510 Candlewood Dr Oklahoma City, OK | 3.0 | 2.5 | 1527 | $1,395 | $0.91 | 24d | 1 | 0.88mi |
| 8522 Candlewood Dr Oklahoma City, OK | 3.0 | 2.0 | 1527 | $1,495 | $0.98 | 4d | 1 | 0.92mi |
| 6505 Cherokee Dr Warr Acres, OK | 3.0 | 1.5 | 1455 | $1,390 | $0.96 | 3d | 1 | 0.96mi |
| 7021 Labelle Dr Warr Acres, OK | 3.0 | 2.0 | 1365 | $1,845 | $1.35 | 16d | 1 | 1.03mi |
| 7021 Labelle Dr Warr Acres, OK | 3.0 | 2.0 | 1365 | $1,845 | $1.35 | 19d | 1 | 1.03mi |
| 7020 Labelle Dr Warr Acres, OK | 3.0 | 2.0 | 1365 | $1,845 | $1.35 | 2d | 1 | 1.05mi |
| 5633 Norman Rd Warr Acres, OK | 3.0 | 2.0 | 1225 | $1,375 | $1.12 | 3d | 1 | 1.05mi |
| 7036 Labelle Dr Warr Acres, OK | 1.0 | 2.0 | 1120 | $1,595 | $1.42 | 12d | 1 | 1.06mi |
| 6932 Labelle Dr Warr Acres, OK | 1.0 | 2.0 | 1120 | $1,595 | $1.42 | 24d | 1 | 1.07mi |
| 6932 Labelle Dr Warr Acres, OK | 1.0 | 2.0 | 1120 | $1,595 | $1.42 | 17d | 1 | 1.07mi |
| 5825 NW 86th St Oklahoma City, OK | 3.0 | 2.0 | 1846 | $2,500 | $1.35 | 24d | 1 | 1.11mi |
| 9006 N Rockwell Dr Oklahoma City, OK | 2.0 | 2.5 | 1635 | $1,295 | $0.79 | 3d | 1 | 1.23mi |
| 9003 N Rockwell Dr Oklahoma City, OK | 2.0 | 2.0 | 1431 | $1,250 | $0.87 | 24d | 1 | 1.23mi |
| 4727 NW 72nd St Unit 4727 Oklahoma City, OK | 2.0 | 2.0 | 1280 | $2,499 | $1.95 | 2d | 1 | 1.27mi |
| 9020 N Rockwell Dr Oklahoma City, OK | 2.0 | 2.5 | 1244 | $1,250 | $1.00 | 12d | 1 | 1.27mi |
| 9021 N Rockwell Dr Unit 9023 Oklahoma City, OK | 3.0 | 2.0 | 1400 | $1,500 | $1.07 | 21d | 1 | 1.29mi |
Listing history 16 events
-
2026-05-10status Pending
-
2026-03-21price $159,500
-
2026-03-08price $163,500
-
2026-02-18status Active
-
2026-02-15status Active
-
2026-01-28status Pending
-
2026-01-23status Active
-
2026-01-10status Pending
-
2025-12-05$168,500 Active
-
2019-09-16soldstatus $115,000
-
2019-09-13soldstatus $114,900 Sold 324-char remark
Show marketing remark (324 chars)
New paint, new carpet, new tile, updated kitchen and baths, freshly painted exterior and more. Central heat and air, cozy fireplace with lakeside view. 2 bed, 2 full baths and 1 half bath, 2 story duplex with a two car garage. Just updated throughout, central heat and air, cozy fireplace with lakeside view. Owner Licensee
-
2019-08-03status Pending 324-char remark
Show marketing remark (324 chars)
New paint, new carpet, new tile, updated kitchen and baths, freshly painted exterior and more. Central heat and air, cozy fireplace with lakeside view. 2 bed, 2 full baths and 1 half bath, 2 story duplex with a two car garage. Just updated throughout, central heat and air, cozy fireplace with lakeside view. Owner Licensee
-
2019-07-19$114,900 Active 324-char remark
Show marketing remark (324 chars)
New paint, new carpet, new tile, updated kitchen and baths, freshly painted exterior and more. Central heat and air, cozy fireplace with lakeside view. 2 bed, 2 full baths and 1 half bath, 2 story duplex with a two car garage. Just updated throughout, central heat and air, cozy fireplace with lakeside view. Owner Licensee
-
2019-04-01soldstatus $75,000
-
1999-08-31soldstatus $69,000
-
1989-06-28soldstatus $45,000
ⓘ Source: listings_history table (triggers on properties + properties_extension) + one-shot
backfill from property_details.listing_events for pre-trigger history.
Tax reassessment forecast OK · Resets to sale price
- Current annual tax
- $1,689 · $141/mo
- Projected year-2 tax
- $1,689 · $141/mo
- Expected delta
- $0/yr ($0/mo · 0.0%)
ⓘ Screening estimate from a state-policy table — verify with the county assessor before closing.
Climate risk First Street
- Flood 1/10 Low FEMA zone X (unshaded) · 0% chance over 30 yrs
- Wildfire 2/10 Low
- Heat 6/10 Major 7 d/yr ≥106°F today · 19 d/yr by 30 yrs out
- Wind 2/10 Low 2% chance of damaging wind over 30 yrs
- Air quality 2/10 Low 1 unhealthy d/yr today · 2 by 30 yrs out
Nearby sold comps map
Loading sold comps map…
Walkable amenities ~0.75 mi
Loading nearby amenities…
Taxation est. · year 1
- Rental income
- $16,331
- − Mortgage interest
- −$8,934
- − Property taxes
- −$1,689
- − Insurance
- −$798
- − Repairs & maintenance
- −$1,306
- − Management
- −$1,306
- − Depreciation
- −$4,640
- Taxable loss
- −$2,343
- Est. tax savings @ 24.0%
- +$562
- After-tax cash flow
- $940/yr
For passive investors: Depreciation is non-cash, so a rental often shows a tax loss while cash-flowing — sheltering income. Rental losses are passive: they offset passive income freely, and up to $25,000/yr can offset ordinary (W-2) income if you actively participate and your MAGI is under $100k (phasing out to $0 by $150k); unused losses carry forward. On sale, claimed depreciation is recaptured at up to 25%, and gains may owe capital-gains tax (a 1031 exchange can defer both). Figures are a year-1 estimate at your 24.0% rate — not tax advice; consult a CPA.
Schools (NCES district)
- District
- Putnam City
- NCES district ID
- 4025290
- Math proficiency
- 12% ▼ -18.00%
- Reading proficiency
- 16% ▼ -14.00%
- Median HH income
- $46,657
- Composite
- 12.61/100
- National rank
- #9614
- State rank
- #227 of 270 in OK
Livability — Oklahoma City
- Score
- 80/100
- State rank
- #3
- US rank
- #1635
Category grades
Schools grade is shown separately in the Schools card above.
Census & demographics
- Census place
- Oklahoma City, OK
- County
- Oklahoma County · 771,644 people
- City population
- 498,656
- Metro
- Oklahoma City, OK
- Population (ZIP)
- 27,834
- Household income
- $60,419
- Rent vs Own
- Severe rent burden
- 1610.0
Population outlook (Oklahoma County) Hauer SSP2
- Today (2025)
- 911,875 people
- By 2030
- 982,413 · +7.7%
- By 2040
- 1,130,468 · +24.0%
- By 2050
- 1,288,422 · +41.3%
- By 2075
- 1,711,482 · +87.7%
- By 2100
- 2,088,448 · +129.0%
Race, ethnicity, and origin ACS 2023
- Neighborhood character
- Diverse neighborhood (Simpson 0.68)
- Race & ethnicity
- White 51% Black 17% Hispanic / Latino 16% Two or more races 12% Asian 5% Native American 2%
- Hispanic origin (detail)
- Mexican 10% Puerto Rican 1%
- Common ancestry
- Serbian 2% Slovak 2% Lithuanian 1%
- Foreign-born
- 11% · Canada, Vietnam, Philippines
- Languages at home
- 84% English-only · Spanish 10% Other Asian/Pacific 1% Vietnamese 1%
Political lean MEDSL · Oklahoma
- 2024 margin
- Toss-up / Even · D 48.0% · R 49.7% · Other 2.3%
- 2008→2024 swing
- +15.1pp toward D · 2008: -16.8pp · 2024: -1.7pp
- All cycles
- 2024: R+1.7 2020: R+1.1 2016: R+10.5 2012: R+16.7 2008: R+16.8
Not yet ingested
- Civics
- —
Market trends
- HPI YoY
- ▼ -196.70%
- Current HPI
- 214.9695
- Rent YoY
- ▲ 1.53%
- Metro
- Oklahoma City, OK
- State GDP YoY
- ▲ 1.55%
- F500 in state
- 6
Industry mix (Fortune 500 HQ in OK)
| Industry | F500 HQs | Revenue |
|---|---|---|
| Energy | 3 | $48B |
|
||
Price history
+254.4% since first listed16 events — show timeline
- 2026-05-10 Pending — MLSOK
- 2026-03-21 Price Changed $159,500 MLSOK
- 2026-03-08 Price Changed $163,500 MLSOK
- 2026-02-18 Relisted — MLSOK
- 2026-02-15 Relisted — MLSOK
- 2026-01-28 Pending — MLSOK
- 2026-01-23 Relisted — MLSOK
- 2026-01-10 Pending — MLSOK
- 2025-12-05 Listed $168,500 MLSOK
- 2019-09-16 Sold (Public Records) $115,000 Public Records
- 2019-09-13 Sold (MLS) $114,900 MLSOK
- 2019-08-03 Pending — MLSOK
- 2019-07-19 Listed $114,900 MLSOK
- 2019-04-01 Sold (Public Records) $75,000 Public Records
- 1999-08-31 Sold (Public Records) $69,000 Public Records
- 1989-06-28 Sold (Public Records) $45,000 Public Records
Property tax history
+5.4%/yrLatest (2025): $1,689 · +4.0% YoY. Source: county tax records.
Cash-flow waterfall
monthlySold comps — $/sqft
last 12 mo · ≤1 miLoading sold comps…