 Fourplex
18321 NE Wasco St · Gresham, OR
Flood risk 4/10 · Minor
- FEMA flood zone
- X (unshaded)
- Chance of flooding over 30 yrs
- 0.22%
- Est. flood insurance / yr
- $507 – $1,088
Fire risk 1/10 · Minimal
- Est. fire insurance / yr
- $498 – $926
Heat risk 3/10 · Minor
- Hot days now (above 93°F)
- 7 days/yr
- Hot days in 30 yrs
- 15 days/yr
Wind risk 1/10 · Minimal
- Chance of severe wind over 30 yrs
- —
Air-quality risk 10/10 · Severe
- Unhealthy air days now
- 23 days/yr
- Unhealthy air days in 30 yrs
- 27 days/yr
Risk factors via First Street. Map © Google.
Why this score? — see what drove the D+ grade
The composite is a weighted blend of 9 inputs, each scored 0–100. Each bar is that input's sub-score; the figure is the points it added to the 100-point composite (weight × sub-score).
- Cash flow +14.0/30.0
- ARV discount +12.1/15.0
- DSCR +4.3/10.0
- Livability +4.0/5.0
- 1% rule +3.9/10.0
- Condition / age +2.8/5.0
- Rent growth +2.7/5.0
- Schools +2.7/10.0
- Appreciation +0.0/10.0
$629,990
🖨 Deal sheet (PDF) 📄 Offer letter ✓ Due diligence
Multi-family units
County records classify this as Multi-Family (2-4 Unit). Listing-text estimate: 4 units. confirmed
Listing remarks
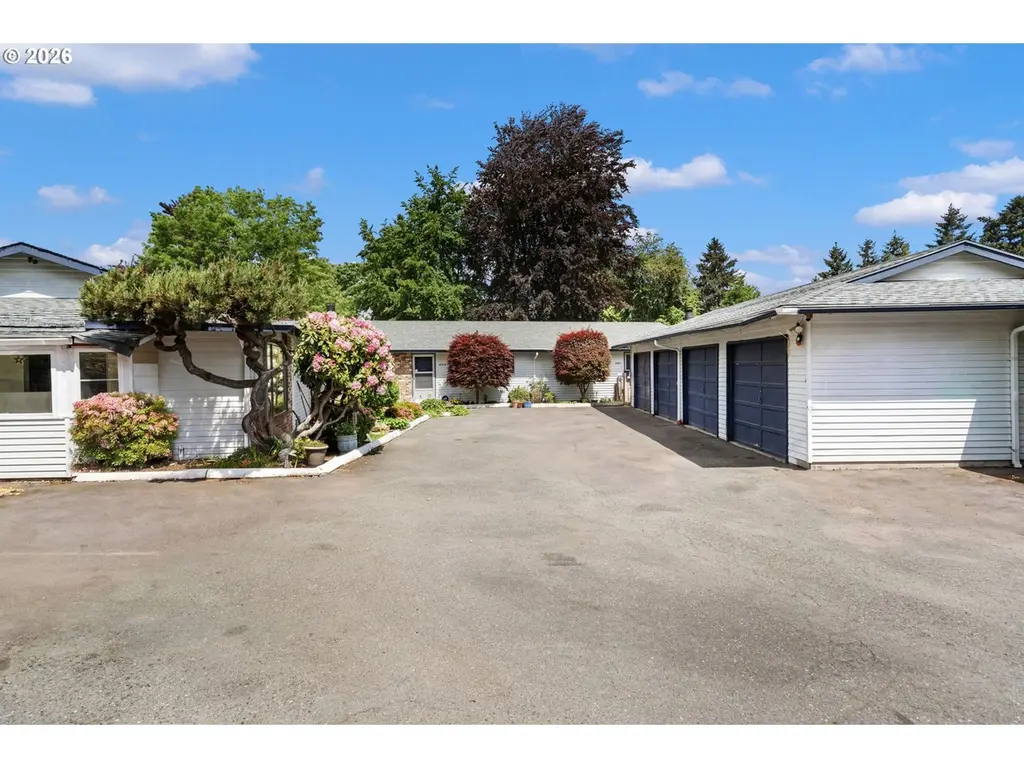
Income producing, single level fourplex in Gresham city limits with a Portland address. Four 2 bedroom, 1 bathroom, 780 sqft units, each with a fenced backyard and detached garage. Additional parking is available. Washer/dryer hookups in each unit. Newer roof. All tenants are month to month, and rent increases were completed in 2026. Excellent opportunity for an investor seeking immediate income with future flexibility. This is the investment opportunity you've been waiting for! Portland address but located in Gresham city limits. This is the investment opportunity you've been waiting for!
Key facts
- Newer roof
- Additional parking
- Washer dryer hookups
Tags
Property features AI
Finance
- Other: Lot approximately 0.32 acres
- Financial info: Property contains 4 rental units; Unit rents currently listed as: $1,320; $1,150; $1,400; $1,350; Gross rent multiplier: 10.5; Rent includes water, sewer, and trash collection
- HOA & community: Zoned MDR-12
Exterior
- Parking: Total parking for 6 vehicles; 4-car garage
- Utilities: Public water; Public sewer; Electric service
- Home design: Multi-family property; Detached building; Built in 1978
- Construction: Composition roof; Concrete perimeter foundation
- Exterior features: Brick and wood siding exterior; Level lot; Paved road access
Interior
- Kitchen: Each unit includes a range; Each unit includes a dishwasher
- Bedrooms: Four 2-bedroom units (each unit listed as 2 beds)
- Bathrooms: Each unit has 1 bathroom
- Heating & cooling: Baseboard heating; No central cooling
- Interior features: Garage storage
- Laundry & utility: Each unit has washer/dryer hookup; Electric hot water
Neighborhood map
What this means for you Summary
Snapshot
- This is a 4 × 2-bed/1.0-bath units multifamily listed at $630k. Condition is rated average.
Deal economics
- At list price, monthly cash flow is $84 ($1k/yr) — positive. Per door: $21/mo.
- The deal already cash-flows at list — no discount required.
- To meet the 1% rule (rent ≥ 1% of price), the offer needs to be $562k (10.8% below list).
- Recommended offer: $562k (10.8% below list) — sets the bar for 1% rule.
- Cap rate 6.5% vs local median 2.8% in Gresham — top-decile yield for the area; either an underpriced asset or a hidden risk that comps aren't pricing in. Stress-test before assuming the spread holds.
Location & tenants
- Location reads 81/100 on livability (#51 in OR, #1,537 nationally) — a professional / high-income tenant draw. Strengths: amenities A+, commute A+, health & safety A+; Watch: cost of living D, crime D-.
- Reynolds SD 7 (suburban): math 21% / reading 36% proficiency, ranked #162 of 183 in OR (top 88%) — low school quality limits family demand, transient renter base, plan for 1-2y turnover; 66% free/reduced lunch — lower-income household profile, screen leases tightly.
- Zoned schools: Wilkes Elementary School (443 students, 100% FRL); Hauton B Lee Middle School (651 students, 101% FRL); Reynolds High School (2,474 students, 67% FRL) — zoned schools average 89% FRL vs 66% district-wide (23 pts higher); higher-poverty schools than district average — tighter screening recommended.
- Market conditions: Rents flat; 213 active listings in the ZIP; solid renter incomes; 2,041 units permitted in Multnomah County in 2024 (905 in 5+ unit buildings).
- At $5,617/mo this rent would consume 89% of the median local household income ($76k/yr) (locally 2200% of renters already pay >50% of income on rent) — very limited rent-growth headroom before tenants either downsize or default.
Forward outlook
- Local home prices are declining (-3.0%/yr); year-one equity from $4k of loan paydown is wiped out by about $19k of value loss. Plan a longer hold.
- Multnomah County population projected at +33% by 2050 — long-run rental-demand tailwind backs the buy-and-hold thesis.
Negotiation context
- It's been on market 15 days — a 2% lower offer ($621k) is reasonable based on typical stale-listing flexibility.
Questions for the listing agent
- Can we see the unit-by-unit rent roll, current vacancy, and any below-market leases? What's the average tenancy length?
- What capital expenditures (roof, boiler, parking lot, exteriors) have been made in the last 5 years, and what's planned in the next 2?
- Built in 1978 — when were the roof, HVAC, electrical panel, plumbing, and water heater last replaced?
- Is there a deadline driving the sale (1031 exchange, divorce, estate, relocation)? That informs how much negotiation room exists.
- Crime grade is D in this area — have there been break-ins, vandalism, or insurance claims at this property in the last 3 years? What carrier currently insures it and at what premium?
- The area grade is low — what's the realistic commute time and amenity access for the typical tenant pool here? Any planned neighborhood developments (good or bad) we should know about?
- What's the average days-on-market for RENTAL listings here right now (not sales)? A rising rental-DOM trend means longer vacancies and softer asking-rent achievability than the comps imply.
- What's the recent tenant-quality profile in this submarket — average credit score on applications, eviction rate, late-payment / NSF rate, and stable-employment percentage? A property-management company in the area should have these aggregated.
- How much new apartment / multifamily construction is in the pipeline within 1–3 miles? Heavy new supply (>2% of stock underway) typically softens rents 12–24 months out; light construction supports rent growth.
Investment metrics
- 1% rule
- 0.89% ✗
- Cap rate
- 6.45%
- Cash-on-cash
- 0.57%
- DSCR
- 1.03
- GRM
- 9.3
CMA / ARV
- ARV (on-the-fly)
- $702,000
- Comps found
- 3
Show comp detail 3 sales within ~0.75 mi
| Address | Dist | Beds/Ba | Sqft | Sold | Price | $/sf | Match |
|---|---|---|---|---|---|---|---|
| 1243 NE 183rd Ave | 0.07mi | 8/4.0 | 3,120 (0%) | 20mo | $685,000 | $220 | 80 |
| 903 NE 183rd Ave | 0.23mi | 8/4.0 | 3,328 (+7%) | 15mo | $850,000 | $255 | 66 |
| 1317 NE 183rd Ave | 0.07mi | 9/5.0 (+1) | 3,380 (+8%) | 18mo | $760,000 | $225 | 59 |
Match score weights: distance 35% · size 25% · config 20% · recency 20%. Top-matched comps best support the ARV.
Projected returns pro-forma
-3.0% appreciation · 0.99% rent growth · sell at horizon
- IRR
- -17.7%
- Equity multiple
- 0.39×
- Total profit
- $-107,806
- Equity at exit
- $93,934
- IRR
- -14.1%
- Equity multiple
- 0.26×
- Total profit
- $-130,559
- Equity at exit
- $54,470
Cash invested: $176,397 (down + closing). Projections, not guarantees.
Landlord ↔ Tenant lean methodology
- Overall (STATE)
- 28 Tenant-Leaning
- State Oregon
- 28 Tenant-Leaning · D+6
- County
- — inherits STATE
- City
- — inherits STATE
ZIP-level market 97230
- Rents YoY
- 1.0%
- Active inventory
- 213
- Price-to-rent
- 37.4×
Monthly cashflow live
- Estimated rent
- $5,617 high interval (Pro) →
- Mortgage (P&I)
- −$3,304
- Tax est. 1.5%
- −$787 /mo · $9,450/yr
- Insurance
- −$262
- HOA
- −$0
- Vacancy / Maint / Mgmt
- −$1,180
- Net cashflow
- $84
Break-even live
Sensitivity live
| Price | -10% $519 | -5% $301 | +0% $84 | +5% $-134 | +10% $-352 |
|---|---|---|---|---|---|
| Rent | -10% $-360 | -5% $-138 | +0% $84 | +5% $306 | +10% $527 |
| Rate | -1.0pp $401 | -0.5pp $244 | base $84 | +0.5pp $-80 | +1.0pp $-246 |
4-unit breakdown (identical units grouped — click to expand)
| Units | Beds | Baths | Est. rent |
|---|---|---|---|
| 4× units | 2 | 1 | $5,616 |
| #1 | 2 | 1 | $1,404 |
| #2 | 2 | 1 | $1,404 |
| #3 | 2 | 1 | $1,404 |
| #4 | 2 | 1 | $1,404 |
| Total (4 units) | $5,617 | ||
UW: 25.0% down · 7.5% · 30yr · 1.5% tax · 5.0% vac · 8.0% maint · 8.0% mgmt
Financing live
Cash to close
- Down payment
- $157,498
- Closing costs
- $18,900
- Reserves months
- —
- Total cash needed
- —
Loan-product check · same deal, 3 products live
Conventional
25% down · 7.5% · 30yr
- Down + closing
- —
- Monthly P&I
- —
- Monthly cashflow
- —
- DSCR
- —
- Eligible?
- —
Personal DTI + credit; lowest rate.
DSCR
20% down · 8.5% · 30yr
- Down + closing
- —
- Monthly P&I
- —
- Monthly cashflow
- —
- DSCR
- —
- Eligible?
- —
No personal income docs; deal must DSCR.
Hard money
10% down · 12.0% · 12mo
- Down + closing
- —
- Monthly P&I
- —
- Monthly cashflow
- —
- DSCR
- —
- Eligible?
- —
Short-term bridge; refi at stabilization.
Listing history 11 events
-
2026-06-21statusdays on market $629,990 Pending 15 DOM
-
2026-06-18days on market $629,990 Active 13 DOM
-
2026-06-17days on market $629,990 Active 12 DOM
-
2026-06-16days on market $629,990 Active 11 DOM
-
2026-06-15days on market $629,990 Active 10 DOM
-
2026-06-13days on market $629,990 Active 8 DOM
-
2026-06-13days on market $629,990 Active 7 DOM
-
2026-06-09days on market $629,990 Active 4 DOM
-
2026-06-08days on market $629,990 Active 3 DOM
-
2026-06-07remarks 596-char remark
-
2026-06-07$629,990 Active 2 DOM
ⓘ Source: listings_history table (triggers on properties + properties_extension) + one-shot
backfill from property_details.listing_events for pre-trigger history.
Climate risk First Street
- Flood 4/10 Moderate FEMA zone X (unshaded) · 22% chance over 30 yrs
- Wildfire 1/10 Low
- Heat 3/10 Moderate 7 d/yr ≥93°F today · 15 d/yr by 30 yrs out
- Wind 1/10 Low
- Air quality 10/10 Extreme 23 unhealthy d/yr today · 27 by 30 yrs out
Nearby sold comps map
Loading sold comps map…
Walkable amenities ~0.75 mi
Loading nearby amenities…
Taxation est. · year 1
- Rental income
- $67,404
- − Mortgage interest
- −$35,289
- − Property taxes
- −$9,450
- − Insurance
- −$3,150
- − Repairs & maintenance
- −$5,392
- − Management
- −$5,392
- − Depreciation
- −$18,327
- Taxable loss
- −$9,597
- Est. tax savings @ 24.0%
- +$2,303
- After-tax cash flow
- $3,308/yr
For passive investors: Depreciation is non-cash, so a rental often shows a tax loss while cash-flowing — sheltering income. Rental losses are passive: they offset passive income freely, and up to $25,000/yr can offset ordinary (W-2) income if you actively participate and your MAGI is under $100k (phasing out to $0 by $150k); unused losses carry forward. On sale, claimed depreciation is recaptured at up to 25%, and gains may owe capital-gains tax (a 1031 exchange can defer both). Figures are a year-1 estimate at your 24.0% rate — not tax advice; consult a CPA.
Condition & rehab AI · 13 photos
The property is in average condition with some minor repairs and maintenance needed. Landscaping and garden maintenance would significantly enhance its value.
Repairs flagged
- Minor Landscaping — Some areas of the landscaping appear overgrown and could benefit from trimming and maintenance.
- Minor Dead plants — Some dead plants are visible in the landscaping, which could be removed for a more aesthetically pleasing appearance.
Value-add opportunities
- Both Landscaping and garden maintenance — A well-maintained and aesthetically pleasing landscaping can enhance both the resale and rental value of the property.
Renovation cost estimate screening
| Repair item | Severity | Est. cost |
|---|---|---|
| Landscaping · Some areas of the landscaping appear overgrown and could benefit from trimming and maintenance. | Minor | $500–3,000 |
| Dead plants · Some dead plants are visible in the landscaping, which could be removed for a more aesthetically pleasing appearance. | Minor | $500–3,000 |
| Total estimated repair cost · 2 items | $1,000–6,000 |
Value-add ROI direction
- Both Landscaping and garden maintenance — A well-maintained and aesthetically pleasing landscaping can enhance both the resale and rental value of the property. ↑
ⓘ Cost ranges are severity-bucket heuristics (US national rule-of-thumb). Get contractor quotes + a written scope before underwriting a rehab budget.
Schools (NCES district)
- District
- Reynolds SD 7
- NCES district ID
- 4110520
- Math proficiency
- 21% ▬ 0.00%
- Reading proficiency
- 36% ▬ 0.00%
- Median HH income
- $45,502
- Composite
- 27.4/100
- National rank
- #12399
- State rank
- #162 of 183 in OR
Livability — Gresham
- Score
- 81/100
- State rank
- #51
- US rank
- #1537
Category grades
Schools grade is shown separately in the Schools card above.
Census & demographics
- Census place
- Gresham, OR
- County
- Multnomah County · 786,692 people
- City population
- 86,119
- Metro
- Portland-Vancouver-Hillsboro, OR-WA
- Population (ZIP)
- 43,553
- Household income
- $75,572
- Rent vs Own
- Severe rent burden
- 2200.0
Population outlook (Multnomah County) Hauer SSP2
- Today (2025)
- 930,825 people
- By 2030
- 996,904 · +7.1%
- By 2040
- 1,121,379 · +20.5%
- By 2050
- 1,242,124 · +33.4%
- By 2075
- 1,464,431 · +57.3%
- By 2100
- 1,576,181 · +69.3%
Race, ethnicity, and origin ACS 2023
- Neighborhood character
- Diverse neighborhood (Simpson 0.69)
- Race & ethnicity
- White 49% Hispanic / Latino 20% Two or more races 15% Asian 11% Black 10% Pacific Islander 2%
- Hispanic origin (detail)
- Mexican 16%
- Common ancestry
- Portuguese 3% Slovak 2% Italian 2%
- Foreign-born
- 21% · Canada, Vietnam, China
- Languages at home
- 70% English-only · Spanish 15% Vietnamese 3% Other Asian/Pacific 3%
Political lean MEDSL · Multnomah
- 2024 margin
- Solid D (+62.1) · D 79.3% · R 17.2% · Other 3.5%
- 2008→2024 swing
- +6.0pp toward D · 2008: 56.1pp · 2024: 62.1pp
- All cycles
- 2024: D+62.1 2020: D+61.3 2016: D+58.3 2012: D+54.9 2008: D+56.1
Not yet ingested
- Civics
- —
Market trends
- HPI YoY
- ▼ -409.12%
- Current HPI
- 287.2227
- Rent YoY
- ▲ 0.99%
- Metro
- Portland-Vancouver-Hillsboro, OR-WA
- State GDP YoY
- ▲ 2.05%
- F500 in state
- 2
Industry mix (Fortune 500 HQ in OR)
| Industry | F500 HQs | Revenue |
|---|---|---|
| Consumer Goods | 1 | $51B |
|
||
Price history
1 event — show timeline
- 2026-06-05 Listed $629,990 RMLS
Cash-flow waterfall
monthlySold comps — $/sqft
last 12 mo · ≤1 miLoading sold comps…