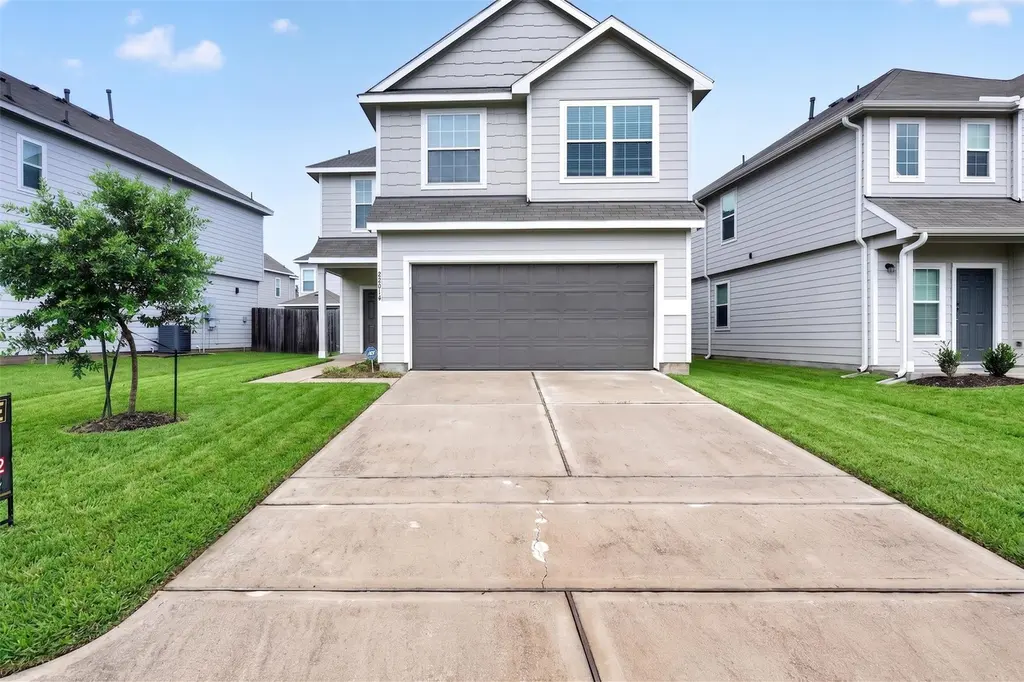
22014 Sovereign Heights Ln · Houston, TX
Flood risk 1/10 · Minimal
- FEMA flood zone
- X (unshaded)
- Chance of flooding over 30 yrs
- 0.0%
- Est. flood insurance / yr
- $507 – $1,088
Fire risk 1/10 · Minimal
- Est. fire insurance / yr
- $1,222 – $2,270
Heat risk 9/10 · Severe
- Hot days now (above 111°F)
- 7 days/yr
- Hot days in 30 yrs
- 22 days/yr
Wind risk 9/10 · Severe
- Chance of severe wind over 30 yrs
- 99.0%
Air-quality risk 3/10 · Minor
- Unhealthy air days now
- 3 days/yr
- Unhealthy air days in 30 yrs
- 3 days/yr
Risk factors via First Street. Map © Google.
Why this score? — see what drove the F grade
The composite is a weighted blend of 9 inputs, each scored 0–100. Each bar is that input's sub-score; the figure is the points it added to the 100-point composite (weight × sub-score).
- Cash flow +7.3/30.0
- Appreciation +4.7/10.0
- Livability +3.7/5.0
- 1% rule +3.4/10.0
- Rent growth +2.7/5.0
- Condition / age +2.5/5.0
- Schools +2.0/10.0
- ARV discount +1.6/15.0
- DSCR +1.5/10.0
$264,950
🖨 Deal sheet (PDF) 📄 Offer letter ✓ Due diligence
Listing remarks MLS
Professional pictures coming soon. Don’t miss this stunning 2-story home in Imperial Heights, Houston, TX! Whether you’re a homeowner searching for a great deal in a desirable neighborhood or a rental property investor looking for a strong long-term opportunity, this home is worth seeing. The Devonhurst floor plan features 4 bedrooms, 2.5 bathrooms, and a 2-car garage with a move-in ready layout designed for comfort and function. The open-concept first floor is perfect for entertaining, with a modern peninsula kitchen, granite countertops, 42-inch cabinets, stainless steel appliances, blinds, and plenty of workspace. Upstairs, all bedrooms offer privacy, including a spacious Owner’s Suite with a soaking tub, separate shower, and walk-in closet. Enjoy the covered patio and fully landscaped yard, perfect for relaxing or attracting quality tenants. Homes like this do not sit long. Schedule your private showing today!
Key facts
- 3,641 sq ft lot
- 2 garage spots
- Built 2022
Neighborhood map
What this means for you Summary
Snapshot
- This is a 4-bed/2.5-bath single-family listed at $265k.
Deal economics
- At list price, monthly cash flow is $-352 ($-4k/yr) — negative.
- To cash-flow at today's rent, offer at most $203k (23.5% below list).
- To meet the 1% rule (rent ≥ 1% of price), the offer needs to be $222k (16.2% below list).
- Recommended offer: $203k (23.5% below list) — sets the bar for cash-flow.
- Cap rate 4.7% vs local median 3.2% in Houston — top-decile yield for the area; either an underpriced asset or a hidden risk that comps aren't pricing in. Stress-test before assuming the spread holds.
Location & tenants
- Location reads 74/100 on livability (#184 in TX, #4,771 nationally) — a middle-class / working-renter tenant base. Strengths: amenities A+, cost of living A+, housing A+; Watch: crime F.
- Spring ISD (suburban): math 19% / reading 26% proficiency, ranked #730 of 826 in TX (top 88%) — low school quality limits family demand, transient renter base, plan for 1-2y turnover; 66% free/reduced lunch — lower-income household profile, screen leases tightly.
- Zoned schools: Carolee Booker Elementary (math 24% / reading 23%, grade F, #3,247 of 4,322 statewide, top 76%, 765 students, 91% FRL); Rickey C Bailey Middle (math 15% / reading 23%, grade F, #1,466 of 1,662 statewide, top 89%, 1,065 students, 85% FRL); Spring H S (math 12% / reading 21%, grade F, #1,497 of 1,632 statewide, top 92%, 2,760 students, 72% FRL) — zoned schools average 83% FRL vs 66% district-wide (16 pts higher); higher-poverty schools than district average — tighter screening recommended.
- Market conditions: Rents flat; 162 active listings in the ZIP; 1 comparable units currently listed for rent nearby; solid renter incomes; 29,883 units permitted in Harris County in 2024 (8,621 in 5+ unit buildings).
- This rent runs 34% of the median local income ($79k/yr) — at the standard rent-burdened threshold; future hikes will face affordability resistance.
Forward outlook
- In year one you build about $36 of equity ($2k loan paydown + $-2k appreciation (-0.7% local appreciation)).
- Harris County population projected at +47% by 2050 — long-run rental-demand tailwind backs the buy-and-hold thesis.
Negotiation context
- Only 5 days on market — expect competitive offers; lowballing is unlikely to land.
- 3 sale attempts since 3y ago with the ask held roughly flat each time — persistent listings suggest the price (not the market) is what's stuck; bring a comps-based counter.
Risks & watch-outs
- Watch-outs: property tax is 2.6% of price.
- Climate carrying-cost: severe wind risk, 99% chance of damaging wind over 30y; extreme-heat days projected 7→22/yr by 2055 (HVAC capex compounding) — expect insurance premiums to compound above CPI over the hold.
Questions for the listing agent
- What do current leases actually rent for vs. the listed asking? Can we see a recent rent roll and the last 12 months of T-12 income?
- Property tax is high relative to price — has the assessment been appealed recently, and will the sale trigger a re-assessment?
- What does the HOA fee cover, when was the last increase, and are there any pending special assessments or reserve-fund shortfalls?
- Is there a deadline driving the sale (1031 exchange, divorce, estate, relocation)? That informs how much negotiation room exists.
- Schools are D-rated, which usually means shorter tenancies and higher turnover. Who's the typical renter profile here, and what's been the actual vacancy rate?
- Crime grade is F in this area — have there been break-ins, vandalism, or insurance claims at this property in the last 3 years? What carrier currently insures it and at what premium?
- The area grade is low — what's the realistic commute time and amenity access for the typical tenant pool here? Any planned neighborhood developments (good or bad) we should know about?
- What's the average days-on-market for RENTAL listings here right now (not sales)? A rising rental-DOM trend means longer vacancies and softer asking-rent achievability than the comps imply.
- What's the recent tenant-quality profile in this submarket — average credit score on applications, eviction rate, late-payment / NSF rate, and stable-employment percentage? A property-management company in the area should have these aggregated.
- How much new for-sale + rental construction is in the pipeline within 1–3 miles? Heavy new supply typically softens prices + rents 12–24 months out; constrained supply supports both.
Investment metrics
- 1% rule
- 0.84% ✗
- Cap rate
- 4.70%
- Cash-on-cash
- -5.70%
- DSCR
- 0.75
- GRM
- 9.9
CMA / ARV
- ARV (on-the-fly)
- $234,377
- Comps found
- 12
Show comp detail 12 sales within ~0.75 mi
| Address | Dist | Beds/Ba | Sqft | Sold | Price | $/sf | Match |
|---|---|---|---|---|---|---|---|
| 914 Redcrest Springs Ct | 0.35mi | 3/2.5 (-1) | 1,946 (+0%) | 4mo | $220,000 | $113 | 74 |
| 22107 King Heights Ln | 0.06mi | 4/2.5 | 1,673 (-14%) | 1mo | $270,000 | $161 | 73 |
| 22215 Queenbury Hills Dr | 0.19mi | 4/2.5 | 2,152 (+11%) | 2mo | $259,990 | $121 | 71 |
| 927 Redcrest Springs Ct | 0.37mi | 3/2.5 (-1) | 1,991 (+3%) | 8mo | $224,000 | $113 | 66 |
| 1442 Oxford Meadow Dr | 0.30mi | 3/2.5 (-1) | 2,098 (+8%) | 4mo | $239,900 | $114 | 64 |
| 1010 Willow West Dr | 0.34mi | 3/2.5 (-1) | 1,760 (-9%) | 2mo | $240,000 | $136 | 62 |
| 915 N Oak Dr | 0.37mi | 4/2.5 | 1,730 (-11%) | 5mo | $249,500 | $144 | 61 |
| 22238 Queenbury Hills Dr | 0.26mi | 4/2.5 | 2,221 (+15%) | 4mo | $250,000 | $113 | 60 |
| 747 Oak West | 0.49mi | 3/2.5 (-1) | 1,768 (-9%) | 2mo | $259,999 | $147 | 56 |
| 1126 Wabash Elm St | 0.72mi | 4/2.5 | 1,870 (-4%) | 8mo | $220,000 | $118 | 54 |
| 16603 N Mist Dr | 0.60mi | 3/2.5 (-1) | 1,720 (-11%) | 3mo | $250,000 | $145 | 46 |
| 16527 N Mist Dr | 0.63mi | 4/2.5 | 2,200 (+14%) | 5mo | $249,900 | $114 | 44 |
Match score weights: distance 35% · size 25% · config 20% · recency 20%. Top-matched comps best support the ARV.
Projected returns pro-forma
-0.68% appreciation · 0.69% rent growth · sell at horizon
- IRR
- -13.5%
- Equity multiple
- 0.42×
- Total profit
- $-43,354
- Equity at exit
- $68,074
- IRR
- -9.1%
- Equity multiple
- 0.19×
- Total profit
- $-59,944
- Equity at exit
- $75,055
Cash invested: $74,186 (down + closing). Projections, not guarantees.
Landlord ↔ Tenant lean methodology
- Overall (STATE)
- 87 Strongly Landlord-Friendly
- State Texas
- 87 Strongly Landlord-Friendly · R+5
- County
- — inherits STATE
- City
- — inherits STATE
ZIP-level market 77073
- Home prices YoY
- -0.3%
- Rents YoY
- 0.7%
- Active inventory
- 162
- Price-to-rent
- 9.9×
Monthly cashflow live
- Estimated rent
- $2,220 medium interval (Pro) →
- Mortgage (P&I)
- −$1,389
- Tax from tax record
- −$571 /mo · $6,855/yr
- Insurance
- −$110
- HOA
- −$35
- Vacancy / Maint / Mgmt
- −$466
- Net cashflow
- $-352
Break-even live
Sensitivity live
| Price | -10% $-202 | -5% $-277 | +0% $-352 | +5% $-427 | +10% $-502 |
|---|---|---|---|---|---|
| Rent | -10% $-528 | -5% $-440 | +0% $-352 | +5% $-265 | +10% $-177 |
| Rate | -1.0pp $-219 | -0.5pp $-285 | base $-352 | +0.5pp $-421 | +1.0pp $-491 |
UW: 25.0% down · 7.5% · 30yr · 1.5% tax · 5.0% vac · 8.0% maint · 8.0% mgmt
Financing live
Cash to close
- Down payment
- $66,238
- Closing costs
- $7,948
- Reserves months
- —
- Total cash needed
- —
Loan-product check · same deal, 3 products live
Conventional
25% down · 7.5% · 30yr
- Down + closing
- —
- Monthly P&I
- —
- Monthly cashflow
- —
- DSCR
- —
- Eligible?
- —
Personal DTI + credit; lowest rate.
DSCR
20% down · 8.5% · 30yr
- Down + closing
- —
- Monthly P&I
- —
- Monthly cashflow
- —
- DSCR
- —
- Eligible?
- —
No personal income docs; deal must DSCR.
Hard money
10% down · 12.0% · 12mo
- Down + closing
- —
- Monthly P&I
- —
- Monthly cashflow
- —
- DSCR
- —
- Eligible?
- —
Short-term bridge; refi at stabilization.
Rent comps 1 comps
| Address | Beds | Baths | Sqft | Rent | $/sqft | DOM | Units | Dist |
|---|---|---|---|---|---|---|---|---|
| 1430 Great Easton Ln Houston, TX | 3.0 | 2.0 | 1568 | $1,825 | $1.16 | 0d | 1 | 0.57mi |
HOA detail
- Monthly dues
- $35 · $420/yr
Listing history 4 events
-
2026-06-21days on market $264,950 Active 5 DOM
-
2026-06-18days on market $264,950 Active 2 DOM
-
2026-06-17remarks 687-char remark
-
2026-06-17$264,950 Active 1 DOM
ⓘ Source: listings_history table (triggers on properties + properties_extension) + one-shot
backfill from property_details.listing_events for pre-trigger history.
Tax reassessment forecast TX · Resets to sale price
- Current annual tax
- $6,855 · $571/mo
- Projected year-2 tax
- $6,855 · $571/mo
- Expected delta
- $0/yr ($0/mo · 0.0%)
ⓘ Screening estimate from a state-policy table — verify with the county assessor before closing.
Climate risk First Street
- Flood 1/10 Low FEMA zone X (unshaded) · 0% chance over 30 yrs
- Wildfire 1/10 Low
- Heat 9/10 Extreme 7 d/yr ≥111°F today · 22 d/yr by 30 yrs out
- Wind 9/10 Extreme 99% chance of damaging wind over 30 yrs
- Air quality 3/10 Moderate 3 unhealthy d/yr today · 3 by 30 yrs out
Nearby sold comps map
Loading sold comps map…
Walkable amenities ~0.75 mi
Loading nearby amenities…
Taxation est. · year 1
- Rental income
- $26,641
- − Mortgage interest
- −$14,841
- − Property taxes
- −$6,855
- − Insurance
- −$1,325
- − Repairs & maintenance
- −$2,131
- − Management
- −$2,131
- − HOA
- −$420
- − Depreciation
- −$7,708
- Taxable loss
- −$8,771
- Est. tax savings @ 24.0%
- +$2,105
- After-tax cash flow
- $-2,122/yr
For passive investors: Depreciation is non-cash, so a rental often shows a tax loss while cash-flowing — sheltering income. Rental losses are passive: they offset passive income freely, and up to $25,000/yr can offset ordinary (W-2) income if you actively participate and your MAGI is under $100k (phasing out to $0 by $150k); unused losses carry forward. On sale, claimed depreciation is recaptured at up to 25%, and gains may owe capital-gains tax (a 1031 exchange can defer both). Figures are a year-1 estimate at your 24.0% rate — not tax advice; consult a CPA.
Schools (NCES district)
- District
- Spring ISD
- NCES district ID
- 4841220
- Math proficiency
- 19% ▼ -13.00%
- Reading proficiency
- 26% ▼ -6.00%
- Median HH income
- $51,584
- Composite
- 20.12/100
- National rank
- #8643
- State rank
- #730 of 826 in TX
Livability — Houston
- Score
- 74/100
- State rank
- #184
- US rank
- #4771
Category grades
Schools grade is shown separately in the Schools card above.
Census & demographics
- County
- Harris County · 4,702,590 people
- City population
- 3,226,434
- Metro
- Houston-The Woodlands-Sugar Land, TX
- Population (ZIP)
- 46,084
- Household income
- $78,592
- Rent vs Own
- Severe rent burden
- 1297.0
Population outlook (Harris County) Hauer SSP2
- Today (2025)
- 5,571,493 people
- By 2030
- 6,089,821 · +9.3%
- By 2040
- 7,142,806 · +28.2%
- By 2050
- 8,185,864 · +46.9%
- By 2075
- 10,574,329 · +89.8%
- By 2100
- 12,109,958 · +117.4%
Race, ethnicity, and origin ACS 2023
- Neighborhood character
- Diverse neighborhood (Simpson 0.57)
- Race & ethnicity
- Hispanic / Latino 59% Black 27% Two or more races 24% White 9% Native American 2% Asian 2%
- Hispanic origin (detail)
- Mexican 38% Cuban 2%
- Common ancestry
- Lithuanian 1%
- Foreign-born
- 29% · Canada, Jamaica
- Languages at home
- 44% English-only · Spanish 53% French/Haitian/Cajun 2% Other Indo-European 1%
Political lean MEDSL · Harris
- 2024 margin
- Lean D (+5.5) · D 52.0% · R 46.4% · Other 1.6%
- 2008→2024 swing
- +3.9pp toward D · 2008: 1.6pp · 2024: 5.5pp
- All cycles
- 2024: D+5.5 2020: D+13.3 2016: D+12.4 2012: D+0.1 2008: D+1.6
Not yet ingested
- Civics
- —
Market trends
- HPI YoY
- ▼ -0.68%
- Current HPI
- 215.8688
- Rent YoY
- ▲ 0.69%
- Metro
- Houston-The Woodlands-Sugar Land, TX
- State GDP YoY
- ▲ 3.95%
- F500 in state
- 110
Industry mix (Fortune 500 HQ in TX)
| Industry | F500 HQs | Revenue |
|---|---|---|
| Energy | 16 | $1,198B |
|
||
| Technology | 5 | $198B |
|
||
| Engineering / Construction | 4 | $72B |
|
||
| Energy Services | 3 | $60B |
|
||
| Utilities | 3 | $41B |
|
||
| Healthcare | 2 | $330B |
|
||
Price history
+11943.2% since first listed5 events — show timeline
- 2026-06-16 Listed $264,950 HARMLS
- 2023-09-20 Rental Removed $2,200 HARMLS
- 2023-09-12 Listed for Rent $2,200 HARMLS
- 2023-09-10 Listing Removed — HARMLS
- 2023-09-10 Listed $2,200 HARMLS
Property tax history
+170.1%/yrLatest (2025): $6,855 · +1.3% YoY. Source: county tax records.
Cash-flow waterfall
monthlySold comps — $/sqft
last 12 mo · ≤1 miLoading sold comps…