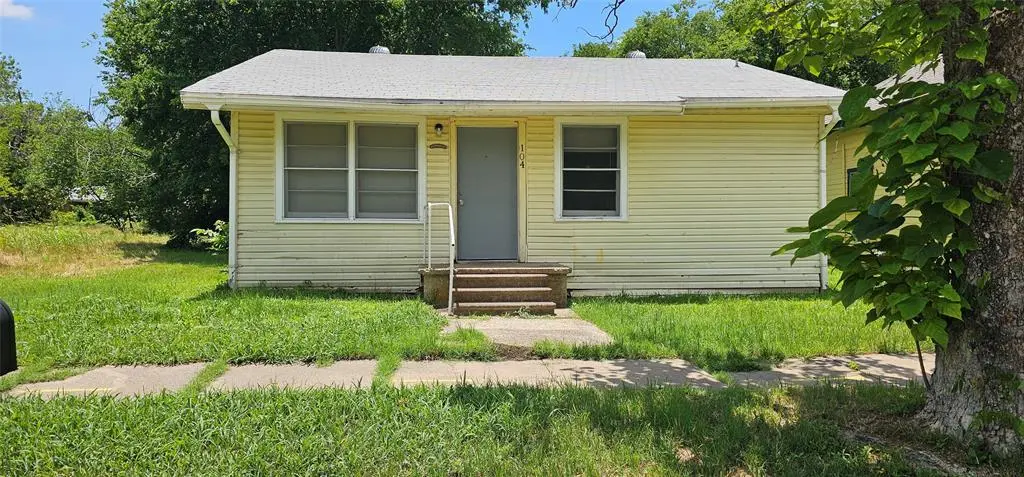
104 Smith St · Hillsboro, TX
Flood risk 1/10 · Minimal
- FEMA flood zone
- X (unshaded)
- Chance of flooding over 30 yrs
- 0.0%
- Est. flood insurance / yr
- $507 – $1,088
Fire risk 4/10 · Minor
- Est. fire insurance / yr
- $1,222 – $2,270
Heat risk 7/10 · Major
- Hot days now (above 108°F)
- 7 days/yr
- Hot days in 30 yrs
- 23 days/yr
Wind risk 6/10 · Moderate
- Chance of severe wind over 30 yrs
- 27.0%
Air-quality risk 2/10 · Minimal
- Unhealthy air days now
- 1 days/yr
- Unhealthy air days in 30 yrs
- 1 days/yr
Risk factors via First Street. Map © Google.
Why this score? — see what drove the B- grade
The composite is a weighted blend of 9 inputs, each scored 0–100. Each bar is that input's sub-score; the figure is the points it added to the 100-point composite (weight × sub-score).
- Cash flow +26.9/30.0
- ARV discount +15.0/15.0
- DSCR +9.3/10.0
- 1% rule +6.9/10.0
- Schools +3.5/10.0
- Livability +3.2/5.0
- Rent growth +2.5/5.0
- Condition / age +2.5/5.0
- Appreciation +0.0/10.0
$79,000
🖨 Deal sheet 📄 Offer letter ✓ Due diligence
Listing remarks
2 bedroom 1 bath home with some updates. Home features include carpeted living and bedroom areas, laminate flooring in kitchen, washer and dryer hookups, and a gas tankless water heater. Ideal for buyers seeking an affordable and manageable home under 800 sq ft with minimal yard to maintain. Sold AS IS. Schedule a showing to see it for yourself!
Key facts
- Laminate flooring
- 1,960 sq ft lot
- Listed 17 days
Tags
Property features AI
Finance
- Other: Closing/funding possession; Standard listing conditions
- Financial info: Listing available for cash and conventional terms
- HOA & community: No association; Community has curbs and sidewalks
Exterior
- Parking: On-street parking
- Utilities: City sewer; City water; Curbs; Sidewalk
- Home design: Single-family residence; One story; Not attached to another property; Deed restrictions
- Construction: Wood construction; Composition roof; Pillar/post/pier foundation; Year built not specified
- Exterior features: Gutters; Interior lot; Utilities easement
Interior
- Kitchen: Plumbed for gas in kitchen; Tankless water heater
- Bedrooms: Primary bedroom on main level (approx. 15 x 12); Second bedroom on main level (approx. 12 x 6)
- Flooring: Carpet; Laminate
- Bathrooms: One full bathroom on main level (approx. 7 x 5)
- Heating & cooling: Ceiling fan(s); No built-in heating system listed
- Interior features: High speed internet available; Paneling; One living area; Four total rooms
- Laundry & utility: Washer hookup; Gas dryer hookup; Other laundry features
Neighborhood map
What this means for you Summary
Snapshot
- This is a 2-bed/1.0-bath single-family listed at $79k.
Deal economics
- At list price, monthly cash flow is $218 ($3k/yr) — positive.
- The deal already cash-flows at list — no discount required.
- Meets the 1% rule at list price ($940 rent vs $79k).
- Recommended offer: $78k (1.5% below list) — sets the bar for market timing.
- Cap rate 9.6% vs local median 3.7% in Hillsboro — top-decile yield for the area; either an underpriced asset or a hidden risk that comps aren't pricing in. Stress-test before assuming the spread holds.
Location & tenants
- Location reads 64/100 on livability (#803 in TX) — a middle-class / working-renter tenant base. Strengths: cost of living A+, housing A+, crime B+; Watch: amenities F, commute F, employment D-.
- Hillsboro ISD (town): math 46% / reading 39% proficiency, ranked #370 of 826 in TX (top 45%) — families likely to look elsewhere, expect single-tenant / working-renter base with shorter leases; 71% free/reduced lunch — lower-income household profile, screen leases tightly.
- Zoned schools: Hillsboro El (704 students, 74% FRL) — zoned schools at 74% FRL track the district average.
- Market conditions: 156 active listings in the ZIP; 2 comparable units currently listed for rent nearby; 65 units permitted in Hill County in 2024 (0 in 5+ unit buildings).
Forward outlook
- Local home prices are declining (-3.0%/yr); year-one equity from $546 of loan paydown is wiped out by about $2k of value loss. Plan a longer hold.
- Hill County population projected at -12% by 2050 — secular population decline; favor cash flow + early exit over multi-decade hold.
- At projected returns (-3.0% appreciation + 3.0% rent growth), your $22k cash investment doubles in ~10 years — after that, you're playing with house money.
Negotiation context
- It's been on market 18 days — a 2% lower offer ($78k) is reasonable based on typical stale-listing flexibility.
Risks & watch-outs
- Climate carrying-cost: major wind risk, 27% chance of damaging wind over 30y; extreme-heat days projected 7→23/yr by 2055 (HVAC capex compounding) — expect insurance premiums to compound above CPI over the hold.
Questions for the listing agent
- Is there a deadline driving the sale (1031 exchange, divorce, estate, relocation)? That informs how much negotiation room exists.
- Schools are F-rated, which usually means shorter tenancies and higher turnover. Who's the typical renter profile here, and what's been the actual vacancy rate?
- What's the average days-on-market for RENTAL listings here right now (not sales)? A rising rental-DOM trend means longer vacancies and softer asking-rent achievability than the comps imply.
- What's the recent tenant-quality profile in this submarket — average credit score on applications, eviction rate, late-payment / NSF rate, and stable-employment percentage? A property-management company in the area should have these aggregated.
- How much new for-sale + rental construction is in the pipeline within 1–3 miles? Heavy new supply typically softens prices + rents 12–24 months out; constrained supply supports both.
Investment metrics
- 1% rule
- 1.19% ✓
- Cap rate
- 9.61%
- Cash-on-cash
- 11.85%
- DSCR
- 1.53
- GRM
- 7.0
CMA / ARV
- ARV (on-the-fly)
- $143,472
- Comps found
- 1
Show comp detail 1 sale within ~0.75 mi
| Address | Dist | Beds/Ba | Sqft | Sold | Price | $/sf | Match |
|---|---|---|---|---|---|---|---|
| 408 Peabody St | 0.70mi | 2/1.0 | 738 (-6%) | 8mo | $135,000 | $183 | 51 |
Match score weights: distance 35% · size 25% · config 20% · recency 20%. Top-matched comps best support the ARV.
Projected returns pro-forma
-3.0% appreciation · 3.0% rent growth · sell at horizon
- IRR
- 1.3%
- Equity multiple
- 1.05×
- Total profit
- $1,114
- Equity at exit
- $11,779
- IRR
- 10.9%
- Equity multiple
- 1.85×
- Total profit
- $18,890
- Equity at exit
- $6,830
Cash invested: $22,120 (down + closing). Projections, not guarantees.
Landlord ↔ Tenant lean methodology
- Overall (STATE)
- 87 Strongly Landlord-Friendly
- State Texas
- 87 Strongly Landlord-Friendly · R+5
- County
- — inherits STATE
- City
- — inherits STATE
ZIP-level market 76645
- Home prices YoY
- -33.5%
- Active inventory
- 156
- Price-to-rent
- 7.0×
Monthly cashflow live
- Estimated rent
- $940 medium interval (Pro) →
- Mortgage (P&I)
- −$414
- Tax from tax record
- −$77 /mo · $924/yr
- Insurance
- −$33
- HOA
- −$0
- Vacancy / Maint / Mgmt
- −$197
- Net cashflow
- $218
Break-even live
UW: 25.0% down · 7.5% · 30yr · 1.5% tax · 5.0% vac · 8.0% maint · 8.0% mgmt
Financing live
Cash to close
- Down payment
- $19,750
- Closing costs
- $2,370
- Reserves months
- —
- Total cash needed
- —
Loan-product check · same deal, 3 products live
Conventional
25% down · 7.5% · 30yr
- Down + closing
- —
- Monthly P&I
- —
- Monthly cashflow
- —
- DSCR
- —
- Eligible?
- —
Personal DTI + credit; lowest rate.
DSCR
20% down · 8.5% · 30yr
- Down + closing
- —
- Monthly P&I
- —
- Monthly cashflow
- —
- DSCR
- —
- Eligible?
- —
No personal income docs; deal must DSCR.
Hard money
10% down · 12.0% · 12mo
- Down + closing
- —
- Monthly P&I
- —
- Monthly cashflow
- —
- DSCR
- —
- Eligible?
- —
Short-term bridge; refi at stabilization.
Rent comps 2 comps
| Address | Beds | Baths | Sqft | Rent | $/sqft | DOM | Units | Dist |
|---|---|---|---|---|---|---|---|---|
| 208 N Church St Hillsboro, TX | 2.0 | 1.0–1.5 | 875 | $865 | $0.99 | 44d | 2 | 0.09mi |
| 119 E Walnut St Hillsboro, TX | 1.0–2.0 | 1.0 | 725 | $1,200 | $1.66 | 21d | 1 | 0.36mi |
Listing history 14 events
-
2026-06-18days on market $79,000 Active 18 DOM
-
2026-06-17days on market $79,000 Active 17 DOM
-
2026-06-16days on market $79,000 Active 16 DOM
-
2026-06-15days on market $79,000 Active 15 DOM
-
2026-06-13days on market $79,000 Active 13 DOM
-
2026-06-12days on market $79,000 Active 12 DOM
-
2026-06-10days on market $79,000 Active 9 DOM
-
2026-06-08days on market $79,000 Active 8 DOM
-
2026-06-08days on market $79,000 Active 7 DOM
-
2026-06-07days on market $79,000 Active 6 DOM
-
2026-06-03days on market $79,000 Active 3 DOM
-
2026-06-02days on market $79,000 Active 2 DOM
-
2026-05-31remarks 347-char remark
-
2026-05-31$79,000 Active 1 DOM
ⓘ Source: listings_history table (triggers on properties + properties_extension) + one-shot
backfill from property_details.listing_events for pre-trigger history.
Tax reassessment forecast TX · Resets to sale price
- Current annual tax
- $924 · $77/mo
- Projected year-2 tax
- $1,446 · $120/mo
- Expected delta
- +$522/yr (+$44/mo · 56.5%)
ⓘ Screening estimate from a state-policy table — verify with the county assessor before closing.
Climate risk First Street
- Flood 1/10 Low FEMA zone X (unshaded) · 0% chance over 30 yrs
- Wildfire 4/10 Moderate
- Heat 7/10 Severe 7 d/yr ≥108°F today · 23 d/yr by 30 yrs out
- Wind 6/10 Major 27% chance of damaging wind over 30 yrs
- Air quality 2/10 Low 1 unhealthy d/yr today · 1 by 30 yrs out
Nearby sold comps map
Loading sold comps map…
Walkable amenities ~0.75 mi
Loading nearby amenities…
Taxation est. · year 1
- Rental income
- $11,280
- − Mortgage interest
- −$4,425
- − Property taxes
- −$924
- − Insurance
- −$395
- − Repairs & maintenance
- −$902
- − Management
- −$902
- − Depreciation
- −$2,298
- Taxable income
- $1,434
- Est. tax owed @ 24.0%
- −$344
- After-tax cash flow
- $2,278/yr
For passive investors: Depreciation is non-cash, so a rental often shows a tax loss while cash-flowing — sheltering income. Rental losses are passive: they offset passive income freely, and up to $25,000/yr can offset ordinary (W-2) income if you actively participate and your MAGI is under $100k (phasing out to $0 by $150k); unused losses carry forward. On sale, claimed depreciation is recaptured at up to 25%, and gains may owe capital-gains tax (a 1031 exchange can defer both). Figures are a year-1 estimate at your 24.0% rate — not tax advice; consult a CPA.
Schools (NCES district)
- District
- Hillsboro ISD
- NCES district ID
- 4823280
- Math proficiency
- 46% ▲ 4.00%
- Reading proficiency
- 39% ▲ 2.00%
- Median HH income
- $34,483
- Composite
- 35.12/100
- National rank
- #5016
- State rank
- #370 of 826 in TX
Livability — Hillsboro
- Score
- 64/100
- State rank
- #803
- US rank
- #14657
Category grades
Schools grade is shown separately in the Schools card above.
Census & demographics
- Census place
- Hillsboro, TX
- City population
- 11,321
- Population (ZIP)
- 11,321
Population outlook (Hill County) Hauer SSP2
- Today (2025)
- 34,013 people
- By 2030
- 33,289 · -2.1%
- By 2040
- 31,688 · -6.8%
- By 2050
- 30,100 · -11.5%
- By 2075
- 26,818 · -21.2%
- By 2100
- 22,918 · -32.6%
Race, ethnicity, and origin ACS 2023
- Neighborhood character
- Diverse neighborhood (Simpson 0.60)
- Race & ethnicity
- White 52% Hispanic / Latino 34% Black 10% Two or more races 8% Native American 1%
- Hispanic origin (detail)
- Mexican 32%
- Common ancestry
- Slovak 1% Lithuanian 1% Serbian 1%
- Foreign-born
- 11% · Canada
- Languages at home
- 73% English-only · Spanish 26%
Political lean MEDSL · Hill
- 2024 margin
- Solid R (+64.4) · D 17.5% · R 81.8%
- 2008→2024 swing
- -23.0pp toward R · 2008: -41.4pp · 2024: -64.4pp
- All cycles
- 2024: R+64.4 2020: R+60.7 2016: R+58.4 2012: R+53.0 2008: R+41.4
Not yet ingested
- Civics
- —
Market trends
- HPI YoY
- ▼ -124.83%
- Current HPI
- 248.3182
- Rent YoY
- —
- Metro
- —
- State GDP YoY
- ▲ 3.95%
- F500 in state
- 110
Industry mix (Fortune 500 HQ in TX)
| Industry | F500 HQs | Revenue |
|---|---|---|
| Energy | 16 | $1,198B |
|
||
| Technology | 5 | $198B |
|
||
| Engineering / Construction | 4 | $72B |
|
||
| Energy Services | 3 | $60B |
|
||
| Utilities | 3 | $41B |
|
||
| Healthcare | 2 | $330B |
|
||
Price history
3 events — show timeline
- 2026-05-30 Listed $79,000 NTREIS
- 2008-09-29 Sold (Public Records) — Public Records
- 2000-01-03 Sold (Public Records) — Public Records
Property tax history
+5.5%/yrLatest (2025): $924 · +12.6% YoY. Source: county tax records.
Cash-flow waterfall
monthlySold comps — $/sqft
last 12 mo · ≤1 miLoading sold comps…