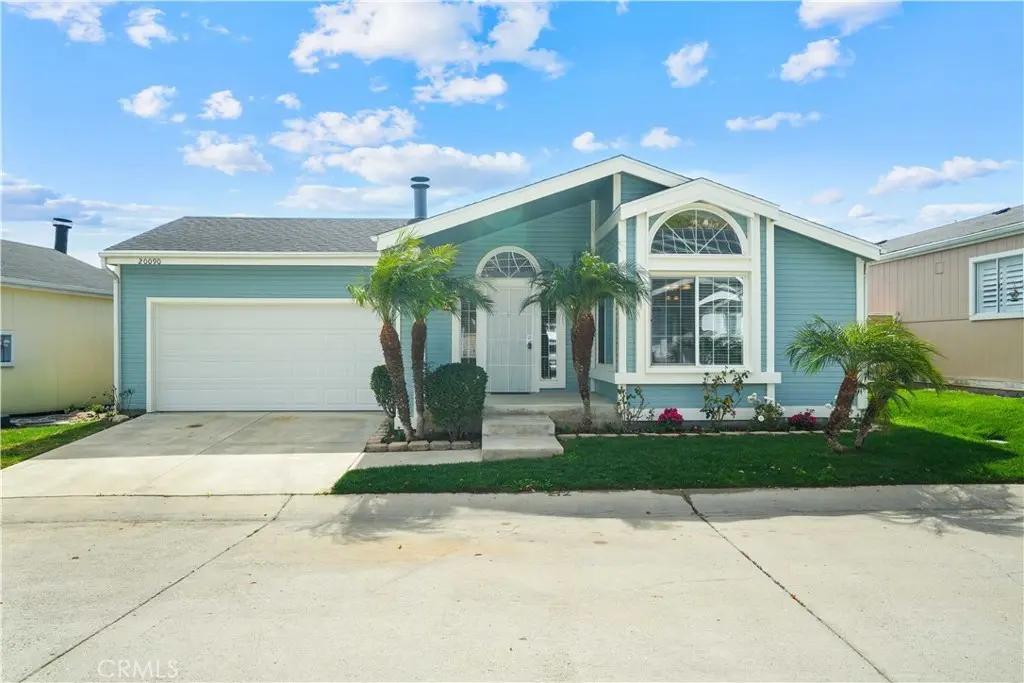
20090 Northcliff Dr · Santa Clarita, CA
Flood risk 1/10 · Minimal
- FEMA flood zone
- X (unshaded)
- Chance of flooding over 30 yrs
- 0.0%
- Est. flood insurance / yr
- $507 – $1,088
Fire risk 8/10 · Major
- Est. fire insurance / yr
- $659 – $1,223
Heat risk 7/10 · Major
- Hot days now (above 99°F)
- 7 days/yr
- Hot days in 30 yrs
- 19 days/yr
Wind risk 1/10 · Minimal
- Chance of severe wind over 30 yrs
- —
Air-quality risk 6/10 · Moderate
- Unhealthy air days now
- 9 days/yr
- Unhealthy air days in 30 yrs
- 13 days/yr
Risk factors via First Street. Map © Google.
Why this score? — see what drove the B- grade
The composite is a weighted blend of 9 inputs, each scored 0–100. Each bar is that input's sub-score; the figure is the points it added to the 100-point composite (weight × sub-score).
- Cash flow +30.0/30.0
- DSCR +10.0/10.0
- 1% rule +9.6/10.0
- Schools +5.9/10.0
- Condition / age +4.0/5.0
- Livability +3.5/5.0
- Rent growth +2.9/5.0
- ARV discount +1.9/15.0
- Appreciation +0.0/10.0
$319,000
🖨 Deal sheet (PDF) 📄 Offer letter ✓ Due diligence
Listing remarks
Beautifully updated 3-bedroom, 2-bath home featuring fresh interior and exterior paint, new luxury vinyl plank flooring, new carpet, and tile in the primary bath. The inviting living room offers a fireplace with built-in shelving. The kitchen is well-equipped with a center island, built-in desk, stainless steel appliances, built-in microwave, and fresh white cabinetry with ample storage. Ceiling fans throughout and a dedicated laundry room add comfort and convenience. The primary suite includes an en-suite bath for added privacy with separate dual vanities. The backyard is designed for entertaining with new sod, a custom-built BBQ with brick accents and cement prep countertops, outdoor ligh
Key facts
- Updated home
- Center island
- Built-in microwave
Tags
Property features AI
Finance
- Other: Mountainous community setting
- Financial info: Land lease amount: monthly
- HOA & community: Land lease (monthly)
Exterior
- Parking: Attached garage with direct garage access; 2 garage spaces; Driveway parking (2 total parking spaces)
- Security: Gated community with guard
- Utilities: Public/district water; Public sewer; Natural gas available; Electricity available; Cable available
- Home design: House; One story; Entry at main level; No ADU; Canyon View Estates subdivision; Facing direction not specified
- Construction: Composition roof; Certified 433a foundation
- Exterior features: Covered concrete patio; Community pool; Front yard; Back yard; Block wall and wrought iron fencing
Interior
- Kitchen: Kitchen island; Gas cooktop; Gas oven; Microwave; Dishwasher; Garbage disposal
- Bedrooms: 3 main-level bedrooms; Primary bedroom
- Flooring: Tile; Vinyl; Carpet
- Bathrooms: 2 full bathrooms; Bathtub
- Heating & cooling: Central heating (furnace); Central cooling
- Interior features: Ceiling fan; Open floor plan; Cathedral/vaulted ceilings; Formica counters; Community spa
- Laundry & utility: Laundry room inside; Gas dryer hookup; Individual laundry room
Neighborhood map
What this means for you Summary
Snapshot
- This is a 3-bed/2.0-bath manufactured listed at $319k. Condition is rated good.
Deal economics
- At list price, monthly cash flow is $2k ($21k/yr) — positive.
- The deal already cash-flows at list — no discount required.
- Meets the 1% rule at list price ($5k rent vs $319k).
- Recommended offer: $309k (3.0% below list) — sets the bar for market timing.
- Cap rate 12.8% vs local median 2.8% in Santa Clarita — top-decile yield for the area; either an underpriced asset or a hidden risk that comps aren't pricing in. Stress-test before assuming the spread holds.
Location & tenants
- Location reads 70/100 on livability (#229 in CA) — a middle-class / working-renter tenant base. Strengths: employment A+, housing A, crime A-; Watch: amenities D+, cost of living F, health & safety F.
- William S. Hart Union High (suburban): math 52% / reading 72% proficiency, ranked #155 of 1,400 in CA (top 11%) — acceptable for families but not a draw, mixed tenant base, ~2y average lease; only 18% free/reduced lunch — higher-income household profile.
- Market conditions: Rents rising (+1.7%/yr); 109 active listings in the ZIP; 16 comparable units currently listed for rent nearby; rentals leasing fast (median 8d on market — plan ~1-2 weeks tenant-placement turnaround); high-income renter base; 19,697 units permitted in Los Angeles County in 2024 (9,426 in 5+ unit buildings).
- At $4,672/mo this rent would consume 49% of the median local household income ($115k/yr) (locally 784% of renters already pay >50% of income on rent) — very limited rent-growth headroom before tenants either downsize or default.
Forward outlook
- Local home prices are declining (-3.0%/yr); year-one equity from $2k of loan paydown is wiped out by about $10k of value loss. Plan a longer hold.
- Los Angeles County population projected at +9% by 2050 — modest demand growth; plan on rents tracking national, not racing it.
- At projected returns (-3.0% appreciation + 1.7% rent growth), your $89k cash investment doubles in ~6 years — after that, you're playing with house money.
Negotiation context
- It's been on market 58 days — a 3% lower offer ($309k) is reasonable based on typical stale-listing flexibility.
Risks & watch-outs
- Climate carrying-cost: severe wildfire risk; extreme-heat days projected 7→19/yr by 2055 (HVAC capex compounding) — expect insurance premiums to compound above CPI over the hold.
Questions for the listing agent
- It's been on market 58 days. Have you received any prior offers? Is the seller open to a 3% concession, seller financing, or rate buy-down credit?
- Is there a deadline driving the sale (1031 exchange, divorce, estate, relocation)? That informs how much negotiation room exists.
- Schools are B-rated — typically a magnet for longer-tenancy family renters. What's the average tenant stay here, and is there a school-zone premium baked into asking?
- What's the average days-on-market for RENTAL listings here right now (not sales)? A rising rental-DOM trend means longer vacancies and softer asking-rent achievability than the comps imply.
- What's the recent tenant-quality profile in this submarket — average credit score on applications, eviction rate, late-payment / NSF rate, and stable-employment percentage? A property-management company in the area should have these aggregated.
- How much new for-sale + rental construction is in the pipeline within 1–3 miles? Heavy new supply typically softens prices + rents 12–24 months out; constrained supply supports both.
Investment metrics
- 1% rule
- 1.46% ✓
- Cap rate
- 12.75%
- Cash-on-cash
- 23.06%
- DSCR
- 2.03
- GRM
- 5.7
CMA / ARV
- ARV (on-the-fly)
- $283,824
- Comps found
- 8
Show comp detail 8 sales within ~0.75 mi
| Address | Dist | Beds/Ba | Sqft | Sold | Price | $/sf | Match |
|---|---|---|---|---|---|---|---|
| 20126 Northcliff | 0.04mi | 3/2.0 | 1,752 (0%) | 2mo | $280,000 | $160 | 97 |
| 19983 Crestview Dr | 0.18mi | 3/2.0 | 1,752 (0%) | 7mo | $360,000 | $205 | 86 |
| 27829 Sunrise Ln | 0.30mi | 3/2.0 | 1,752 (0%) | 3mo | $283,000 | $162 | 84 |
| 20039 Emerald Creek Dr | 0.24mi | 3/2.0 | 1,845 (+5%) | 16mo | $300,000 | $163 | 67 |
| 19954 Emerald Crk | 0.29mi | 3/2.0 | 1,845 (+5%) | 19mo | $335,000 | $182 | 62 |
| 20401 Soledad Canyon Rd #231 | 0.59mi | 3/2.0 | 1,568 (-10%) | 3mo | $240,000 | $153 | 53 |
| 20401 Soledad Cyn #613 | 0.59mi | 3/2.0 | 1,824 (+4%) | 24mo | $254,500 | $140 | 46 |
| 20401 Soledad Canyon Rd #821 | 0.59mi | 3/2.0 | 1,508 (-14%) | 23mo | $235,800 | $156 | 30 |
Match score weights: distance 35% · size 25% · config 20% · recency 20%. Top-matched comps best support the ARV.
Projected returns pro-forma
-3.0% appreciation · 1.7% rent growth · sell at horizon
- IRR
- 14.6%
- Equity multiple
- 1.58×
- Total profit
- $51,529
- Equity at exit
- $47,564
- IRR
- 22.4%
- Equity multiple
- 2.81×
- Total profit
- $161,240
- Equity at exit
- $27,581
Cash invested: $89,320 (down + closing). Projections, not guarantees.
Landlord ↔ Tenant lean methodology
- Overall (STATE)
- 18 Strongly Tenant-Friendly
- State California
- 18 Strongly Tenant-Friendly · D+13
- County
- — inherits STATE
- City
- — inherits STATE
ZIP-level market 91351
- Rents YoY
- 1.7%
- Active inventory
- 109
- Price-to-rent
- 5.7×
Monthly cashflow live
- Estimated rent
- $4,672 high interval (Pro) →
- Mortgage (P&I)
- −$1,673
- Tax from tax record
- −$168 /mo · $2,020/yr
- Insurance
- −$133
- HOA
- −$0
- Vacancy / Maint / Mgmt
- −$981
- Net cashflow
- $1,717
Break-even live
Sensitivity live
| Price | -10% $1,897 | -5% $1,807 | +0% $1,717 | +5% $1,626 | +10% $1,536 |
|---|---|---|---|---|---|
| Rent | -10% $1,347 | -5% $1,532 | +0% $1,717 | +5% $1,901 | +10% $2,086 |
| Rate | -1.0pp $1,877 | -0.5pp $1,798 | base $1,717 | +0.5pp $1,634 | +1.0pp $1,550 |
UW: 25.0% down · 7.5% · 30yr · 1.5% tax · 5.0% vac · 8.0% maint · 8.0% mgmt
Financing live
Cash to close
- Down payment
- $79,750
- Closing costs
- $9,570
- Reserves months
- —
- Total cash needed
- —
Loan-product check · same deal, 3 products live
Conventional
25% down · 7.5% · 30yr
- Down + closing
- —
- Monthly P&I
- —
- Monthly cashflow
- —
- DSCR
- —
- Eligible?
- —
Personal DTI + credit; lowest rate.
DSCR
20% down · 8.5% · 30yr
- Down + closing
- —
- Monthly P&I
- —
- Monthly cashflow
- —
- DSCR
- —
- Eligible?
- —
No personal income docs; deal must DSCR.
Hard money
10% down · 12.0% · 12mo
- Down + closing
- —
- Monthly P&I
- —
- Monthly cashflow
- —
- DSCR
- —
- Eligible?
- —
Short-term bridge; refi at stabilization.
Rent comps 16 comps
| Address | Beds | Baths | Sqft | Rent | $/sqft | DOM | Units | Dist |
|---|---|---|---|---|---|---|---|---|
| 27932 Calypso Ln Canyon Country, CA | 4.0 | 2.0 | 1789 | $7,495 | $4.19 | 0d | 1 | 0.50mi |
| 27932 Calypso Ln Canyon Country, CA | 4.0 | 2.0 | 1783 | $7,495 | $4.20 | 20d | 1 | 0.50mi |
| 28040 Ermine Pl Canyon Country, CA | 4.0 | 2.0 | 1467 | $4,250 | $2.90 | 0d | 1 | 0.59mi |
| 28131 Florence Ln Canyon Country, CA | 3.0 | 2.0 | 1515 | $4,300 | $2.84 | 0d | 1 | 0.70mi |
| 28128 Wildwind Rd Canyon Country, CA | 3.0 | 3.0 | 1900 | $3,875 | $2.04 | 0d | 1 | 0.87mi |
| 26844 Albion Way Unit 1 Santa Clarita, CA | 3.0 | 2.5 | 1817 | $3,995 | $2.20 | 13d | 1 | 1.03mi |
| 20000 Plum Canyon Rd Santa Clarita, CA | 1.0–3.0 | 1.0–3.0 | 1051 | $3,700 | $3.52 | 25d | 2 | 1.09mi |
| 20000 Plum Canyon Rd Santa Clarita, CA | 3.0 | 3.0 | 1370 | $3,500 | $2.55 | 0d | 1 | 1.09mi |
| 19335 Laroda Ln Santa Clarita, CA | 2.0 | 2.0 | 1400 | $3,000 | $2.14 | 8d | 1 | 1.15mi |
| 28371 Mirabelle Ln Santa Clarita, CA | 3.0 | 2.5 | 1710 | $3,400 | $1.99 | 7d | 1 | 1.15mi |
| 28366 Casselman Ln Santa Clarita, CA | 3.0 | 2.5 | 1710 | $3,650 | $2.13 | 0d | 1 | 1.19mi |
| 28519 Moyer Ln Santa Clarita, CA | 4.0 | 3.0 | 2360 | $4,950 | $2.10 | 0d | 1 | 1.23mi |
| 19341 Opal Ln Santa Clarita, CA | 3.0 | 3.0 | 1850 | $3,850 | $2.08 | 19d | 1 | 1.24mi |
| 28136 Bakerton Ave Canyon Country, CA | 3.0 | 2.0 | 1400 | $3,800 | $2.71 | 8d | 1 | 1.28mi |
| 22056 Windham Way Santa Clarita, CA | 4.0 | 3.0 | 2132 | $4,350 | $2.04 | 0d | 1 | 1.28mi |
| 18735 Bookham Dr Canyon Country, CA | 4.0 | 2.0 | 1628 | $4,900 | $3.01 | 18d | 1 | 1.32mi |
Listing history 16 events
-
2026-06-21days on market $319,000 Active 58 DOM
-
2026-06-18days on market $319,000 Active 55 DOM
-
2026-06-17days on market $319,000 Active 54 DOM
-
2026-06-16days on market $319,000 Active 53 DOM
-
2026-06-15days on market $319,000 Active 52 DOM
-
2026-06-13days on market $319,000 Active 50 DOM
-
2026-06-13days on market $319,000 Active 49 DOM
-
2026-06-09days on market $319,000 Active 46 DOM
-
2026-06-08days on market $319,000 Active 45 DOM
-
2026-06-07days on market $319,000 Active 44 DOM
-
2026-06-04days on market $319,000 Active 41 DOM
-
2026-06-03days on market $319,000 Active 40 DOM
-
2026-06-02days on market $319,000 Active 39 DOM
-
2026-06-01days on market $319,000 Active 38 DOM
-
2026-05-31days on market $319,000 Active 37 DOM
-
2026-04-24$319,000 Active
ⓘ Source: listings_history table (triggers on properties + properties_extension) + one-shot
backfill from property_details.listing_events for pre-trigger history.
Tax reassessment forecast CA · Resets to sale price
- Current annual tax
- $2,020 · $168/mo
- Projected year-2 tax
- $2,424 · $202/mo
- Expected delta
- +$405/yr (+$34/mo · 20.0%)
ⓘ Screening estimate from a state-policy table — verify with the county assessor before closing.
Climate risk First Street
- Flood 1/10 Low FEMA zone X (unshaded) · 0% chance over 30 yrs
- Wildfire 8/10 Severe
- Heat 7/10 Severe 7 d/yr ≥99°F today · 19 d/yr by 30 yrs out
- Wind 1/10 Low
- Air quality 6/10 Major 9 unhealthy d/yr today · 13 by 30 yrs out
Nearby sold comps map
Loading sold comps map…
Walkable amenities ~0.75 mi
Loading nearby amenities…
Taxation est. · year 1
- Rental income
- $56,060
- − Mortgage interest
- −$17,869
- − Property taxes
- −$2,020
- − Insurance
- −$1,595
- − Repairs & maintenance
- −$4,485
- − Management
- −$4,485
- − Depreciation
- −$9,280
- Taxable income
- $16,327
- Est. tax owed @ 24.0%
- −$3,918
- After-tax cash flow
- $16,680/yr
For passive investors: Depreciation is non-cash, so a rental often shows a tax loss while cash-flowing — sheltering income. Rental losses are passive: they offset passive income freely, and up to $25,000/yr can offset ordinary (W-2) income if you actively participate and your MAGI is under $100k (phasing out to $0 by $150k); unused losses carry forward. On sale, claimed depreciation is recaptured at up to 25%, and gains may owe capital-gains tax (a 1031 exchange can defer both). Figures are a year-1 estimate at your 24.0% rate — not tax advice; consult a CPA.
Condition & rehab AI · 12 photos
This well-maintained and updated manufactured home is move-in ready with fresh paint, new flooring, and a modern kitchen. It offers a good balance of curb appeal and interior updates.
Value-add opportunities
- Both Painting the exterior and interior — Enhances curb appeal and interior aesthetics
- Both Upgrading the kitchen appliances — Modernizes the kitchen and attracts more buyers
- Both Installing new flooring in the bathrooms — Improves the overall look and feel of the home
Renovation cost estimate screening
Value-add ROI direction
- Both Painting the exterior and interior — Enhances curb appeal and interior aesthetics ↑
- Both Upgrading the kitchen appliances — Modernizes the kitchen and attracts more buyers ↑
- Both Installing new flooring in the bathrooms — Improves the overall look and feel of the home ↑
ⓘ Cost ranges are severity-bucket heuristics (US national rule-of-thumb). Get contractor quotes + a written scope before underwriting a rehab budget.
Schools (NCES district)
- District
- William S. Hart Union High
- NCES district ID
- 0642510
- Math proficiency
- 52% ▬ 0.00%
- Reading proficiency
- 72% ▲ 1.00%
- Median HH income
- $95,844
- Composite
- 58.6/100
- National rank
- #2030
- State rank
- #155 of 1400 in CA
Livability — Santa Clarita
- Score
- 70/100
- State rank
- #229
- US rank
- #7378
Category grades
Schools grade is shown separately in the Schools card above.
Census & demographics
- Census place
- Santa Clarita, CA
- County
- Los Angeles County · 9,444,647 people
- City population
- 219,066
- Metro
- Los Angeles-Long Beach-Anaheim, CA
- Population (ZIP)
- 33,155
- Household income
- $115,364
- Rent vs Own
- Severe rent burden
- 784.0
Population outlook (Los Angeles County) Hauer SSP2
- Today (2025)
- 10,940,515 people
- By 2030
- 11,256,481 · +2.9%
- By 2040
- 11,729,929 · +7.2%
- By 2050
- 11,948,407 · +9.2%
- By 2075
- 11,818,114 · +8.0%
- By 2100
- 10,842,928 · -0.9%
Race, ethnicity, and origin ACS 2023
- Neighborhood character
- Diverse neighborhood (Simpson 0.64)
- Race & ethnicity
- Hispanic / Latino 49% White 34% Two or more races 21% Asian 6% Black 4% Native American 1%
- Hispanic origin (detail)
- Mexican 36%
- Common ancestry
- Romanian 1% Lithuanian 1% Scotch-Irish 1%
- Foreign-born
- 23% · Canada, Jamaica, South Korea
- Languages at home
- 54% English-only · Spanish 35% Other Indo-European 3% Tagalog/Filipino 2%
Political lean MEDSL · Los Angeles
- 2024 margin
- Solid D (+32.9) · D 64.8% · R 31.9% · Other 3.3%
- 2008→2024 swing
- -7.4pp toward R · 2008: 40.4pp · 2024: 32.9pp
- All cycles
- 2024: D+32.9 2020: D+44.2 2016: D+48.0 2012: D+40.0 2008: D+40.4
Not yet ingested
- Civics
- —
Market trends
- HPI YoY
- ▼ -703.16%
- Current HPI
- 360.9901
- Rent YoY
- ▲ 1.70%
- Metro
- Los Angeles-Long Beach-Anaheim, CA
- State GDP YoY
- ▲ 3.21%
- F500 in state
- 116
Industry mix (Fortune 500 HQ in CA)
| Industry | F500 HQs | Revenue |
|---|---|---|
| Technology | 27 | $1,492B |
|
||
| Financial Services | 3 | $174B |
|
||
| Retail | 3 | $44B |
|
||
| Insurance | 3 | $26B |
|
||
| Media / Entertainment | 2 | $115B |
|
||
| Pharmaceuticals / Biotech | 2 | $62B |
|
||
Price history
1 event — show timeline
- 2026-04-24 Listed $319,000 CRMLS
Property tax history
+9.5%/yrLatest (2025): $2,020 · +9.5% YoY. Source: county tax records.
Cash-flow waterfall
monthlySold comps — $/sqft
last 12 mo · ≤1 miLoading sold comps…