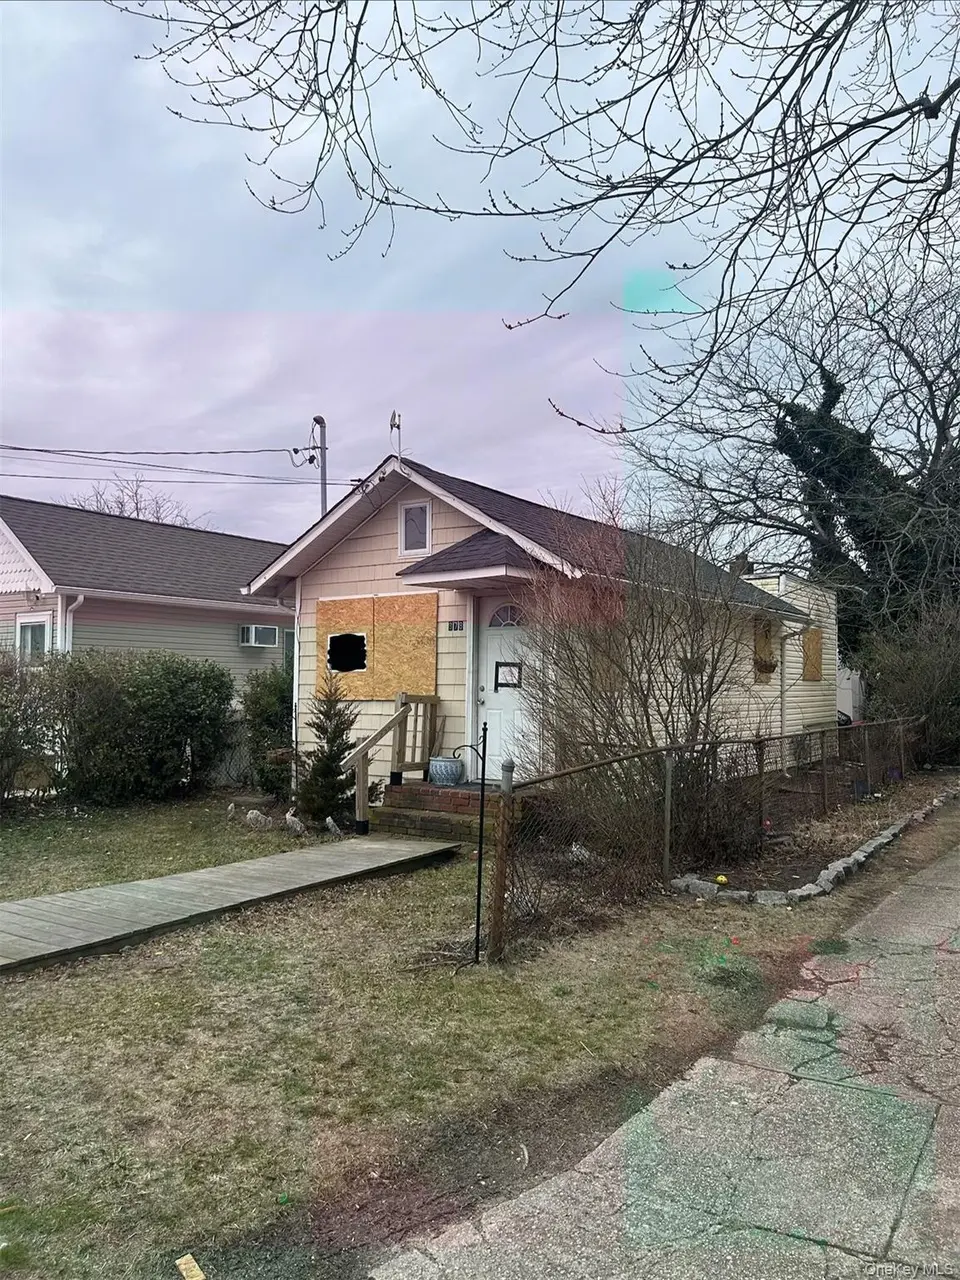
878 S 5th St · Lindenhurst, NY
Flood risk 10/10 · Severe
- FEMA flood zone
- AE
- Chance of flooding over 30 yrs
- 0.99%
- Est. flood insurance / yr
- $2,026 – $9,024
Fire risk 1/10 · Minimal
- Est. fire insurance / yr
- $691 – $1,283
Heat risk 5/10 · Moderate
- Hot days now (above 94°F)
- 7 days/yr
- Hot days in 30 yrs
- 17 days/yr
Wind risk 7/10 · Major
- Chance of severe wind over 30 yrs
- 78.0%
Air-quality risk 4/10 · Minor
- Unhealthy air days now
- 5 days/yr
- Unhealthy air days in 30 yrs
- 7 days/yr
Risk factors via First Street. Map © Google.
Why this score? — see what drove the B grade
The composite is a weighted blend of 9 inputs, each scored 0–100. Each bar is that input's sub-score; the figure is the points it added to the 100-point composite (weight × sub-score).
- Cash flow +30.0/30.0
- 1% rule +10.0/10.0
- DSCR +10.0/10.0
- ARV discount +7.5/15.0
- Schools +6.1/10.0
- Livability +3.8/5.0
- Rent growth +2.5/5.0
- Condition / age +2.5/5.0
- Appreciation +0.0/10.0
$125,000
🖨 Deal sheet 📄 Offer letter ✓ Due diligence
Listing remarks MLS
One Bedroom, One Bath Bungalow With Potential.
Key facts
- Buildable lot
- Revitalized downtown
- Sewer connected
Tags
Property features AI
Exterior
- Parking: No carport; Other parking
- Utilities: Public sewer; Electricity connected
- Home design: Single family residence
- Construction: Frame construction
- Exterior features: Frame construction; Not waterfront
Interior
- Kitchen: Gas range
- Bedrooms: Bedroom on the first floor
- Bathrooms: 1 full bathroom
- Heating & cooling: Baseboard heating; Natural gas heating; Ductless cooling
- Interior features: First-floor bedroom; 6 total rooms; Crawl space basement; Attic: see remarks
Neighborhood map
What this means for you Summary
Snapshot
- This is a 2-bed/1.0-bath single-family listed at $125k.
Deal economics
- At list price, monthly cash flow is $628 ($8k/yr) — positive.
- The deal already cash-flows at list — no discount required.
- Meets the 1% rule at list price ($3k rent vs $125k).
- Recommended offer: $121k (3.0% below list) — sets the bar for market timing.
- Cap rate 16.7% vs local median 3.0% in Lindenhurst — top-decile yield for the area; either an underpriced asset or a hidden risk that comps aren't pricing in. Stress-test before assuming the spread holds.
Location & tenants
- Location reads 75/100 on livability (#260 in NY, #4,112 nationally) — a middle-class / working-renter tenant base. Strengths: commute A+, employment A+, housing A+; Watch: amenities D+, cost of living F, health & safety F.
- Lindenhurst Union Free School District (suburban): math 64% / reading 72% proficiency, ranked #139 of 590 in NY (top 24%) — acceptable for families but not a draw, mixed tenant base, ~2y average lease.
- Zoned schools: West Gates Avenue School (math 54% / reading 74%, grade B, #591 of 2,108 statewide, top 31%, 278 students, 43% FRL); Lindenhurst Middle School (math 45% / reading 62%, grade C+, #228 of 729 statewide, top 31%, 1,284 students, 44% FRL); Lindenhurst Senior High School (math 86% / reading 95%, grade A+, #231 of 1,100 statewide, top 21%, 1,897 students, 41% FRL) — zoned schools average 43% FRL vs 21% district-wide (22 pts higher); higher-poverty schools than district average — tighter screening recommended.
- Market conditions: 204 active listings in the ZIP; 4 comparable units currently listed for rent nearby; rentals leasing fast (median 1d on market — plan ~1-2 weeks tenant-placement turnaround); high-income renter base; 1,366 units permitted in Suffolk County in 2024 (216 in 5+ unit buildings).
Forward outlook
- Local home prices are declining (-3.0%/yr); year-one equity from $864 of loan paydown is wiped out by about $4k of value loss. Plan a longer hold.
- Suffolk County population projected to shrink 5% by 2050 — rents likely to lag national; underwrite the cash flow, not the appreciation.
- At projected returns (-3.0% appreciation + 3.0% rent growth), your $35k cash investment doubles in ~6 years — after that, you're playing with house money.
Negotiation context
- It's been on market 34 days — a 3% lower offer ($121k) is reasonable based on typical stale-listing flexibility.
- 7 sale attempts since 14y ago; this cycle's ask has dropped $15k (11%) from the opening price — seller is motivated, your offer sets the floor, not the list.
- Current owner paid $98k; 28% above their basis — modest negotiation headroom, anchor on the comps not their cost.
Risks & watch-outs
- Watch-outs: property tax is 3.8% of price; flood insurance adds $460/mo; built in 1934 — expect roof / HVAC / electrical / plumbing capex.
- Climate carrying-cost: in FEMA flood zone AE (mandatory federal flood insurance); major wind risk, 78% chance of damaging wind over 30y; extreme-heat days projected 7→17/yr by 2055 (HVAC capex compounding) — expect insurance premiums to compound above CPI over the hold.
Questions for the listing agent
- It's been on market 34 days. Have you received any prior offers? Is the seller open to a 3% concession, seller financing, or rate buy-down credit?
- Built in 1934 — when were the roof, HVAC, electrical panel, plumbing, and water heater last replaced?
- Property tax is high relative to price — has the assessment been appealed recently, and will the sale trigger a re-assessment?
- What's the actual annual flood-insurance premium (NFIP or private), and is the property in a SFHA with mandatory coverage?
- Is there a deadline driving the sale (1031 exchange, divorce, estate, relocation)? That informs how much negotiation room exists.
- Schools are B-rated — typically a magnet for longer-tenancy family renters. What's the average tenant stay here, and is there a school-zone premium baked into asking?
- What's the average days-on-market for RENTAL listings here right now (not sales)? A rising rental-DOM trend means longer vacancies and softer asking-rent achievability than the comps imply.
- What's the recent tenant-quality profile in this submarket — average credit score on applications, eviction rate, late-payment / NSF rate, and stable-employment percentage? A property-management company in the area should have these aggregated.
- How much new for-sale + rental construction is in the pipeline within 1–3 miles? Heavy new supply typically softens prices + rents 12–24 months out; constrained supply supports both.
Investment metrics
- 1% rule
- 2.22% ✓
- Cap rate
- 16.74%
- Cash-on-cash
- 37.32%
- DSCR
- 2.66
- GRM
- 3.7
CMA / ARV
No comps found within radius.
Projected returns pro-forma
-3.0% appreciation · 3.0% rent growth · sell at horizon
- IRR
- 14.4%
- Equity multiple
- 1.58×
- Total profit
- $20,218
- Equity at exit
- $18,638
- IRR
- 23.3%
- Equity multiple
- 3.03×
- Total profit
- $71,039
- Equity at exit
- $10,808
Cash invested: $35,000 (down + closing). Projections, not guarantees.
Landlord ↔ Tenant lean methodology
- Overall (STATE)
- 15 Strongly Tenant-Friendly
- State New York
- 15 Strongly Tenant-Friendly · D+10
- County
- — inherits STATE
- City
- — inherits STATE
ZIP-level market 11757
- Active inventory
- 204
- Price-to-rent
- 3.7×
Monthly cashflow live
- Estimated rent
- $2,780 medium interval (Pro) →
- Mortgage (P&I)
- −$656
- Tax from tax record
- −$400 /mo · $4,804/yr
- Insurance
- −$52
- Flood insurance flood zone
- −$460 /mo · $5,525/yr
- HOA
- −$0
- Vacancy / Maint / Mgmt
- −$584
- Net cashflow
- $628
Break-even live
UW: 25.0% down · 7.5% · 30yr · 1.5% tax · 5.0% vac · 8.0% maint · 8.0% mgmt
Financing live
Cash to close
- Down payment
- $31,250
- Closing costs
- $3,750
- Reserves months
- —
- Total cash needed
- —
Loan-product check · same deal, 3 products live
Conventional
25% down · 7.5% · 30yr
- Down + closing
- —
- Monthly P&I
- —
- Monthly cashflow
- —
- DSCR
- —
- Eligible?
- —
Personal DTI + credit; lowest rate.
DSCR
20% down · 8.5% · 30yr
- Down + closing
- —
- Monthly P&I
- —
- Monthly cashflow
- —
- DSCR
- —
- Eligible?
- —
No personal income docs; deal must DSCR.
Hard money
10% down · 12.0% · 12mo
- Down + closing
- —
- Monthly P&I
- —
- Monthly cashflow
- —
- DSCR
- —
- Eligible?
- —
Short-term bridge; refi at stabilization.
Rent comps 4 comps
| Address | Beds | Baths | Sqft | Rent | $/sqft | DOM | Units | Dist |
|---|---|---|---|---|---|---|---|---|
| 273 S 16th St Lindenhurst, NY | 1.0 | 1.0 | 735 | $2,200 | $2.99 | 1d | 1 | 1.14mi |
| 75 E Hoffman Ave Lindenhurst, NY | 3.0 | 1.0–2.0 | 1125 | $3,998 | $3.55 | 1d | 1 | 1.26mi |
| 204 Milligan Rd West Babylon, NY | 1.0 | 1.0 | 680 | $2,710 | $3.99 | 16d | 1 | 1.42mi |
| 11 Commodore Ln West Babylon, NY | 1.0 | 1.0 | 680 | $2,710 | $3.99 | 1d | 1 | 1.46mi |
Listing history 18 events
-
2026-04-27status Pending
-
2026-04-10price $125,000
-
2026-03-19$140,000 Active
-
2022-06-10historical
-
2022-06-03status Active
-
2022-04-20status Pending
-
2022-03-09$298,888 Active
-
2018-07-11soldstatus $97,500 Closed 46-char remark
Show marketing remark (46 chars)
One Bedroom, One Bath Bungalow With Potential.
-
2018-07-07status Under Contract 46-char remark
Show marketing remark (46 chars)
One Bedroom, One Bath Bungalow With Potential.
-
2018-06-14status Back On Market 46-char remark
Show marketing remark (46 chars)
One Bedroom, One Bath Bungalow With Potential.
-
2018-04-18status Under Contract 46-char remark
Show marketing remark (46 chars)
One Bedroom, One Bath Bungalow With Potential.
-
2018-03-15$109,900 New 46-char remark
Show marketing remark (46 chars)
One Bedroom, One Bath Bungalow With Potential.
-
2018-03-13historical
-
2018-01-18$94,999 New
-
2012-12-30historical
-
2012-02-27$154,999
-
2003-04-04soldstatus $140,000
-
1985-08-26soldstatus $52,500
ⓘ Source: listings_history table (triggers on properties + properties_extension) + one-shot
backfill from property_details.listing_events for pre-trigger history.
Tax reassessment forecast NY · Partial reset (capped growth)
- Current annual tax
- $4,804 · $400/mo
- Projected year-2 tax
- $4,804 · $400/mo
- Expected delta
- $0/yr ($0/mo · 0.0%)
ⓘ Screening estimate from a state-policy table — verify with the county assessor before closing.
Climate risk First Street
- Flood 10/10 Extreme FEMA zone AE · 99% chance over 30 yrs
- Wildfire 1/10 Low
- Heat 5/10 Major 7 d/yr ≥94°F today · 17 d/yr by 30 yrs out
- Wind 7/10 Severe 78% chance of damaging wind over 30 yrs
- Air quality 4/10 Moderate 5 unhealthy d/yr today · 7 by 30 yrs out
Nearby sold comps map
Loading sold comps map…
Walkable amenities ~0.75 mi
Loading nearby amenities…
Taxation est. · year 1
- Rental income
- $33,362
- − Mortgage interest
- −$7,002
- − Property taxes
- −$4,804
- − Insurance
- −$6,150
- − Repairs & maintenance
- −$2,669
- − Management
- −$2,669
- − Depreciation
- −$3,636
- Taxable income
- $6,432
- Est. tax owed @ 24.0%
- −$1,544
- After-tax cash flow
- $5,992/yr
For passive investors: Depreciation is non-cash, so a rental often shows a tax loss while cash-flowing — sheltering income. Rental losses are passive: they offset passive income freely, and up to $25,000/yr can offset ordinary (W-2) income if you actively participate and your MAGI is under $100k (phasing out to $0 by $150k); unused losses carry forward. On sale, claimed depreciation is recaptured at up to 25%, and gains may owe capital-gains tax (a 1031 exchange can defer both). Figures are a year-1 estimate at your 24.0% rate — not tax advice; consult a CPA.
Schools (NCES district)
- District
- Lindenhurst Union Free School District
- NCES district ID
- 3617380
- Math proficiency
- 64% ▼ -2.00%
- Reading proficiency
- 72% ▲ 1.00%
- Median HH income
- $82,624
- Composite
- 60.8/100
- National rank
- #820
- State rank
- #139 of 590 in NY
Livability — Lindenhurst
- Score
- 75/100
- State rank
- #260
- US rank
- #4112
Category grades
Schools grade is shown separately in the Schools card above.
Census & demographics
- Census place
- Lindenhurst, NY
- County
- Suffolk County · 679,920 people
- City population
- 44,413
- Metro
- New York-Newark-Jersey City, NY-NJ-PA
- Population (ZIP)
- 44,413
- Household income
- $127,889
- Rent vs Own
- Severe rent burden
- 580.0
Population outlook (Suffolk County) Hauer SSP2
- Today (2025)
- 1,505,262 people
- By 2030
- 1,498,318 · -0.5%
- By 2040
- 1,471,101 · -2.3%
- By 2050
- 1,424,848 · -5.3%
- By 2075
- 1,337,157 · -11.2%
- By 2100
- 1,217,720 · -19.1%
Race, ethnicity, and origin ACS 2023
- Neighborhood character
- Predominantly White (71%)
- Race & ethnicity
- White 71% Hispanic / Latino 20% Two or more races 9% Black 5% Asian 3%
- Hispanic origin (detail)
- Puerto Rican 5% Dominican 6%
- Common ancestry
- Romanian 7% Subsaharan African 3% Scotch-Irish 1%
- Foreign-born
- 18% · Canada, Jamaica, China
- Languages at home
- 71% English-only · Spanish 14% Russian/Polish/Slavic 8% Other Indo-European 3%
Political lean MEDSL · Suffolk
- 2024 margin
- Lean R (+10.0) · D 45.0% · R 55.0%
- 2008→2024 swing
- -16.0pp toward R · 2008: 6.0pp · 2024: -10.0pp
- All cycles
- 2024: R+10.0 2020: R+0.0 2016: R+8.2 2012: D+2.9 2008: D+6.0
Not yet ingested
- Civics
- —
Market trends
- HPI YoY
- ▼ -743.47%
- Current HPI
- 295.1742
- Rent YoY
- —
- Metro
- New York-Newark-Jersey City, NY-NJ-PA
- State GDP YoY
- ▲ 2.60%
- F500 in state
- 92
Industry mix (Fortune 500 HQ in NY)
| Industry | F500 HQs | Revenue |
|---|---|---|
| Financial Services | 10 | $950B |
|
||
| Consumer Goods | 9 | $162B |
|
||
| Insurance | 4 | $225B |
|
||
| Telecommunications | 2 | $144B |
|
||
| Pharmaceuticals | 2 | $112B |
|
||
| Media / Entertainment | 2 | $69B |
|
||
Price history
+138.1% since first listed18 events — show timeline
- 2026-04-27 Pending — OneKey® MLS as Distributed by MLS Grid
- 2026-04-10 Price Changed $125,000 OneKey® MLS as Distributed by MLS Grid
- 2026-03-19 Listed $140,000 OneKey® MLS as Distributed by MLS Grid
- 2022-06-10 Listing Removed — OneKey® MLS as Distributed by MLS Grid
- 2022-06-03 Relisted — OneKey® MLS as Distributed by MLS Grid
- 2022-04-20 Pending — OneKey® MLS as Distributed by MLS Grid
- 2022-03-09 Listed $298,888 OneKey® MLS as Distributed by MLS Grid
- 2018-07-11 Sold (MLS) $97,500 OneKey® MLS as Distributed by MLS Grid
- 2018-07-07 Pending — OneKey® MLS as Distributed by MLS Grid
- 2018-06-14 Relisted — OneKey® MLS as Distributed by MLS Grid
- 2018-04-18 Pending — OneKey® MLS as Distributed by MLS Grid
- 2018-03-15 Listed $109,900 OneKey® MLS as Distributed by MLS Grid
- 2018-03-13 Listing Removed — OneKey® MLS as Distributed by MLS Grid
- 2018-01-18 Listed $94,999 OneKey® MLS as Distributed by MLS Grid
- 2012-12-30 Listing Removed — OneKey® MLS as Distributed by MLS Grid
- 2012-02-27 Listed $154,999 OneKey® MLS as Distributed by MLS Grid
- 2003-04-04 Sold (Public Records) $140,000 Public Records
- 1985-08-26 Sold (Public Records) $52,500 Public Records
Property tax history
+2.9%/yrLatest (2025): $4,804 · +0.8% YoY. Source: county tax records.
Cash-flow waterfall
monthlySold comps — $/sqft
last 12 mo · ≤1 miLoading sold comps…