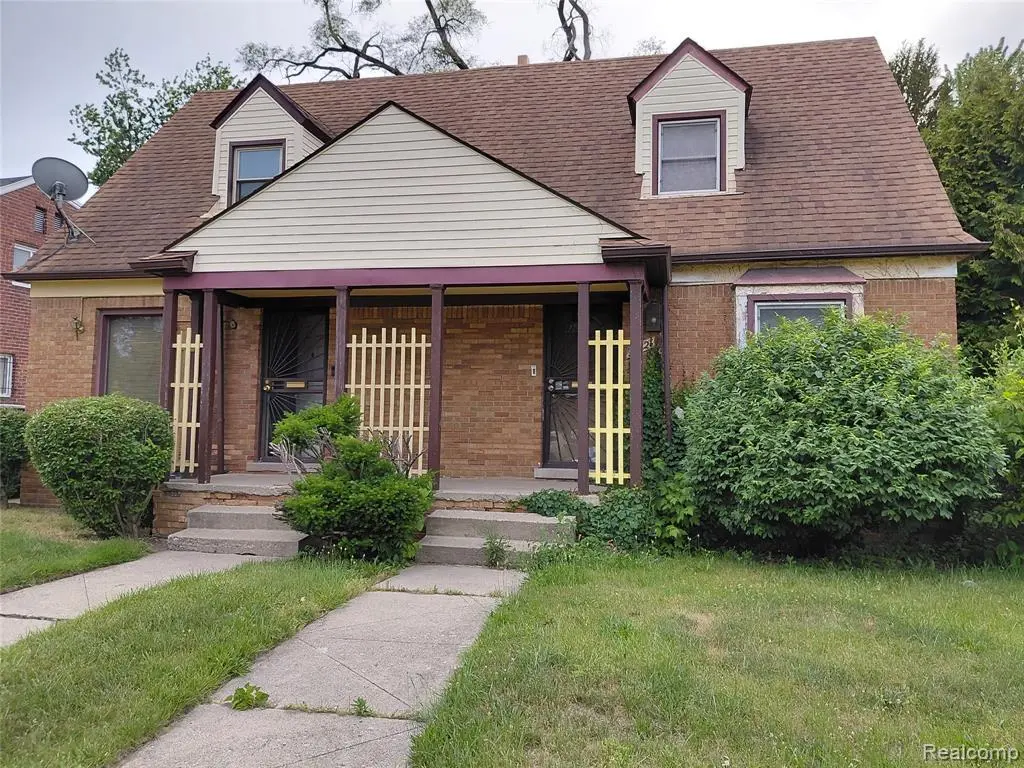
17621 Meyers Rd · Detroit, MI
Flood risk 4/10 · Minor
- FEMA flood zone
- X (unshaded)
- Chance of flooding over 30 yrs
- 0.2%
- Est. flood insurance / yr
- $473 – $860
Fire risk 1/10 · Minimal
- Est. fire insurance / yr
- $784 – $1,456
Heat risk 3/10 · Minor
- Hot days now (above 97°F)
- 7 days/yr
- Hot days in 30 yrs
- 15 days/yr
Wind risk 2/10 · Minimal
- Chance of severe wind over 30 yrs
- —
Air-quality risk 3/10 · Minor
- Unhealthy air days now
- 2 days/yr
- Unhealthy air days in 30 yrs
- 5 days/yr
Risk factors via First Street. Map © Google.
Why this score? — see what drove the B+ grade
The composite is a weighted blend of 9 inputs, each scored 0–100. Each bar is that input's sub-score; the figure is the points it added to the 100-point composite (weight × sub-score).
- Cash flow +30.0/30.0
- ARV discount +15.0/15.0
- 1% rule +10.0/10.0
- DSCR +10.0/10.0
- Livability +3.7/5.0
- Rent growth +3.3/5.0
- Condition / age +2.5/5.0
- Schools +1.3/10.0
- Appreciation +0.0/10.0
$50,000
🖨 Deal sheet 📄 Offer letter ✓ Due diligence
Listing remarks MLS
1/2 DUPLEX IN THE VIBRANT 48235 MEYERS CORRIDOR! NEAR BRAND NEW HOUSING , THE NORTHWEST ACTIVTIES CENTER, HOME DEPOT, AND THE MC NICHOLS COMMERCIAL CORRIDOR. THIS DUPLEX HAS 2 BEDROOMS AND A BONUS ROOM, A 2-CAR GARAGE, AND A BASEMENT HALF BATH. THE DINING ROOM HAS BEEN OPENED TO THE KITCHEN. PROPERTY NEEDS WORK AND IS BEING SOLD "AS IS. " BUT WHEN YOU PUT YOUR FINISHING TOUCHES ON THIS ONE YOU WILL HAVE A PREMIUM DUPLEX BECAUSE OF THE GARAGE, OPEN KITCHEN AREA BONUS ROOM, AND HALF BATH WHICH THE AVERAGE DUPLEX DOES NOT HAVE!
Key facts
- Half bath
- Open kitchen area
- 1/2 duplex
Tags
Property features AI
Exterior
- Parking: Detached garage facing the side with 2 garage spaces
- Utilities: Public water; Public sewer; Electric service with circuit breakers
- Home design: Single family residence; Two levels; Ground-level entry with steps
- Construction: Brick construction; Block foundation; Asphalt roof
- Exterior features: Back yard fencing; Paved road access
Interior
- Bedrooms: 6 total rooms (bedrooms included)
- Bathrooms: 2 full bathrooms
- Heating & cooling: Forced air heating (natural gas); Ceiling fans; No central cooling
- Interior features: Partially finished basement; Basement present
Neighborhood map
What this means for you Summary
Snapshot
- This is a 2-bed/1.0-bath single-family listed at $50k.
Deal economics
- At list price, monthly cash flow is $550 ($7k/yr) — positive.
- The deal already cash-flows at list — no discount required.
- Meets the 1% rule at list price ($1k rent vs $50k).
- Cap rate 19.5% vs local median 10.2% in Detroit — top-decile yield for the area; either an underpriced asset or a hidden risk that comps aren't pricing in. Stress-test before assuming the spread holds.
Location & tenants
- Location reads 73/100 on livability (#218 in MI) — a middle-class / working-renter tenant base. Strengths: amenities A+, commute A+, cost of living A+; Watch: schools F, crime F, employment F.
- Detroit Public Schools Community District (urban): math 10% / reading 24% proficiency, ranked #499 of 540 in MI (top 92%) — low school quality limits family demand, transient renter base, plan for 1-2y turnover; 90% free/reduced lunch — lower-income household profile, screen leases tightly.
- Market conditions: Rents rising (+3.2%/yr); 283 active listings in the ZIP; 37 comparable units currently listed for rent nearby; rentals at typical pace (median 20d on market — plan ~3-4 weeks tenant-placement turnaround); lower-income renter base — watch delinquency; 2,639 units permitted in Wayne County in 2024 (1,216 in 5+ unit buildings).
- This rent runs 36% of the median local income ($39k/yr) — at the standard rent-burdened threshold; future hikes will face affordability resistance.
Forward outlook
- Local home prices are declining (-3.0%/yr); year-one equity from $346 of loan paydown is wiped out by about $2k of value loss. Plan a longer hold.
- Wayne County population projected at -17% by 2050 — secular population decline; favor cash flow + early exit over multi-decade hold.
- At projected returns (-3.0% appreciation + 3.2% rent growth), your $14k cash investment doubles in ~3 years — after that, you're playing with house money.
Negotiation context
- Only 3 days on market — expect competitive offers; lowballing is unlikely to land.
- 2 sale attempts with the ask held roughly flat each time — persistent listings suggest the price (not the market) is what's stuck; bring a comps-based counter.
Risks & watch-outs
- Watch-outs: built in 1951 — expect roof / HVAC / electrical / plumbing capex.
Questions for the listing agent
- Built in 1951 — when were the roof, HVAC, electrical panel, plumbing, and water heater last replaced?
- Is there a deadline driving the sale (1031 exchange, divorce, estate, relocation)? That informs how much negotiation room exists.
- Schools are F-rated, which usually means shorter tenancies and higher turnover. Who's the typical renter profile here, and what's been the actual vacancy rate?
- Crime grade is F in this area — have there been break-ins, vandalism, or insurance claims at this property in the last 3 years? What carrier currently insures it and at what premium?
- What's the average days-on-market for RENTAL listings here right now (not sales)? A rising rental-DOM trend means longer vacancies and softer asking-rent achievability than the comps imply.
- What's the recent tenant-quality profile in this submarket — average credit score on applications, eviction rate, late-payment / NSF rate, and stable-employment percentage? A property-management company in the area should have these aggregated.
- How much new for-sale + rental construction is in the pipeline within 1–3 miles? Heavy new supply typically softens prices + rents 12–24 months out; constrained supply supports both.
Investment metrics
- 1% rule
- 2.33% ✓
- Cap rate
- 19.49%
- Cash-on-cash
- 47.13%
- DSCR
- 3.10
- GRM
- 3.6
CMA / ARV
- ARV (on-the-fly)
- $68,256
- Comps found
- 12
Show comp detail 12 sales within ~0.75 mi
| Address | Dist | Beds/Ba | Sqft | Sold | Price | $/sf | Match |
|---|---|---|---|---|---|---|---|
| 10710 Curtis St | 0.19mi | 2/1.0 | 865 (+0%) | 11mo | $37,500 | $43 | 82 |
| 17365 Meyers Rd | 0.18mi | 2/1.0 | 942 (+9%) | 4mo | $49,000 | $52 | 73 |
| 18081 Meyers Rd | 0.09mi | 2/1.5 | 946 (+10%) | 6mo | $75,000 | $79 | 73 |
| 16580 Ward Ave | 0.64mi | 2/1.0 | 825 (-4%) | 1mo | $48,000 | $58 | 62 |
| 16510 Littlefield St | 0.74mi | 2/1.0 | 861 (-0%) | 4mo | $45,000 | $52 | 61 |
| 19161 Meyers Rd | 0.70mi | 2/1.0 | 894 (+4%) | 3mo | $87,500 | $98 | 59 |
| 16854 Lesure St | 0.73mi | 3/1.0 (+1) | 886 (+2%) | 3mo | $105,000 | $119 | 54 |
| 16937 Birwood St | 0.49mi | 2/1.0 | 960 (+11%) | 13mo | $55,000 | $57 | 47 |
| 16919 Littlefield St | 0.53mi | 3/2.0 (+1) | 980 (+13%) | 5mo | $199,900 | $204 | 40 |
| 18267 Stansbury St | 0.71mi | 3/1.0 (+1) | 926 (+7%) | 12mo | $146,000 | $158 | 40 |
| 18636 Washburn St | 0.64mi | 3/1.5 (+1) | 967 (+12%) | 7mo | $62,500 | $65 | 37 |
| 16644 Ilene St | 0.70mi | 3/1.0 (+1) | 984 (+14%) | 14mo | $90,000 | $91 | 27 |
Match score weights: distance 35% · size 25% · config 20% · recency 20%. Top-matched comps best support the ARV.
Projected returns pro-forma
-3.0% appreciation · 3.25% rent growth · sell at horizon
- IRR
- 44.8%
- Equity multiple
- 2.95×
- Total profit
- $27,249
- Equity at exit
- $7,455
- IRR
- 50.8%
- Equity multiple
- 6.01×
- Total profit
- $70,177
- Equity at exit
- $4,323
Cash invested: $14,000 (down + closing). Projections, not guarantees.
Landlord ↔ Tenant lean methodology
- Overall (STATE)
- 62 Landlord-Friendly
- State Michigan
- 62 Landlord-Friendly · EVEN
- County
- — inherits STATE
- City
- — inherits STATE
ZIP-level market 48235
- Rents YoY
- 3.2%
- Active inventory
- 283
- Price-to-rent
- 3.6×
Monthly cashflow live
- Estimated rent
- $1,167 high interval (Pro) →
- Mortgage (P&I)
- −$262
- Tax from tax record
- −$89 /mo · $1,067/yr
- Insurance
- −$21
- HOA
- −$0
- Vacancy / Maint / Mgmt
- −$245
- Net cashflow
- $550
Break-even live
UW: 25.0% down · 7.5% · 30yr · 1.5% tax · 5.0% vac · 8.0% maint · 8.0% mgmt
Financing live
Cash to close
- Down payment
- $12,500
- Closing costs
- $1,500
- Reserves months
- —
- Total cash needed
- —
Loan-product check · same deal, 3 products live
Conventional
25% down · 7.5% · 30yr
- Down + closing
- —
- Monthly P&I
- —
- Monthly cashflow
- —
- DSCR
- —
- Eligible?
- —
Personal DTI + credit; lowest rate.
DSCR
20% down · 8.5% · 30yr
- Down + closing
- —
- Monthly P&I
- —
- Monthly cashflow
- —
- DSCR
- —
- Eligible?
- —
No personal income docs; deal must DSCR.
Hard money
10% down · 12.0% · 12mo
- Down + closing
- —
- Monthly P&I
- —
- Monthly cashflow
- —
- DSCR
- —
- Eligible?
- —
Short-term bridge; refi at stabilization.
Rent comps 37 comps
| Address | Beds | Baths | Sqft | Rent | $/sqft | DOM | Units | Dist |
|---|---|---|---|---|---|---|---|---|
| 17150 Meyers Rd Detroit, MI | 1.0–2.0 | 1.0 | 775 | $975 | $1.26 | 43d | 2 | 0.31mi |
| 18675 Meyers Rd Unit 18677 Detroit, MI | 2.0 | 1.0 | 942 | $1,100 | $1.17 | 43d | 1 | 0.47mi |
| 18461 Washburn St Detroit, MI | 1.0 | 1.0 | 690 | $775 | $1.12 | 43d | 1 | 0.56mi |
| 18010 Lesure St Detroit, MI | 3.0 | 1.0 | 1010 | $1,550 | $1.53 | 24d | 1 | 0.57mi |
| 18512 Schaefer Hwy Detroit, MI | 2.0 | 1.0 | 962 | $1,200 | $1.25 | 24d | 1 | 0.59mi |
| 16503 Ward Ave Unit 2 Detroit, MI | 2.0 | 1.0 | 700 | $850 | $1.21 | 43d | 1 | 0.71mi |
| 16204 Steel St Detroit, MI | 3.0 | 1.0 | 969 | $1,150 | $1.19 | 43d | 1 | 0.76mi |
| 18637 James Couzens Fwy Unit C103 Detroit, MI | 1.0 | 1.0 | 630 | $835 | $1.33 | 43d | 1 | 0.78mi |
| 18637 James Couzens Fwy Apt 103A Detroit, MI | 1.0 | 1.0 | 630 | $835 | $1.33 | 1d | 1 | 0.78mi |
| 17159 Northlawn St Unit 17161 Detroit, MI | 2.0 | 1.0 | 1122 | $975 | $0.87 | 4d | 1 | 0.92mi |
| 16505 Stansbury St Detroit, MI | 3.0 | 1.0 | 1100 | $1,250 | $1.14 | 10d | 1 | 0.93mi |
| 16230 Indiana St Unit 2 Detroit, MI | 2.0 | 1.0 | 1050 | $1,200 | $1.14 | 17d | 1 | 0.99mi |
| 15760 Monte Vista St Detroit, MI | 2.0 | 1.0 | 1080 | $1,250 | $1.16 | 43d | 1 | 1.06mi |
| 15738 Sorrento Ave Detroit, MI | 3.0 | 1.0 | 762 | $1,175 | $1.54 | 43d | 1 | 1.07mi |
| 19474 Schaefer Hwy Detroit, MI | 2.0 | 1.0 | 896 | $1,075 | $1.20 | 4d | 1 | 1.08mi |
| 15878 Kentucky St Detroit, MI | 2.0 | 1.0 | 800 | $900 | $1.12 | 43d | 1 | 1.10mi |
| 15839 Kentucky St Detroit, MI | 2.0 | 1.0 | 800 | $1,200 | $1.50 | 17d | 1 | 1.11mi |
| 15765 Washburn St Detroit, MI | 2.0 | 1.0 | 1093 | $950 | $0.87 | 43d | 1 | 1.15mi |
| 15512 Mendota St Detroit, MI | 2.0 | 1.0 | 931 | $1,200 | $1.29 | 4d | 1 | 1.16mi |
| 15512 Mendota St Apt 2 Detroit, MI | 2.0 | 1.0 | 1000 | $1,200 | $1.20 | 43d | 1 | 1.16mi |
| 19929 Monte Vista St Detroit, MI | 3.0 | 1.0 | 860 | $1,450 | $1.69 | 17d | 1 | 1.18mi |
| 15777 Wisconsin St Unit 77 Detroit, MI | 2.0 | 1.0 | 900 | $950 | $1.06 | 4d | 1 | 1.24mi |
| 15388 Appoline St #203 Detroit, MI | 2.0 | 1.0 | 900 | $850 | $0.94 | 43d | 1 | 1.25mi |
| 15517 Lesure St Unit BDRM1A Detroit, MI | 2.0 | 1.0 | 1000 | $850 | $0.85 | 24d | 1 | 1.26mi |
| 16722 Tuller St Detroit, MI | 3.0 | 1.5 | 1100 | $1,500 | $1.36 | 16d | 1 | 1.27mi |
| 20032 Monte Vista St Detroit, MI | 3.0 | 1.0 | 1000 | $1,294 | $1.29 | 20d | 1 | 1.28mi |
| 20122 Manor St Detroit, MI | 3.0 | 1.0 | 1028 | $1,200 | $1.17 | 43d | 1 | 1.32mi |
| 15340 Hartwell St Detroit, MI | 2.0 | 1.0 | 900 | $1,300 | $1.44 | 16d | 1 | 1.37mi |
| 15387 Lesure St Detroit, MI | 3.0 | 1.0 | 1064 | $1,350 | $1.27 | 12d | 1 | 1.39mi |
| 17147 Monica St Unit 2 1 Detroit, MI | 2.0 | 1.0 | 900 | $975 | $1.08 | 24d | 1 | 1.39mi |
| 17551 Santa Rosa Dr Detroit, MI | 2.0 | 1.0 | 1036 | $1,095 | $1.06 | 43d | 1 | 1.41mi |
| 20009 Wisconsin St Detroit, MI | 3.0 | 1.5 | 1051 | $1,400 | $1.33 | 17d | 1 | 1.41mi |
| 20245 Manor Detroit, MI | 3.0 | 1.0 | 1018 | $1,400 | $1.38 | 2d | 1 | 1.44mi |
| 17145 Santa Rosa Dr Unit 1 Detroit, MI | 3.0 | 1.0 | 1050 | $1,400 | $1.33 | 17d | 1 | 1.44mi |
| 18481 Prest St Detroit, MI | 3.0 | 1.5 | 1100 | $1,300 | $1.18 | 19d | 1 | 1.45mi |
| 17150 Santa Rosa Dr Detroit, MI | 1.0 | 1.0 | 950 | $1,250 | $1.32 | 17d | 1 | 1.47mi |
| 20429 Monte Vista St Detroit, MI | 3.0 | 1.0 | 872 | $1,300 | $1.49 | 17d | 1 | 1.49mi |
Listing history 3 events
-
2026-06-13statusdays on market $50,000 Pending 3 DOM
-
2026-06-08remarks 534-char remark
Show marketing remark (540 chars)
1/2 DUPLEX IN THE VIBRANT 48235 MEYERS CORRIDOR! NEAR BRAND NEW HOUSING , THE NORTHWEST ACTIVTIES CENTER, HOME DEPOT, AND THE MC NICHOLS COMMERCIAL CORRIDOR. THIS DUPLEX HAS 2 BEDROOMS AND A BONUS ROOM, A 2-CAR GARAGE, AND A BASEMENT HALF BATH. THE DINING ROOM HAS BEEN OPENED TO THE KITCHEN. PROPERTY NEEDS WORK AND IS BEING SOLD "AS IS. " BUT WHEN YOU PUT YOUR FINISHING TOUCHES ON THIS ONE YOU WILL HAVE A PREMIUM DUPLEX BECAUSE OF THE GARAGE, OPEN KITCHEN AREA BONUS ROOM, AND HALF BATH WHICH THE AVERAGE DUPLEX DOES NOT HAVE!
-
2026-06-08$50,000 Active 1 DOM
Show marketing remark (540 chars)
1/2 DUPLEX IN THE VIBRANT 48235 MEYERS CORRIDOR! NEAR BRAND NEW HOUSING , THE NORTHWEST ACTIVTIES CENTER, HOME DEPOT, AND THE MC NICHOLS COMMERCIAL CORRIDOR. THIS DUPLEX HAS 2 BEDROOMS AND A BONUS ROOM, A 2-CAR GARAGE, AND A BASEMENT HALF BATH. THE DINING ROOM HAS BEEN OPENED TO THE KITCHEN. PROPERTY NEEDS WORK AND IS BEING SOLD "AS IS. " BUT WHEN YOU PUT YOUR FINISHING TOUCHES ON THIS ONE YOU WILL HAVE A PREMIUM DUPLEX BECAUSE OF THE GARAGE, OPEN KITCHEN AREA BONUS ROOM, AND HALF BATH WHICH THE AVERAGE DUPLEX DOES NOT HAVE!
ⓘ Source: listings_history table (triggers on properties + properties_extension) + one-shot
backfill from property_details.listing_events for pre-trigger history.
Tax reassessment forecast MI · Partial reset (capped growth)
- Current annual tax
- $1,067 · $89/mo
- Projected year-2 tax
- $1,067 · $89/mo
- Expected delta
- $0/yr ($0/mo · 0.0%)
ⓘ Screening estimate from a state-policy table — verify with the county assessor before closing.
Climate risk First Street
- Flood 4/10 Moderate FEMA zone X (unshaded) · 20% chance over 30 yrs
- Wildfire 1/10 Low
- Heat 3/10 Moderate 7 d/yr ≥97°F today · 15 d/yr by 30 yrs out
- Wind 2/10 Low
- Air quality 3/10 Moderate 2 unhealthy d/yr today · 5 by 30 yrs out
Nearby sold comps map
Loading sold comps map…
Walkable amenities ~0.75 mi
Loading nearby amenities…
Taxation est. · year 1
- Rental income
- $14,003
- − Mortgage interest
- −$2,801
- − Property taxes
- −$1,067
- − Insurance
- −$250
- − Repairs & maintenance
- −$1,120
- − Management
- −$1,120
- − Depreciation
- −$1,455
- Taxable income
- $6,190
- Est. tax owed @ 24.0%
- −$1,486
- After-tax cash flow
- $5,113/yr
For passive investors: Depreciation is non-cash, so a rental often shows a tax loss while cash-flowing — sheltering income. Rental losses are passive: they offset passive income freely, and up to $25,000/yr can offset ordinary (W-2) income if you actively participate and your MAGI is under $100k (phasing out to $0 by $150k); unused losses carry forward. On sale, claimed depreciation is recaptured at up to 25%, and gains may owe capital-gains tax (a 1031 exchange can defer both). Figures are a year-1 estimate at your 24.0% rate — not tax advice; consult a CPA.
Schools (NCES district)
- District
- Detroit Public Schools Community District
- NCES district ID
- 2601103
- Math proficiency
- 10% ▼ -2.00%
- Reading proficiency
- 24% ▲ 6.00%
- Median HH income
- $25,815
- Composite
- 13.06/100
- National rank
- #9564
- State rank
- #499 of 540 in MI
Livability — Detroit
- Score
- 73/100
- State rank
- #218
- US rank
- #5427
Category grades
Schools grade is shown separately in the Schools card above.
Census & demographics
- Census place
- Detroit, MI
- County
- Wayne County · 1,562,939 people
- City population
- 572,865
- Metro
- Detroit-Warren-Dearborn, MI
- Population (ZIP)
- 45,600
- Household income
- $39,265
- Rent vs Own
- Severe rent burden
- 3064.0
Population outlook (Wayne County) Hauer SSP2
- Today (2025)
- 1,675,273 people
- By 2030
- 1,620,300 · -3.3%
- By 2040
- 1,502,341 · -10.3%
- By 2050
- 1,384,039 · -17.4%
- By 2075
- 1,124,592 · -32.9%
- By 2100
- 881,193 · -47.4%
Race, ethnicity, and origin ACS 2023
- Neighborhood character
- Predominantly Black (94%)
- Race & ethnicity
- Black 94% White 3% Two or more races 2% Hispanic / Latino 1%
- Foreign-born
- 1% · Canada
- Languages at home
- 98% English-only · Spanish 1%
Political lean MEDSL · Wayne
- 2024 margin
- Strong D (+29.0) · D 62.7% · R 33.7% · Other 3.6%
- 2008→2024 swing
- -20.5pp toward R · 2008: 49.5pp · 2024: 29.0pp
- All cycles
- 2024: D+29.0 2020: D+38.1 2016: D+37.3 2012: D+46.9 2008: D+49.5
Not yet ingested
- Civics
- —
Market trends
- HPI YoY
- ▼ -153.02%
- Current HPI
- 263.6326
- Rent YoY
- ▲ 3.25%
- Metro
- Detroit-Warren-Dearborn, MI
- State GDP YoY
- ▲ 1.37%
- F500 in state
- 28
Industry mix (Fortune 500 HQ in MI)
| Industry | F500 HQs | Revenue |
|---|---|---|
| Automotive Parts | 3 | $48B |
|
||
| Automotive | 2 | $372B |
|
||
| Chemicals | 1 | $45B |
|
||
| Automotive Retail | 1 | $29B |
|
||
| Healthcare / Medical Devices | 1 | $23B |
|
||
| Automotive Technology | 1 | $20B |
|
||
Price history
+0.0% since first listed2 events — show timeline
- 2026-06-08 Listed $50,000 MiRealSource-MiMLS
- 2026-06-08 Listed $50,000 REALCOMP
Property tax history
-1.7%/yrLatest (2025): $1,067 · +0.5% YoY. Source: county tax records.
Cash-flow waterfall
monthlySold comps — $/sqft
last 12 mo · ≤1 miLoading sold comps…