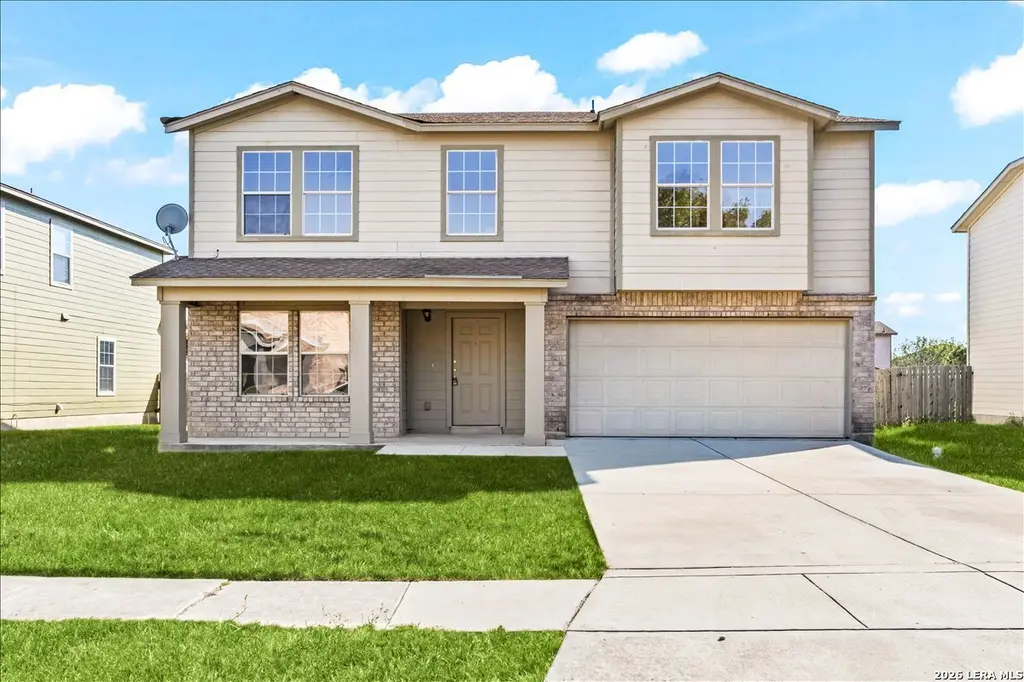
671 Northwest Crossing Dr · New Braunfels, TX
Flood risk 1/10 · Minimal
- FEMA flood zone
- X (unshaded)
- Chance of flooding over 30 yrs
- 0.0%
- Est. flood insurance / yr
- $507 – $1,088
Fire risk 5/10 · Moderate
- Est. fire insurance / yr
- $1,222 – $2,270
Heat risk 8/10 · Major
- Hot days now (above 108°F)
- 7 days/yr
- Hot days in 30 yrs
- 23 days/yr
Wind risk 8/10 · Major
- Chance of severe wind over 30 yrs
- 80.0%
Air-quality risk 2/10 · Minimal
- Unhealthy air days now
- 0 days/yr
- Unhealthy air days in 30 yrs
- 1 days/yr
Risk factors via First Street. Map © Google.
Why this score? — see what drove the C- grade
The composite is a weighted blend of 9 inputs, each scored 0–100. Each bar is that input's sub-score; the figure is the points it added to the 100-point composite (weight × sub-score).
- ARV discount +15.0/15.0
- Cash flow +13.8/30.0
- Schools +5.2/10.0
- 1% rule +4.6/10.0
- DSCR +4.2/10.0
- Livability +4.2/5.0
- Condition / age +2.5/5.0
- Rent growth +2.0/5.0
- Appreciation +0.0/10.0
$249,900
🖨 Deal sheet 📄 Offer letter ✓ Due diligence
Listing remarks
Welcome to 671 NW Crossing in the NW Crossing subdivision on the northeast side of New Braunfels. This spacious two-story home offers 4 bedrooms, 2.5 bathrooms, and 2,736 square feet of comfortable living space designed for both everyday life and entertaining. As one of the largest homes under $250K in the area and offering exceptional value per square foot in New Braunfels, this property stands out for buyers seeking space, flexibility, and affordability. Inside, you'll find fresh updates that give the home a clean, modern feel, including luxury vinyl plank flooring, fresh interior paint, updated lighting fixtures, and bright natural light throughout. The open-concept living and dining are
Key facts
- Large walk-in closet
- Private bathroom
- Granite countertops
Tags
Property features AI
Finance
- Financial info: Down payment assistance resources available
- HOA & community: Mandatory HOA; HOA fee $275 annually; Association transfer fee $400; Community amenities include park/playground and sports court
Exterior
- Parking: Attached 2-car garage
- Utilities: Public water; Public sewer
- Home design: Brick and siding exterior; Pre-owned home; Approximately 21 years old; Slab foundation; Composition roof; Builder: Fieldstone; Subdivision: NORTHWEST CROSSING
- Construction: Brick and siding construction; Slab foundation; Composition roof; Built approximately 21 years ago
- Exterior features: Covered patio; Patio slab; Privacy fence; Sprinkler system; Double pane windows; Street paved with curbs, gutters, sidewalks and streetlights
Interior
- Kitchen: Dishwasher; Disposal; Microwave oven; Stove/Range; Solid countertops; Kitchen dimensions: 18 x 13
- Bedrooms: Master bedroom on upper level with ceiling fan and full bath; Bedroom 2: 13 x 10; Bedroom 3: 13 x 10; Bedroom 4: 11 x 13; Master bedroom dimensions: 18 x 19
- Flooring: Ceramic tile; Vinyl flooring
- Bathrooms: Total of 3 bathrooms (2 full, 1 half); Master bath with separate tub and shower, separate vanity, and garden tub; Master bath dimensions: 13 x 14
- Heating & cooling: Central heating (electric); Central air conditioning (1 unit)
- Interior features: Ceiling fans; Chandelier; Smoke alarm; Gas water heater; Solid countertops; Living/Dining room combination; Eat-in kitchen with breakfast bar; Two eating areas; Walk-in pantry; Study/Library; Utility room inside; Open floor plan; Ground level/no steps; All bedrooms on upper level; Laundry room (main and lower level options); Walk-in closets
- Laundry & utility: Washer connection; Dryer connection; Laundry room present; Utility room dimensions: 13 x 5
Neighborhood map
What this means for you Summary
Snapshot
- This is a 4-bed/2.0-bath single-family listed at $250k.
Deal economics
- At list price, monthly cash flow is $21 ($252/yr) — positive.
- The deal already cash-flows at list — no discount required.
- To meet the 1% rule (rent ≥ 1% of price), the offer needs to be $241k (3.7% below list).
- Recommended offer: $241k (3.7% below list) — sets the bar for 1% rule.
- Cap rate 6.4% vs local median 3.4% in New Braunfels — top-decile yield for the area; either an underpriced asset or a hidden risk that comps aren't pricing in. Stress-test before assuming the spread holds.
Location & tenants
- Location reads 83/100 on livability (#9 in TX, #925 nationally) — a professional / high-income tenant draw. Strengths: amenities A+, housing A+, health & safety A+; Watch: commute F.
- Comal ISD (rural): math 57% / reading 59% proficiency, ranked #58 of 826 in TX (top 7%) — acceptable for families but not a draw, mixed tenant base, ~2y average lease.
- Zoned schools: Oak Creek El (math 53% / reading 57%, grade C, #602 of 4,322 statewide, top 14%, 765 students, 37% FRL); Canyon H S (math 59% / reading 65%, grade B-, #237 of 1,632 statewide, top 16%, 2,348 students, 35% FRL) — zoned schools at 36% FRL track the district average.
- Market conditions: Rents soft (-2.0%/yr); 1896 active listings in the ZIP; 15 comparable units currently listed for rent nearby; rentals at typical pace (median 24d on market — plan ~3-4 weeks tenant-placement turnaround); solid renter incomes; 3,420 units permitted in Comal County in 2024 (1,164 in 5+ unit buildings).
- This rent runs 35% of the median local income ($83k/yr) — at the standard rent-burdened threshold; future hikes will face affordability resistance.
Forward outlook
- Local home prices are declining (-3.0%/yr); year-one equity from $2k of loan paydown is wiped out by about $7k of value loss. Plan a longer hold.
- Comal County population projected at +70% by 2050 — long-run rental-demand tailwind backs the buy-and-hold thesis.
Negotiation context
- It's been on market 23 days — a 2% lower offer ($246k) is reasonable based on typical stale-listing flexibility.
- 4 sale attempts with the ask held roughly flat each time — persistent listings suggest the price (not the market) is what's stuck; bring a comps-based counter.
Risks & watch-outs
- Climate carrying-cost: severe wind risk, 80% chance of damaging wind over 30y; moderate wildfire risk; extreme-heat days projected 7→23/yr by 2055 (HVAC capex compounding) — expect insurance premiums to compound above CPI over the hold.
Questions for the listing agent
- What does the HOA fee cover, when was the last increase, and are there any pending special assessments or reserve-fund shortfalls?
- Is there a deadline driving the sale (1031 exchange, divorce, estate, relocation)? That informs how much negotiation room exists.
- Schools are B-rated — typically a magnet for longer-tenancy family renters. What's the average tenant stay here, and is there a school-zone premium baked into asking?
- What's the average days-on-market for RENTAL listings here right now (not sales)? A rising rental-DOM trend means longer vacancies and softer asking-rent achievability than the comps imply.
- What's the recent tenant-quality profile in this submarket — average credit score on applications, eviction rate, late-payment / NSF rate, and stable-employment percentage? A property-management company in the area should have these aggregated.
- How much new for-sale + rental construction is in the pipeline within 1–3 miles? Heavy new supply typically softens prices + rents 12–24 months out; constrained supply supports both.
Investment metrics
- 1% rule
- 0.96% ✗
- Cap rate
- 6.39%
- Cash-on-cash
- 0.36%
- DSCR
- 1.02
- GRM
- 8.7
CMA / ARV
- ARV (median comp)
- $455,265
- List price
- $249,900
- Delta
- -45.11%
- Verdict
- UNDERPRICED
- Comps
- 20 within 1.0 mi
Show comp detail 12 sales within ~0.75 mi
| Address | Dist | Beds/Ba | Sqft | Sold | Price | $/sf | Match |
|---|---|---|---|---|---|---|---|
| 736 Great Cloud | 0.38mi | 4/2.5 | 2,843 (+4%) | 0mo | $369,000 | $130 | 73 |
| 751 Stratus | 0.40mi | 4/2.5 | 2,822 (+3%) | 1mo | $359,000 | $127 | 73 |
| 724 Sunforest Ln | 0.57mi | 4/3.0 | 2,827 (+3%) | 0mo | $508,695 | $180 | 63 |
| 3018 Alster | 0.49mi | 4/3.0 | 2,593 (-5%) | 1mo | $449,900 | $174 | 63 |
| 653 Broomsedge St | 0.69mi | 4/3.0 | 2,748 (+0%) | 1mo | $414,990 | $151 | 62 |
| 754 Cumulus Cloud Dr | 0.69mi | 4/3.5 | 2,742 (+0%) | 1mo | $419,990 | $153 | 61 |
| 719 Sunforest Ln | 0.59mi | 4/3.0 | 2,889 (+6%) | 1mo | $474,990 | $164 | 58 |
| 309 Hummingbird Dr | 0.52mi | 4/2.5 | 2,472 (-10%) | 2mo | $269,000 | $109 | 57 |
| 3613 Black Cloud Dr | 0.59mi | 5/3.0 (+1) | 2,582 (-6%) | 1mo | $380,000 | $147 | 53 |
| 3587 Starbright Dr | 0.70mi | 5/3.0 (+1) | 2,830 (+3%) | 2mo | $424,990 | $150 | 51 |
| 3639 Clear Cloud | 0.66mi | 5/3.5 (+1) | 2,972 (+9%) | 0mo | $380,000 | $128 | 44 |
| 850 Saltbush St | 0.62mi | 5/4.0 (+1) | 2,950 (+8%) | 2mo | $419,990 | $142 | 44 |
Match score weights: distance 35% · size 25% · config 20% · recency 20%. Top-matched comps best support the ARV.
Projected returns pro-forma
-3.0% appreciation · 0.0% rent growth · sell at horizon
- IRR
- -19.4%
- Equity multiple
- 0.34×
- Total profit
- $-46,084
- Equity at exit
- $37,261
- IRR
- -21.0%
- Equity multiple
- 0.07×
- Total profit
- $-65,142
- Equity at exit
- $21,607
Cash invested: $69,972 (down + closing). Projections, not guarantees.
Landlord ↔ Tenant lean methodology
- Overall (STATE)
- 87 Strongly Landlord-Friendly
- State Texas
- 87 Strongly Landlord-Friendly · R+5
- County
- — inherits STATE
- City
- — inherits STATE
ZIP-level market 78130
- Rents YoY
- -2.0%
- Active inventory
- 1896
- Price-to-rent
- 8.7×
Monthly cashflow live
- Estimated rent
- $2,407 high interval (Pro) →
- Mortgage (P&I)
- −$1,311
- Tax from tax record
- −$443 /mo · $5,318/yr
- Insurance
- −$104
- HOA
- −$23
- Vacancy / Maint / Mgmt
- −$506
- Net cashflow
- $21
Break-even live
UW: 25.0% down · 7.5% · 30yr · 1.5% tax · 5.0% vac · 8.0% maint · 8.0% mgmt
Financing live
Cash to close
- Down payment
- $62,475
- Closing costs
- $7,497
- Reserves months
- —
- Total cash needed
- —
Loan-product check · same deal, 3 products live
Conventional
25% down · 7.5% · 30yr
- Down + closing
- —
- Monthly P&I
- —
- Monthly cashflow
- —
- DSCR
- —
- Eligible?
- —
Personal DTI + credit; lowest rate.
DSCR
20% down · 8.5% · 30yr
- Down + closing
- —
- Monthly P&I
- —
- Monthly cashflow
- —
- DSCR
- —
- Eligible?
- —
No personal income docs; deal must DSCR.
Hard money
10% down · 12.0% · 12mo
- Down + closing
- —
- Monthly P&I
- —
- Monthly cashflow
- —
- DSCR
- —
- Eligible?
- —
Short-term bridge; refi at stabilization.
Rent comps 15 comps
| Address | Beds | Baths | Sqft | Rent | $/sqft | DOM | Units | Dist |
|---|---|---|---|---|---|---|---|---|
| 908 Ulster Unit NA New Braunfels, TX | 4.0 | 3.0 | 2219 | $2,795 | $1.26 | 24d | 1 | 0.46mi |
| 373 Starling Crk New Braunfels, TX | 3.0 | 2.5 | 1794 | $1,950 | $1.09 | 43d | 1 | 0.48mi |
| 2935 Aller New Braunfels, TX | 5.0 | 3.0 | 2457 | $2,645 | $1.08 | 14d | 1 | 0.51mi |
| 364 Starling Crk New Braunfels, TX | 4.0 | 2.5 | 2477 | $2,175 | $0.88 | 24d | 1 | 0.51mi |
| 3629 Blue Cloud Dr New Braunfels, TX | 4.0 | 2.0 | 1877 | $2,295 | $1.22 | 14d | 1 | 0.61mi |
| 138 Woodpecker Run New Braunfels, TX | 3.0 | 2.5 | 1936 | $1,725 | $0.89 | 24d | 1 | 0.74mi |
| 240 Oak Creek Way New Braunfels, TX | 4.0 | 2.5 | 2267 | $2,395 | $1.06 | 24d | 1 | 0.76mi |
| 2983 Panther Spg New Braunfels, TX | 4.0 | 2.5 | 2142 | $2,195 | $1.02 | 24d | 1 | 0.81mi |
| 2837 Brogan Crk New Braunfels, TX | 4.0 | 2.5 | 2042 | $2,275 | $1.11 | 17d | 1 | 1.04mi |
| 2826 Wolfcreek New Braunfels, TX | 4.0 | 2.5 | 2118 | $2,800 | $1.32 | 2d | 1 | 1.12mi |
| 105 Sky Country Dr New Braunfels, TX | 4.0 | 2.0 | 1895 | $4,300 | $2.27 | 43d | 1 | 1.16mi |
| 316 Hulda Trl New Braunfels, TX | 4.0 | 3.0 | 2426 | $3,000 | $1.24 | 11d | 1 | 1.41mi |
| 1233 Fox Wing Way New Braunfels, TX | 4.0 | 3.0 | 2377 | $2,750 | $1.16 | 4d | 1 | 1.44mi |
| 116 Radnor Rd New Braunfels, TX | 3.0 | 2.0 | 1825 | $2,450 | $1.34 | 43d | 1 | 1.45mi |
| 129 Radnor Rd New Braunfels, TX | 4.0 | 4.0 | 2800 | $2,800 | $1.00 | 43d | 1 | 1.48mi |
HOA detail
- Monthly dues
- $23 · $276/yr
Listing history 26 events
-
2026-06-08status $249,900 Pending 23 DOM
-
2026-06-07days on market $249,900 Active Option 23 DOM
-
2026-06-04days on market $249,900 Active Option 20 DOM
-
2026-06-03days on market $249,900 Active Option 19 DOM
-
2026-06-02days on market $249,900 Active Option 18 DOM
-
2026-06-01days on market $249,900 Active Option 17 DOM
-
2026-05-31days on market $249,900 Active Option 16 DOM
-
2026-05-15$249,900 New 1765-char remark
-
2026-04-15historical
-
2026-04-15historical
-
2026-02-20price $269,900
-
2026-02-20price
-
2026-02-20price $269,900
-
2026-01-06price $279,000
-
2026-01-06price
-
2026-01-06price $279,000
-
2025-10-22price $289,000
-
2025-10-22price
-
2025-10-22price $289,000
-
2025-07-31price $299,999
-
2025-07-31price
-
2025-07-31price $299,999
-
2025-07-07Active
-
2025-06-26$312,000 New
-
2025-06-26$312,000 Active
-
2006-04-18soldstatus
ⓘ Source: listings_history table (triggers on properties + properties_extension) + one-shot
backfill from property_details.listing_events for pre-trigger history.
Tax reassessment forecast TX · Resets to sale price
- Current annual tax
- $5,318 · $443/mo
- Projected year-2 tax
- $5,318 · $443/mo
- Expected delta
- $0/yr ($0/mo · 0.0%)
ⓘ Screening estimate from a state-policy table — verify with the county assessor before closing.
Climate risk First Street
- Flood 1/10 Low FEMA zone X (unshaded) · 0% chance over 30 yrs
- Wildfire 5/10 Major
- Heat 8/10 Severe 7 d/yr ≥108°F today · 23 d/yr by 30 yrs out
- Wind 8/10 Severe 80% chance of damaging wind over 30 yrs
- Air quality 2/10 Low 0 unhealthy d/yr today · 1 by 30 yrs out
Nearby sold comps map
Loading sold comps map…
Walkable amenities ~0.75 mi
Loading nearby amenities…
Taxation est. · year 1
- Rental income
- $28,887
- − Mortgage interest
- −$13,998
- − Property taxes
- −$5,318
- − Insurance
- −$1,250
- − Repairs & maintenance
- −$2,311
- − Management
- −$2,311
- − HOA
- −$276
- − Depreciation
- −$7,270
- Taxable loss
- −$3,846
- Est. tax savings @ 24.0%
- +$923
- After-tax cash flow
- $1,175/yr
For passive investors: Depreciation is non-cash, so a rental often shows a tax loss while cash-flowing — sheltering income. Rental losses are passive: they offset passive income freely, and up to $25,000/yr can offset ordinary (W-2) income if you actively participate and your MAGI is under $100k (phasing out to $0 by $150k); unused losses carry forward. On sale, claimed depreciation is recaptured at up to 25%, and gains may owe capital-gains tax (a 1031 exchange can defer both). Figures are a year-1 estimate at your 24.0% rate — not tax advice; consult a CPA.
Schools (NCES district)
- District
- Comal ISD
- NCES district ID
- 4814730
- Math proficiency
- 57% ▼ -9.00%
- Reading proficiency
- 59% ▼ -2.00%
- Median HH income
- $74,792
- Composite
- 51.79/100
- National rank
- #1671
- State rank
- #58 of 826 in TX
Livability — New Braunfels
- Score
- 83/100
- State rank
- #9
- US rank
- #925
Category grades
Schools grade is shown separately in the Schools card above.
Census & demographics
- Census place
- New Braunfels, TX
- County
- Comal County · 206,262 people
- City population
- 144,962
- Metro
- San Antonio-New Braunfels, TX
- Population (ZIP)
- 104,009
- Household income
- $83,064
- Rent vs Own
- Severe rent burden
- 2912.0
Population outlook (Comal County) Hauer SSP2
- Today (2025)
- 175,637 people
- By 2030
- 199,911 · +13.8%
- By 2040
- 249,436 · +42.0%
- By 2050
- 299,430 · +70.5%
- By 2075
- 423,857 · +141.3%
- By 2100
- 512,048 · +191.5%
Race, ethnicity, and origin ACS 2023
- Neighborhood character
- Majority White (58%)
- Race & ethnicity
- White 58% Hispanic / Latino 37% Two or more races 19% Black 2%
- Hispanic origin (detail)
- Mexican 32%
- Common ancestry
- Romanian 2% Lithuanian 2% Slovak 2%
- Foreign-born
- 7% · Canada
- Languages at home
- 78% English-only · Spanish 20% German/W. Germanic 1%
Political lean MEDSL · Comal
- 2024 margin
- Solid R (+45.5) · D 26.8% · R 72.2%
- 2008→2024 swing
- +1.9pp toward D · 2008: -47.4pp · 2024: -45.5pp
- All cycles
- 2024: R+45.5 2020: R+42.7 2016: R+50.1 2012: R+54.1 2008: R+47.4
Not yet ingested
- Civics
- —
Market trends
- HPI YoY
- ▼ -190.61%
- Current HPI
- 173.7128
- Rent YoY
- ▼ -1.97%
- Metro
- San Antonio-New Braunfels, TX
- State GDP YoY
- ▲ 3.95%
- F500 in state
- 110
Industry mix (Fortune 500 HQ in TX)
| Industry | F500 HQs | Revenue |
|---|---|---|
| Energy | 16 | $1,198B |
|
||
| Technology | 5 | $198B |
|
||
| Engineering / Construction | 4 | $72B |
|
||
| Energy Services | 3 | $60B |
|
||
| Utilities | 3 | $41B |
|
||
| Healthcare | 2 | $330B |
|
||
Price history
-19.9% since first listed21 events — show timeline
- 2026-06-07 Pending — LERA
- 2026-05-27 Contingent — LERA
- 2026-05-15 Listed $249,900 LERA
- 2026-04-15 Listing Removed — LERA
- 2026-04-15 Listing Removed — CTXMLS
- 2026-02-20 Price Changed $269,900 LERA
- 2026-02-20 Price Changed — Unlock MLS
- 2026-02-20 Price Changed $269,900 CTXMLS
- 2026-01-06 Price Changed $279,000 LERA
- 2026-01-06 Price Changed — Unlock MLS
- 2026-01-06 Price Changed $279,000 CTXMLS
- 2025-10-22 Price Changed $289,000 LERA
- 2025-10-22 Price Changed — Unlock MLS
- 2025-10-22 Price Changed $289,000 CTXMLS
- 2025-07-31 Price Changed $299,999 LERA
- 2025-07-31 Price Changed — Unlock MLS
- 2025-07-31 Price Changed $299,999 CTXMLS
- 2025-07-07 Listed — Unlock MLS
- 2025-06-26 Listed $312,000 LERA
- 2025-06-26 Listed $312,000 CTXMLS
- 2006-04-18 Sold (Public Records) — Public Records
Property tax history
+3.3%/yrLatest (2026): $5,318 · -12.3% YoY. Source: county tax records.
Cash-flow waterfall
monthlySold comps — $/sqft
last 12 mo · ≤1 miLoading sold comps…