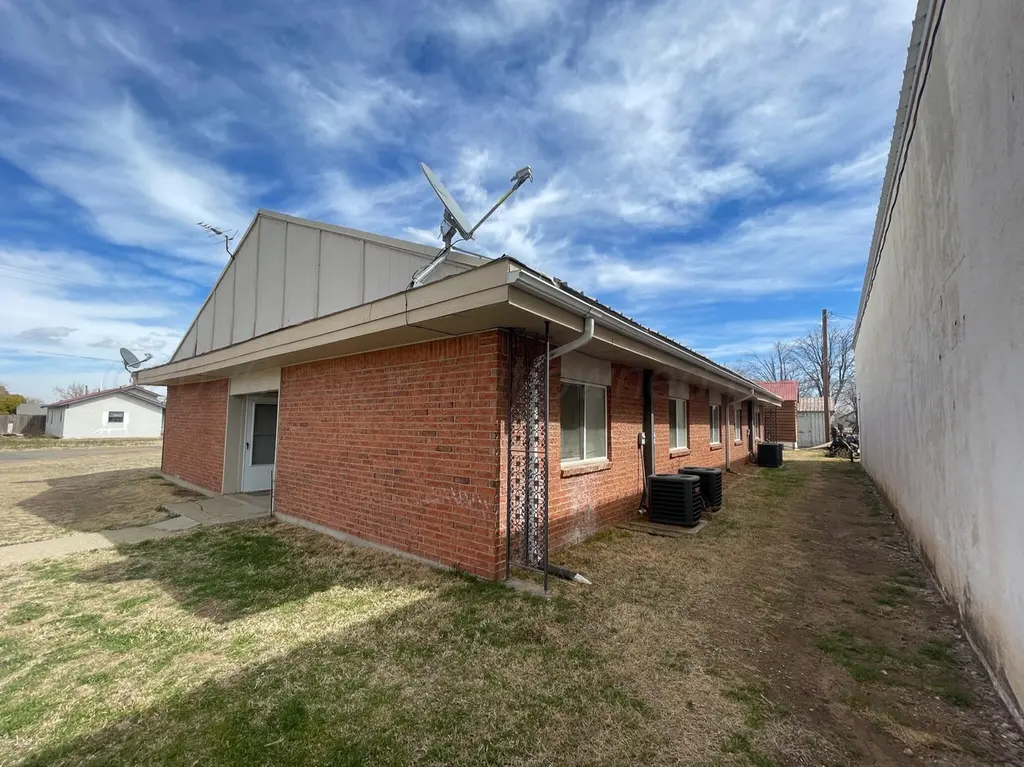
110 Broadway Ave · Groom, TX
Flood risk 1/10 · Minimal
- FEMA flood zone
- X
- Chance of flooding over 30 yrs
- 0.0%
- Est. flood insurance / yr
- $507 – $1,088
Fire risk 5/10 · Moderate
- Est. fire insurance / yr
- $1,222 – $2,270
Heat risk 4/10 · Minor
- Hot days now (above 99°F)
- 7 days/yr
- Hot days in 30 yrs
- 19 days/yr
Wind risk 2/10 · Minimal
- Chance of severe wind over 30 yrs
- 0.0%
Air-quality risk 2/10 · Minimal
- Unhealthy air days now
- 1 days/yr
- Unhealthy air days in 30 yrs
- 1 days/yr
Risk factors via First Street. Map © Google.
Why this score? — see what drove the C grade
The composite is a weighted blend of 9 inputs, each scored 0–100. Each bar is that input's sub-score; the figure is the points it added to the 100-point composite (weight × sub-score).
- Cash flow +20.2/30.0
- ARV discount +7.5/15.0
- DSCR +6.4/10.0
- Appreciation +6.2/10.0
- Schools +5.1/10.0
- 1% rule +4.9/10.0
- Livability +3.3/5.0
- Rent growth +2.5/5.0
- Condition / age +2.5/5.0
$145,000
🖨 Deal sheet 📄 Offer letter ✓ Due diligence
Listing remarks MLS
* * Back on Market BEFORE inspections were done! The seller would love to get this one sold!! * * Great opportunity in Groom, TX! This 4-plex sits on a corner lot and features two 2-bedroom, 1-bath units and two 1-bedroom, 1-bath units. All units are currently occupied with great tenants, offering immediate income potential in a quiet small-town setting. Interested? Let's talk!
Key facts
- Built 1965
- Listed 71 days
Neighborhood map
What this means for you Summary
Snapshot
- This is a 12-bed/1.0-bath other listed at $145k.
Deal economics
- At list price, monthly cash flow is $184 ($2k/yr) — positive.
- The deal already cash-flows at list — no discount required.
- To meet the 1% rule (rent ≥ 1% of price), the offer needs to be $144k (0.7% below list).
- Recommended offer: $136k (6.0% below list) — sets the bar for market timing.
Location & tenants
- Location reads 66/100 on livability (#594 in TX) — a middle-class / working-renter tenant base. Strengths: employment A+, cost of living A+, housing A+; Watch: crime D+, amenities F, commute F.
- Groom ISD (rural): math 65% / reading 50% proficiency, ranked #171 of 1,141 in TX (top 15%) — acceptable for families but not a draw, mixed tenant base, ~2y average lease.
- Market conditions: 6 active listings in the ZIP; 39 units permitted in Carson County in 2024 (0 in 5+ unit buildings).
Forward outlook
- In year one you build about $4k of equity ($1k loan paydown + $3k appreciation (2.4% local appreciation)).
- Carson County population projected at -11% by 2050 — secular population decline; favor cash flow + early exit over multi-decade hold.
- At projected returns (2.4% appreciation + 3.0% rent growth), your $41k cash investment doubles in ~6 years — after that, you're playing with house money.
- By year 8, paydown + projected appreciation supports a ~$33k cash-out refi (75% LTV) — recoverable capital for the next deal without selling this one.
Negotiation context
- It's been on market 72 days — a 6% lower offer ($136k) is reasonable based on typical stale-listing flexibility.
- 4 sale attempts since 14y ago with the ask held roughly flat each time — persistent listings suggest the price (not the market) is what's stuck; bring a comps-based counter.
Risks & watch-outs
- Climate carrying-cost: moderate wildfire risk — expect insurance premiums to compound above CPI over the hold.
Questions for the listing agent
- It's been on market 72 days. Have you received any prior offers? Is the seller open to a 6% concession, seller financing, or rate buy-down credit?
- Built in 1965 — when were the roof, HVAC, electrical panel, plumbing, and water heater last replaced?
- Why hasn't it sold? Are there any deal-killer items the seller is aware of (foundation, flood, title, zoning, code violations)?
- Is there a deadline driving the sale (1031 exchange, divorce, estate, relocation)? That informs how much negotiation room exists.
- Crime grade is D in this area — have there been break-ins, vandalism, or insurance claims at this property in the last 3 years? What carrier currently insures it and at what premium?
- What's the average days-on-market for RENTAL listings here right now (not sales)? A rising rental-DOM trend means longer vacancies and softer asking-rent achievability than the comps imply.
- What's the recent tenant-quality profile in this submarket — average credit score on applications, eviction rate, late-payment / NSF rate, and stable-employment percentage? A property-management company in the area should have these aggregated.
- How much new for-sale + rental construction is in the pipeline within 1–3 miles? Heavy new supply typically softens prices + rents 12–24 months out; constrained supply supports both.
Investment metrics
- 1% rule
- 0.99% ✗
- Cap rate
- 7.82%
- Cash-on-cash
- 5.45%
- DSCR
- 1.24
- GRM
- 8.4
CMA / ARV
No comps found within radius.
Projected returns pro-forma
2.36% appreciation · 3.0% rent growth · sell at horizon
- IRR
- 10.9%
- Equity multiple
- 1.60×
- Total profit
- $24,330
- Equity at exit
- $60,018
- IRR
- 13.5%
- Equity multiple
- 2.88×
- Total profit
- $76,389
- Equity at exit
- $88,653
Cash invested: $40,600 (down + closing). Projections, not guarantees.
Landlord ↔ Tenant lean methodology
- Overall (STATE)
- 87 Strongly Landlord-Friendly
- State Texas
- 87 Strongly Landlord-Friendly · R+5
- County
- — inherits STATE
- City
- — inherits STATE
ZIP-level market 79039
- Home prices YoY
- 2.9%
- Active inventory
- 6
- Price-to-rent
- 8.4×
Monthly cashflow live
- Estimated rent
- $1,440 medium interval (Pro) →
- Mortgage (P&I)
- −$760
- Tax from tax record
- −$132 /mo · $1,587/yr
- Insurance
- −$60
- HOA
- −$0
- Vacancy / Maint / Mgmt
- −$302
- Net cashflow
- $184
Break-even live
UW: 25.0% down · 7.5% · 30yr · 1.5% tax · 5.0% vac · 8.0% maint · 8.0% mgmt
Financing live
Cash to close
- Down payment
- $36,250
- Closing costs
- $4,350
- Reserves months
- —
- Total cash needed
- —
Loan-product check · same deal, 3 products live
Conventional
25% down · 7.5% · 30yr
- Down + closing
- —
- Monthly P&I
- —
- Monthly cashflow
- —
- DSCR
- —
- Eligible?
- —
Personal DTI + credit; lowest rate.
DSCR
20% down · 8.5% · 30yr
- Down + closing
- —
- Monthly P&I
- —
- Monthly cashflow
- —
- DSCR
- —
- Eligible?
- —
No personal income docs; deal must DSCR.
Hard money
10% down · 12.0% · 12mo
- Down + closing
- —
- Monthly P&I
- —
- Monthly cashflow
- —
- DSCR
- —
- Eligible?
- —
Short-term bridge; refi at stabilization.
Listing history 27 events
-
2026-06-18days on market $145,000 Active 72 DOM
-
2026-06-17days on market $145,000 Active 71 DOM
-
2026-06-16days on market $145,000 Active 70 DOM
-
2026-06-15days on market $145,000 Active 69 DOM
-
2026-06-13days on market $145,000 Active 67 DOM
-
2026-06-12days on market $145,000 Active 66 DOM
-
2026-06-09days on market $145,000 Active 63 DOM
-
2026-06-08days on market $145,000 Active 62 DOM
-
2026-06-08days on market $145,000 Active 61 DOM
-
2026-06-05days on market $145,000 Active 59 DOM
-
2026-06-03days on market $145,000 Active 57 DOM
-
2026-06-02days on market $145,000 Active 56 DOM
-
2026-06-01days on market $145,000 Active 55 DOM
-
2026-05-31days on market $145,000 Active 54 DOM
-
2026-04-25status Active 385-char remark
Show marketing remark (385 chars)
* * Back on Market BEFORE inspections were done! The seller would love to get this one sold!! * * Great opportunity in Groom, TX! This 4-plex sits on a corner lot and features two 2-bedroom, 1-bath units and two 1-bedroom, 1-bath units. All units are currently occupied with great tenants, offering immediate income potential in a quiet small-town setting. Interested? Let's talk!
-
2026-04-10historical Active Under Contract 385-char remark
Show marketing remark (385 chars)
* * Back on Market BEFORE inspections were done! The seller would love to get this one sold!! * * Great opportunity in Groom, TX! This 4-plex sits on a corner lot and features two 2-bedroom, 1-bath units and two 1-bedroom, 1-bath units. All units are currently occupied with great tenants, offering immediate income potential in a quiet small-town setting. Interested? Let's talk!
-
2026-04-07$145,000 Active 385-char remark
Show marketing remark (385 chars)
* * Back on Market BEFORE inspections were done! The seller would love to get this one sold!! * * Great opportunity in Groom, TX! This 4-plex sits on a corner lot and features two 2-bedroom, 1-bath units and two 1-bedroom, 1-bath units. All units are currently occupied with great tenants, offering immediate income potential in a quiet small-town setting. Interested? Let's talk!
-
2024-11-04historical $450
-
2024-09-07$450
-
2022-04-08soldstatus
-
2021-04-23soldstatus
-
2012-08-02soldstatus
-
2012-08-01soldstatus 247-char remark
Show marketing remark (247 chars)
BUY NOW AND WATCH YOUR PROFITS GROW! Yes, this needs some work but you can have 4 rental properties for this low price. This 4-Plex has two units that have 2 bedrooms and 1 bath in each and then two units that are 1 bedroom and 1 bath. SOLD AS IS.
-
2012-06-25$48,000 247-char remark
Show marketing remark (247 chars)
BUY NOW AND WATCH YOUR PROFITS GROW! Yes, this needs some work but you can have 4 rental properties for this low price. This 4-Plex has two units that have 2 bedrooms and 1 bath in each and then two units that are 1 bedroom and 1 bath. SOLD AS IS.
-
2002-12-19soldstatus
-
2002-01-17soldstatus
-
2002-01-17soldstatus
ⓘ Source: listings_history table (triggers on properties + properties_extension) + one-shot
backfill from property_details.listing_events for pre-trigger history.
Tax reassessment forecast TX · Resets to sale price
- Current annual tax
- $1,587 · $132/mo
- Projected year-2 tax
- $2,654 · $221/mo
- Expected delta
- +$1,066/yr (+$89/mo · 67.2%)
ⓘ Screening estimate from a state-policy table — verify with the county assessor before closing.
Climate risk First Street
- Flood 1/10 Low FEMA zone X · 0% chance over 30 yrs
- Wildfire 5/10 Major
- Heat 4/10 Moderate 7 d/yr ≥99°F today · 19 d/yr by 30 yrs out
- Wind 2/10 Low 0% chance of damaging wind over 30 yrs
- Air quality 2/10 Low 1 unhealthy d/yr today · 1 by 30 yrs out
Nearby sold comps map
Loading sold comps map…
Walkable amenities ~0.75 mi
Loading nearby amenities…
Taxation est. · year 1
- Rental income
- $17,277
- − Mortgage interest
- −$8,122
- − Property taxes
- −$1,587
- − Insurance
- −$725
- − Repairs & maintenance
- −$1,382
- − Management
- −$1,382
- − Depreciation
- −$4,218
- Taxable loss
- −$140
- Est. tax savings @ 24.0%
- +$34
- After-tax cash flow
- $2,246/yr
For passive investors: Depreciation is non-cash, so a rental often shows a tax loss while cash-flowing — sheltering income. Rental losses are passive: they offset passive income freely, and up to $25,000/yr can offset ordinary (W-2) income if you actively participate and your MAGI is under $100k (phasing out to $0 by $150k); unused losses carry forward. On sale, claimed depreciation is recaptured at up to 25%, and gains may owe capital-gains tax (a 1031 exchange can defer both). Figures are a year-1 estimate at your 24.0% rate — not tax advice; consult a CPA.
Schools (NCES district)
- District
- Groom ISD
- NCES district ID
- 4821840
- Math proficiency
- 65% ▼ -5.00%
- Reading proficiency
- 50% ▼ -5.00%
- Median HH income
- $51,282
- Composite
- 50.87/100
- National rank
- #3868
- State rank
- #171 of 1141 in TX
Livability — Groom
- Score
- 66/100
- State rank
- #594
- US rank
- #11333
Category grades
Schools grade is shown separately in the Schools card above.
Census & demographics
- Census place
- Groom, TX
- Population (ZIP)
- 686
Population outlook (Carson County) Hauer SSP2
- Today (2025)
- 5,631 people
- By 2030
- 5,516 · -2.0%
- By 2040
- 5,190 · -7.8%
- By 2050
- 5,007 · -11.1%
- By 2075
- 4,509 · -19.9%
- By 2100
- 3,458 · -38.6%
Race, ethnicity, and origin ACS 2023
- Neighborhood character
- Predominantly White (95%)
- Race & ethnicity
- White 95% Hispanic / Latino 2% Two or more races 2%
- Common ancestry
- Romanian 2% Portuguese 1% Iranian 1%
- Foreign-born
- 0% · Canada
Political lean MEDSL · Carson
- 2024 margin
- Solid R (+81.2) · D 9.1% · R 90.3%
- 2008→2024 swing
- -9.3pp toward R · 2008: -71.9pp · 2024: -81.2pp
- All cycles
- 2024: R+81.2 2020: R+79.5 2016: R+80.4 2012: R+77.8 2008: R+71.9
Not yet ingested
- Civics
- —
Market trends
- HPI YoY
- ▲ 2.36%
- Current HPI
- 84.5512
- Rent YoY
- —
- Metro
- —
- State GDP YoY
- ▲ 3.95%
- F500 in state
- 110
Industry mix (Fortune 500 HQ in TX)
| Industry | F500 HQs | Revenue |
|---|---|---|
| Energy | 16 | $1,198B |
|
||
| Technology | 5 | $198B |
|
||
| Engineering / Construction | 4 | $72B |
|
||
| Energy Services | 3 | $60B |
|
||
| Utilities | 3 | $41B |
|
||
| Healthcare | 2 | $330B |
|
||
Price history
+202.1% since first listed13 events — show timeline
- 2026-04-25 Relisted — AARMLS
- 2026-04-10 Contingent — AARMLS
- 2026-04-07 Listed $145,000 AARMLS
- 2024-11-04 Rental Removed $450 RENTALBEAST
- 2024-09-07 Listed for Rent $450 RENTALBEAST
- 2022-04-08 Sold (Public Records) — Public Records
- 2021-04-23 Sold (Public Records) — Public Records
- 2012-08-02 Sold (Public Records) — Public Records
- 2012-08-01 Sold (MLS) — AARMLS
- 2012-06-25 Listed $48,000 AARMLS
- 2002-12-19 Sold (Public Records) — Public Records
- 2002-01-17 Sold (Public Records) — Public Records
- 2002-01-17 Sold (Public Records) — Public Records
Property tax history
+7.5%/yrLatest (2025): $1,587 · -2.4% YoY. Source: county tax records.
Cash-flow waterfall
monthlySold comps — $/sqft
last 12 mo · ≤1 miLoading sold comps…