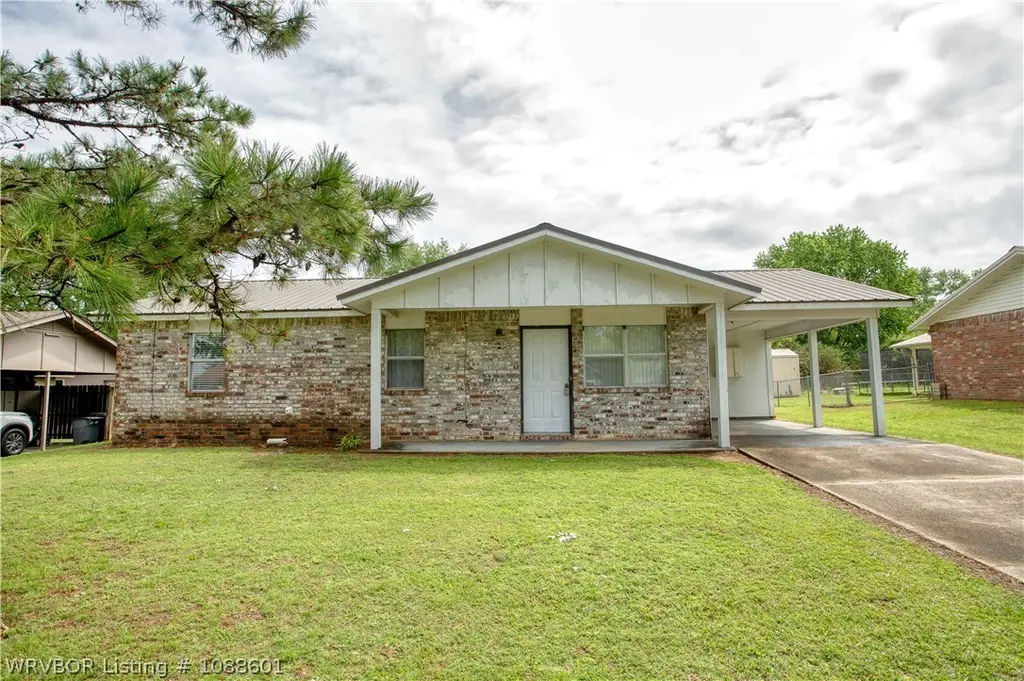
104 B St · Spiro, OK
Flood risk 1/10 · Minimal
- FEMA flood zone
- X (unshaded)
- Chance of flooding over 30 yrs
- 0.0%
- Est. flood insurance / yr
- $507 – $1,088
Fire risk 6/10 · Moderate
- Est. fire insurance / yr
- $2,463 – $4,575
Heat risk 6/10 · Moderate
- Hot days now (above 112°F)
- 7 days/yr
- Hot days in 30 yrs
- 20 days/yr
Wind risk 2/10 · Minimal
- Chance of severe wind over 30 yrs
- 4.0%
Air-quality risk 2/10 · Minimal
- Unhealthy air days now
- 1 days/yr
- Unhealthy air days in 30 yrs
- 1 days/yr
Risk factors via First Street. Map © Google.
Why this score? — see what drove the D+ grade
The composite is a weighted blend of 9 inputs, each scored 0–100. Each bar is that input's sub-score; the figure is the points it added to the 100-point composite (weight × sub-score).
- Cash flow +13.0/30.0
- ARV discount +13.0/15.0
- Appreciation +5.0/10.0
- DSCR +3.9/10.0
- Livability +3.1/5.0
- 1% rule +2.7/10.0
- Rent growth +2.5/5.0
- Condition / age +2.5/5.0
- Schools +1.6/10.0
$105,000
🖨 Deal sheet (PDF) 📄 Offer letter ✓ Due diligence
Listing remarks
Great location on the East side of Spiro. Only a short commute to and from Fort Smith. New carpet and wood laminate flooring. New paint throughout. Move in ready. Three bedrooms with 1 1/2 bathrooms. Metal roof. New cook stove in kitchen. To be sold "AS IS"
Key facts
- 0.25 acre lot
- Built 1979
- Listed 46 days
Property features AI
Exterior
- Parking: Attached carport; 1 covered parking space; Concrete parking surface
- Security: Smoke detector(s)
- Utilities: Public water; Septic tank; Electricity available; Natural gas available; Cable available
- Home design: Single-family house; One story
- Construction: Brick and masonite construction; Metal roof; Slab foundation
- Exterior features: Covered porch; Covered patio; Partial backyard fencing; Cleared lot; Paved public road access
Interior
- Kitchen: Oven
- Flooring: Carpet; Laminate; Wood
- Bathrooms: 1 full bathroom; 1 half bathroom
- Heating & cooling: Central heating (natural gas); Central electric air conditioning
- Interior features: Eat-in kitchen; Blinds; Smoke detector(s)
- Laundry & utility: Washer hookup; Electric dryer hookup; Gas water heater
Neighborhood map
What this means for you Summary
Snapshot
- This is a 3-bed/2.0-bath single-family listed at $105k.
Deal economics
- At list price, monthly cash flow is $-6 ($-73/yr) — negative.
- To cash-flow at today's rent, offer at most $104k (1.0% below list).
- To meet the 1% rule (rent ≥ 1% of price), the offer needs to be $81k (23.2% below list).
- Recommended offer: $81k (23.2% below list) — sets the bar for 1% rule.
Location & tenants
- Location reads 61/100 on livability (#275 in OK) — a middle-class / working-renter tenant base. Strengths: cost of living A+, housing A+, crime B+; Watch: amenities F, commute F, employment F.
- Spiro (rural): math 18% / reading 21% proficiency, ranked #178 of 270 in OK (top 66%) — low school quality limits family demand, transient renter base, plan for 1-2y turnover; 62% free/reduced lunch — lower-income household profile, screen leases tightly.
- Zoned schools: Spiro Es (math 22% / reading 22%, grade F, #413 of 845 statewide, top 54%, 571 students, 0% FRL); Spiro Ms (math 16% / reading 18%, grade F, #193 of 345 statewide, top 60%, 202 students, 0% FRL); Spiro Hs (math 17% / reading 34%, grade F, #141 of 447 statewide, top 31%, 290 students, 0% FRL) — zoned schools average 0% FRL vs 62% district-wide (62 pts lower); this property's tenant base skews higher-income than the district average.
- Market conditions: 66 active listings in the ZIP; 4 comparable units currently listed for rent nearby; rentals at typical pace (median 15d on market — plan ~3-4 weeks tenant-placement turnaround); 73 units permitted in Le Flore County in 2024 (0 in 5+ unit buildings).
Forward outlook
- In year one you build about $4k of equity ($726 loan paydown + $3k appreciation (3.0% local appreciation)).
- Le Flore County population projected at -13% by 2050 — secular population decline; favor cash flow + early exit over multi-decade hold.
- At projected returns (3.0% appreciation + 3.0% rent growth), your $29k cash investment doubles in ~7 years — after that, you're playing with house money.
- By year 9, paydown + projected appreciation supports a ~$33k cash-out refi (75% LTV) — recoverable capital for the next deal without selling this one.
Negotiation context
- It's been on market 46 days — a 3% lower offer ($102k) is reasonable based on typical stale-listing flexibility.
- 2 sale attempts; this cycle's ask has dropped $10k (9%) from the opening price — seller is motivated, your offer sets the floor, not the list.
- Current owner paid $54k; list at $105k implies a 94% gain — meaningful room to come down on a strong offer.
Risks & watch-outs
- Climate carrying-cost: major wildfire risk; extreme-heat days projected 7→20/yr by 2055 (HVAC capex compounding) — expect insurance premiums to compound above CPI over the hold.
Questions for the listing agent
- What do current leases actually rent for vs. the listed asking? Can we see a recent rent roll and the last 12 months of T-12 income?
- It's been on market 46 days. Have you received any prior offers? Is the seller open to a 23% concession, seller financing, or rate buy-down credit?
- Built in 1979 — when were the roof, HVAC, electrical panel, plumbing, and water heater last replaced?
- Is there a deadline driving the sale (1031 exchange, divorce, estate, relocation)? That informs how much negotiation room exists.
- Schools are F-rated, which usually means shorter tenancies and higher turnover. Who's the typical renter profile here, and what's been the actual vacancy rate?
- The area grade is low — what's the realistic commute time and amenity access for the typical tenant pool here? Any planned neighborhood developments (good or bad) we should know about?
- What's the average days-on-market for RENTAL listings here right now (not sales)? A rising rental-DOM trend means longer vacancies and softer asking-rent achievability than the comps imply.
- What's the recent tenant-quality profile in this submarket — average credit score on applications, eviction rate, late-payment / NSF rate, and stable-employment percentage? A property-management company in the area should have these aggregated.
- How much new for-sale + rental construction is in the pipeline within 1–3 miles? Heavy new supply typically softens prices + rents 12–24 months out; constrained supply supports both.
Investment metrics
- 1% rule
- 0.77% ✗
- Cap rate
- 6.22%
- Cash-on-cash
- -0.25%
- DSCR
- 0.99
- GRM
- 10.9
CMA / ARV
- ARV (on-the-fly)
- $119,570
- Comps found
- 2
Show comp detail 2 sales within ~0.75 mi
| Address | Dist | Beds/Ba | Sqft | Sold | Price | $/sf | Match |
|---|---|---|---|---|---|---|---|
| 108 D St | 0.12mi | 3/2.0 | 1,087 (0%) | 10mo | $108,000 | $99 | 86 |
| 19102 Daisy | 0.53mi | 3/2.0 | 1,092 (+0%) | 10mo | $119,900 | $110 | 66 |
Match score weights: distance 35% · size 25% · config 20% · recency 20%. Top-matched comps best support the ARV.
Projected returns pro-forma
3.0% appreciation · 3.0% rent growth · sell at horizon
- IRR
- 7.2%
- Equity multiple
- 1.42×
- Total profit
- $12,221
- Equity at exit
- $47,213
- IRR
- 10.0%
- Equity multiple
- 2.50×
- Total profit
- $44,013
- Equity at exit
- $72,760
Cash invested: $29,400 (down + closing). Projections, not guarantees.
Landlord ↔ Tenant lean methodology
- Overall (STATE)
- 83 Strongly Landlord-Friendly
- State Oklahoma
- 83 Strongly Landlord-Friendly · R+20
- County
- — inherits STATE
- City
- — inherits STATE
ZIP-level market 74959
- Active inventory
- 66
- Price-to-rent
- 10.9×
Monthly cashflow live
- Estimated rent
- $806 medium interval (Pro) →
- Mortgage (P&I)
- −$551
- Tax from tax record
- −$48 /mo · $581/yr
- Insurance
- −$44
- HOA
- −$0
- Vacancy / Maint / Mgmt
- −$169
- Net cashflow
- $-6
Break-even live
Sensitivity live
| Price | -10% $53 | -5% $24 | +0% $-6 | +5% $-36 | +10% $-66 |
|---|---|---|---|---|---|
| Rent | -10% $-70 | -5% $-38 | +0% $-6 | +5% $26 | +10% $58 |
| Rate | -1.0pp $47 | -0.5pp $21 | base $-6 | +0.5pp $-33 | +1.0pp $-61 |
UW: 25.0% down · 7.5% · 30yr · 1.5% tax · 5.0% vac · 8.0% maint · 8.0% mgmt
Financing live
Cash to close
- Down payment
- $26,250
- Closing costs
- $3,150
- Reserves months
- —
- Total cash needed
- —
Loan-product check · same deal, 3 products live
Conventional
25% down · 7.5% · 30yr
- Down + closing
- —
- Monthly P&I
- —
- Monthly cashflow
- —
- DSCR
- —
- Eligible?
- —
Personal DTI + credit; lowest rate.
DSCR
20% down · 8.5% · 30yr
- Down + closing
- —
- Monthly P&I
- —
- Monthly cashflow
- —
- DSCR
- —
- Eligible?
- —
No personal income docs; deal must DSCR.
Hard money
10% down · 12.0% · 12mo
- Down + closing
- —
- Monthly P&I
- —
- Monthly cashflow
- —
- DSCR
- —
- Eligible?
- —
Short-term bridge; refi at stabilization.
Rent comps 4 comps
| Address | Beds | Baths | Sqft | Rent | $/sqft | DOM | Units | Dist |
|---|---|---|---|---|---|---|---|---|
| 200 Wortham Dr Spiro, OK | 3.0 | 1.0 | 1000 | $750 | $0.75 | 15d | 1 | 0.88mi |
| 214 Wortham Dr Spiro, OK | 2.0 | 1.0 | 700 | $675 | $0.96 | 15d | 1 | 0.88mi |
| 201 S Ash St Spiro, OK | 2.0 | 1.0 | 700 | $750 | $1.07 | 15d | 1 | 1.15mi |
| 118 NE 3rd St Spiro, OK | 2.0 | 1.0 | 1469 | $1,100 | $0.75 | 15d | 1 | 1.17mi |
Listing history 24 events
-
2026-06-21days on market $105,000 Active 46 DOM
-
2026-06-19days on market $105,000 Active 44 DOM
-
2026-06-18days on market $105,000 Active 43 DOM
-
2026-06-17days on market $105,000 Active 42 DOM
-
2026-06-17price $105,000 Active 41 DOM
-
2026-06-16days on market $110,000 Active 41 DOM
-
2026-06-15days on market $110,000 Active 40 DOM
-
2026-06-14days on market $110,000 Active 38 DOM
-
2026-06-13days on market $110,000 Active 37 DOM
-
2026-06-10days on market $110,000 Active 35 DOM
-
2026-06-09days on market $110,000 Active 34 DOM
-
2026-06-08days on market $110,000 Active 33 DOM
-
2026-06-07days on market $110,000 Active 32 DOM
-
2026-06-05days on market $110,000 Active 29 DOM
-
2026-06-02days on market $110,000 Active 27 DOM
-
2026-06-01days on market $110,000 Active 26 DOM
-
2026-05-31days on market $110,000 Active 25 DOM
-
2026-05-30days on market $110,000 Active 24 DOM
-
2026-05-20status Active
-
2026-05-20price $110,000
-
2026-05-09status Pending
-
2026-04-22$115,000 Active
-
2021-07-22soldstatus $54,000
-
2017-06-28soldstatus $55,000
ⓘ Source: listings_history table (triggers on properties + properties_extension) + one-shot
backfill from property_details.listing_events for pre-trigger history.
Tax reassessment forecast OK · Resets to sale price
- Current annual tax
- $581 · $48/mo
- Projected year-2 tax
- $945 · $79/mo
- Expected delta
- +$364/yr (+$30/mo · 62.7%)
ⓘ Screening estimate from a state-policy table — verify with the county assessor before closing.
Climate risk First Street
- Flood 1/10 Low FEMA zone X (unshaded) · 0% chance over 30 yrs
- Wildfire 6/10 Major
- Heat 6/10 Major 7 d/yr ≥112°F today · 20 d/yr by 30 yrs out
- Wind 2/10 Low 4% chance of damaging wind over 30 yrs
- Air quality 2/10 Low 1 unhealthy d/yr today · 1 by 30 yrs out
Nearby sold comps map
Loading sold comps map…
Walkable amenities ~0.75 mi
Loading nearby amenities…
Taxation est. · year 1
- Rental income
- $9,671
- − Mortgage interest
- −$5,882
- − Property taxes
- −$581
- − Insurance
- −$525
- − Repairs & maintenance
- −$774
- − Management
- −$774
- − Depreciation
- −$3,055
- Taxable loss
- −$1,918
- Est. tax savings @ 24.0%
- +$460
- After-tax cash flow
- $387/yr
For passive investors: Depreciation is non-cash, so a rental often shows a tax loss while cash-flowing — sheltering income. Rental losses are passive: they offset passive income freely, and up to $25,000/yr can offset ordinary (W-2) income if you actively participate and your MAGI is under $100k (phasing out to $0 by $150k); unused losses carry forward. On sale, claimed depreciation is recaptured at up to 25%, and gains may owe capital-gains tax (a 1031 exchange can defer both). Figures are a year-1 estimate at your 24.0% rate — not tax advice; consult a CPA.
Schools (NCES district)
- District
- Spiro
- NCES district ID
- 4028200
- Math proficiency
- 18% ▼ -12.00%
- Reading proficiency
- 21% ▼ -12.00%
- Median HH income
- $38,031
- Composite
- 16.35/100
- National rank
- #9204
- State rank
- #178 of 270 in OK
Livability — Spiro
- Score
- 61/100
- State rank
- #275
- US rank
- #17347
Category grades
Schools grade is shown separately in the Schools card above.
Census & demographics
- Census place
- Spiro, OK
- Population (ZIP)
- 6,156
Population outlook (Le Flore County) Hauer SSP2
- Today (2025)
- 48,504 people
- By 2030
- 47,474 · -2.1%
- By 2040
- 44,914 · -7.4%
- By 2050
- 42,239 · -12.9%
- By 2075
- 35,071 · -27.7%
- By 2100
- 25,949 · -46.5%
Race, ethnicity, and origin ACS 2023
- Neighborhood character
- Predominantly White (72%)
- Race & ethnicity
- White 72% Native American 12% Two or more races 9% Black 4% Hispanic / Latino 4%
- Common ancestry
- Slovak 2% Italian 1%
- Foreign-born
- 1% · Canada
- Languages at home
- 98% English-only · Spanish 1% Vietnamese 1%
Political lean MEDSL · Le Flore
- 2024 margin
- Solid R (+64.8) · D 17.0% · R 81.8% · Other 1.3%
- 2008→2024 swing
- -26.1pp toward R · 2008: -38.6pp · 2024: -64.8pp
- All cycles
- 2024: R+64.8 2020: R+63.4 2016: R+58.7 2012: R+41.1 2008: R+38.6
Not yet ingested
- Civics
- —
Market trends
- HPI YoY
- —
- Current HPI
- —
- Rent YoY
- —
- Metro
- —
- State GDP YoY
- ▲ 1.55%
- F500 in state
- 6
Industry mix (Fortune 500 HQ in OK)
| Industry | F500 HQs | Revenue |
|---|---|---|
| Energy | 3 | $48B |
|
||
Price history
+100.0% since first listed6 events — show timeline
- 2026-05-20 Relisted — WRVBOR
- 2026-05-20 Price Changed $110,000 WRVBOR
- 2026-05-09 Pending — WRVBOR
- 2026-04-22 Listed $115,000 WRVBOR
- 2021-07-22 Sold (Public Records) $54,000 Public Records
- 2017-06-28 Sold (Public Records) $55,000 Public Records
Property tax history
+5.1%/yrLatest (2025): $581 · +4.1% YoY. Source: county tax records.
Cash-flow waterfall
monthlySold comps — $/sqft
last 12 mo · ≤1 miLoading sold comps…