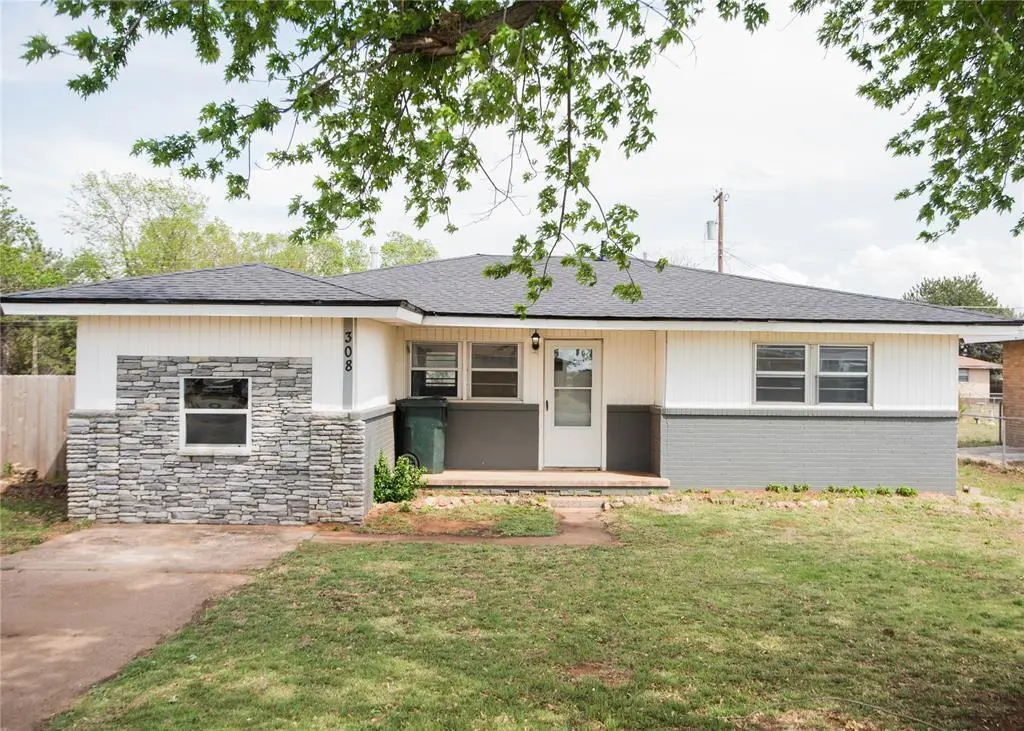
308 S Western Ave · Dill City, OK
Flood risk 1/10 · Minimal
- FEMA flood zone
- X (unshaded)
- Chance of flooding over 30 yrs
- 0.0%
- Est. flood insurance / yr
- $507 – $1,088
Fire risk 1/10 · Minimal
- Est. fire insurance / yr
- $2,463 – $4,575
Heat risk 6/10 · Moderate
- Hot days now (above 105°F)
- 7 days/yr
- Hot days in 30 yrs
- 20 days/yr
Wind risk 2/10 · Minimal
- Chance of severe wind over 30 yrs
- 3.0%
Air-quality risk 1/10 · Minimal
- Unhealthy air days now
- 0 days/yr
- Unhealthy air days in 30 yrs
- 0 days/yr
Risk factors via First Street. Map © Google.
Why this score? — see what drove the B grade
The composite is a weighted blend of 9 inputs, each scored 0–100. Each bar is that input's sub-score; the figure is the points it added to the 100-point composite (weight × sub-score).
- Cash flow +30.0/30.0
- DSCR +10.0/10.0
- Appreciation +10.0/10.0
- ARV discount +7.5/15.0
- 1% rule +7.4/10.0
- Livability +2.7/5.0
- Rent growth +2.5/5.0
- Condition / age +2.5/5.0
- Schools +1.6/10.0
$96,999
🖨 Deal sheet 📄 Offer letter ✓ Due diligence
Listing remarks
4 bedroom 2 bath recently remodeled home with a newer roof. Large backyard is fenced. Spacious master suite, beautiful refinished hardwood floors and a cozy kitchen. Utility room right off of kitchen, with separate access to the side yard. Don't miss this opportunity on a great home.
Key facts
- Cozy kitchen
- Utility room
- Newer roof
Tags
Property features AI
Finance
- Other: Homestead claimed; Lot size approximately 0.1928 acres; Legal addition: Hoefar
- Financial info: Financing options: Cash, Conventional, FHA/VA eligible, VA; Loan qualification possible
- HOA & community: No mandatory association dues
Exterior
- Parking: Gravel parking
- Utilities: Electricity available; Natural gas available; Public utilities
- Home design: Single family residence; One level; Residential property; Existing property
- Construction: Brick and frame construction; Composition roof (roof updated 2023); Slab foundation
- Exterior features: Covered porch; Porch; Wood fencing; Rural lot setting
Interior
- Kitchen: Gas range/oven
- Bedrooms: 4 bedrooms
- Flooring: Laminate; Tile; Wood
- Bathrooms: 2 full bathrooms
- Interior features: Water heater; No fireplace
- Laundry & utility: Washer/dryer connections not listed
Neighborhood map
What this means for you Summary
Snapshot
- This is a 4-bed/1.0-bath single-family listed at $97k.
Deal economics
- At list price, monthly cash flow is $371 ($4k/yr) — positive.
- The deal already cash-flows at list — no discount required.
- Meets the 1% rule at list price ($1k rent vs $97k).
- Recommended offer: $91k (6.0% below list) — sets the bar for market timing.
Location & tenants
- Location reads 54/100 on livability (#581 in OK) — a working-class tenant base; expect higher turnover. Strengths: cost of living A+, housing A+; Watch: crime F, amenities F, commute F.
- Burns Flat-Dill City (rural): math 15% / reading 22% proficiency, ranked #183 of 270 in OK (top 68%) — low school quality limits family demand, transient renter base, plan for 1-2y turnover; 65% free/reduced lunch — lower-income household profile, screen leases tightly.
- Zoned schools: Will Rogers Es (math 13% / reading 19%, grade F, #582 of 845 statewide, top 69%, 366 students, 0% FRL); Burns Flat-Dill City Hs (math 24% / reading 44%, grade F, #48 of 447 statewide, top 14%, 127 students, 0% FRL) — zoned schools average 0% FRL vs 65% district-wide (65 pts lower); this property's tenant base skews higher-income than the district average.
- Market conditions: 2 active listings in the ZIP; 1 units permitted in Washita County in 2024 (0 in 5+ unit buildings).
Forward outlook
- In year one you build about $10k of equity ($670 loan paydown + $10k appreciation (10.0% local appreciation)).
- Washita County population projected at +5% by 2050 — modest demand growth; plan on rents tracking national, not racing it.
- At projected returns (10.0% appreciation + 3.0% rent growth), your $27k cash investment doubles in ~2 years — after that, you're playing with house money.
- By year 4, paydown + projected appreciation supports a ~$37k cash-out refi (75% LTV) — recoverable capital for the next deal without selling this one.
Negotiation context
- It's been on market 72 days — a 6% lower offer ($91k) is reasonable based on typical stale-listing flexibility.
- 15 sale attempts since 4y ago with the ask held roughly flat each time — persistent listings suggest the price (not the market) is what's stuck; bring a comps-based counter.
Risks & watch-outs
- Watch-outs: built in 1959 — expect roof / HVAC / electrical / plumbing capex.
- Climate carrying-cost: extreme-heat days projected 7→20/yr by 2055 (HVAC capex compounding) — expect insurance premiums to compound above CPI over the hold.
Questions for the listing agent
- It's been on market 72 days. Have you received any prior offers? Is the seller open to a 6% concession, seller financing, or rate buy-down credit?
- Built in 1959 — when were the roof, HVAC, electrical panel, plumbing, and water heater last replaced?
- Why hasn't it sold? Are there any deal-killer items the seller is aware of (foundation, flood, title, zoning, code violations)?
- Is there a deadline driving the sale (1031 exchange, divorce, estate, relocation)? That informs how much negotiation room exists.
- Schools are F-rated, which usually means shorter tenancies and higher turnover. Who's the typical renter profile here, and what's been the actual vacancy rate?
- Crime grade is F in this area — have there been break-ins, vandalism, or insurance claims at this property in the last 3 years? What carrier currently insures it and at what premium?
- What's the average days-on-market for RENTAL listings here right now (not sales)? A rising rental-DOM trend means longer vacancies and softer asking-rent achievability than the comps imply.
- What's the recent tenant-quality profile in this submarket — average credit score on applications, eviction rate, late-payment / NSF rate, and stable-employment percentage? A property-management company in the area should have these aggregated.
- How much new for-sale + rental construction is in the pipeline within 1–3 miles? Heavy new supply typically softens prices + rents 12–24 months out; constrained supply supports both.
Investment metrics
- 1% rule
- 1.24% ✓
- Cap rate
- 10.88%
- Cash-on-cash
- 16.39%
- DSCR
- 1.73
- GRM
- 6.7
CMA / ARV
No comps found within radius.
Projected returns pro-forma
10.0% appreciation · 3.0% rent growth · sell at horizon
- IRR
- 36.4%
- Equity multiple
- 3.81×
- Total profit
- $76,421
- Equity at exit
- $87,384
- IRR
- 31.3%
- Equity multiple
- 8.60×
- Total profit
- $206,384
- Equity at exit
- $188,448
Cash invested: $27,160 (down + closing). Projections, not guarantees.
Landlord ↔ Tenant lean methodology
- Overall (STATE)
- 83 Strongly Landlord-Friendly
- State Oklahoma
- 83 Strongly Landlord-Friendly · R+20
- County
- — inherits STATE
- City
- — inherits STATE
ZIP-level market 73641
- Home prices YoY
- 6.4%
- Active inventory
- 2
- Price-to-rent
- 6.7×
Monthly cashflow live
- Estimated rent
- $1,199 medium interval (Pro) →
- Mortgage (P&I)
- −$509
- Tax from tax record
- −$27 /mo · $324/yr
- Insurance
- −$40
- HOA
- −$0
- Vacancy / Maint / Mgmt
- −$252
- Net cashflow
- $371
Break-even live
UW: 25.0% down · 7.5% · 30yr · 1.5% tax · 5.0% vac · 8.0% maint · 8.0% mgmt
Financing live
Cash to close
- Down payment
- $24,250
- Closing costs
- $2,910
- Reserves months
- —
- Total cash needed
- —
Loan-product check · same deal, 3 products live
Conventional
25% down · 7.5% · 30yr
- Down + closing
- —
- Monthly P&I
- —
- Monthly cashflow
- —
- DSCR
- —
- Eligible?
- —
Personal DTI + credit; lowest rate.
DSCR
20% down · 8.5% · 30yr
- Down + closing
- —
- Monthly P&I
- —
- Monthly cashflow
- —
- DSCR
- —
- Eligible?
- —
No personal income docs; deal must DSCR.
Hard money
10% down · 12.0% · 12mo
- Down + closing
- —
- Monthly P&I
- —
- Monthly cashflow
- —
- DSCR
- —
- Eligible?
- —
Short-term bridge; refi at stabilization.
Listing history 42 events
-
2026-06-18days on market $96,999 Active 72 DOM
-
2026-06-17days on market $96,999 Active 71 DOM
-
2026-06-16days on market $96,999 Active 70 DOM
-
2026-06-15days on market $96,999 Active 69 DOM
-
2026-06-13days on market $96,999 Active 67 DOM
-
2026-06-12days on market $96,999 Active 66 DOM
-
2026-06-09days on market $96,999 Active 63 DOM
-
2026-06-08days on market $96,999 Active 62 DOM
-
2026-06-08days on market $96,999 Active 61 DOM
-
2026-06-05days on market $96,999 Active 59 DOM
-
2026-06-04days on market $96,999 Active 57 DOM
-
2026-06-02days on market $96,999 Active 56 DOM
-
2026-06-01days on market $96,999 Active 55 DOM
-
2026-05-31days on market $96,999 Active 54 DOM
-
2026-03-31$96,999 Active
-
2025-10-23status Active
-
2025-10-23historical
-
2025-10-02status Active
-
2025-09-23status Active
-
2025-05-12$105,000 Active
-
2024-04-28historical $800
-
2024-03-14$800
-
2024-03-08historical
-
2024-03-08status Active
-
2024-03-07historical $800
-
2024-03-07historical
-
2024-02-01historical
-
2024-02-01$79,888 Active
-
2024-01-30status Active
-
2024-01-29historical
-
2024-01-04$800
-
2023-12-06status Active
-
2023-11-27status Pending
-
2023-10-18status Active
-
2023-09-12status Pending
-
2023-07-26price $79,888
-
2023-03-10status Active
-
2023-02-09historical
-
2023-02-09status Active
-
2023-01-10historical
-
2022-09-07price $84,900
-
2022-07-12$89,900 Active
ⓘ Source: listings_history table (triggers on properties + properties_extension) + one-shot
backfill from property_details.listing_events for pre-trigger history.
Tax reassessment forecast OK · Resets to sale price
- Current annual tax
- $324 · $27/mo
- Projected year-2 tax
- $873 · $73/mo
- Expected delta
- +$549/yr (+$46/mo · 169.4%)
ⓘ Screening estimate from a state-policy table — verify with the county assessor before closing.
Climate risk First Street
- Flood 1/10 Low FEMA zone X (unshaded) · 0% chance over 30 yrs
- Wildfire 1/10 Low
- Heat 6/10 Major 7 d/yr ≥105°F today · 20 d/yr by 30 yrs out
- Wind 2/10 Low 3% chance of damaging wind over 30 yrs
- Air quality 1/10 Low 0 unhealthy d/yr today · 0 by 30 yrs out
Nearby sold comps map
Loading sold comps map…
Walkable amenities ~0.75 mi
Loading nearby amenities…
Taxation est. · year 1
- Rental income
- $14,387
- − Mortgage interest
- −$5,433
- − Property taxes
- −$324
- − Insurance
- −$485
- − Repairs & maintenance
- −$1,151
- − Management
- −$1,151
- − Depreciation
- −$2,822
- Taxable income
- $3,021
- Est. tax owed @ 24.0%
- −$725
- After-tax cash flow
- $3,728/yr
For passive investors: Depreciation is non-cash, so a rental often shows a tax loss while cash-flowing — sheltering income. Rental losses are passive: they offset passive income freely, and up to $25,000/yr can offset ordinary (W-2) income if you actively participate and your MAGI is under $100k (phasing out to $0 by $150k); unused losses carry forward. On sale, claimed depreciation is recaptured at up to 25%, and gains may owe capital-gains tax (a 1031 exchange can defer both). Figures are a year-1 estimate at your 24.0% rate — not tax advice; consult a CPA.
Schools (NCES district)
- District
- Burns Flat-Dill City
- NCES district ID
- 4000014
- Math proficiency
- 15% ▼ -2.00%
- Reading proficiency
- 22% ▲ 4.00%
- Median HH income
- $45,907
- Composite
- 16.25/100
- National rank
- #9221
- State rank
- #183 of 270 in OK
Livability — Dill City
- Score
- 54/100
- State rank
- #581
- US rank
- #23846
Category grades
Schools grade is shown separately in the Schools card above.
Census & demographics
- Census place
- Dill City, OK
- Population (ZIP)
- 487
Population outlook (Washita County) Hauer SSP2
- Today (2025)
- 12,143 people
- By 2030
- 12,276 · +1.1%
- By 2040
- 12,522 · +3.1%
- By 2050
- 12,740 · +4.9%
- By 2075
- 13,198 · +8.7%
- By 2100
- 13,189 · +8.6%
Race, ethnicity, and origin ACS 2023
- Neighborhood character
- Predominantly White (87%)
- Race & ethnicity
- White 87% Hispanic / Latino 8% Two or more races 7% Native American 2%
- Hispanic origin (detail)
- Mexican 5%
- Common ancestry
- Slovak 3% Lithuanian 2% Iranian 2%
- Foreign-born
- 3% · Canada
- Languages at home
- 97% English-only · Spanish 3%
Political lean MEDSL · Washita
- 2024 margin
- Solid R (+74.8) · D 11.8% · R 86.6% · Other 1.5%
- 2008→2024 swing
- -18.9pp toward R · 2008: -55.9pp · 2024: -74.8pp
- All cycles
- 2024: R+74.8 2020: R+73.0 2016: R+70.5 2012: R+61.8 2008: R+55.9
Not yet ingested
- Civics
- —
Market trends
- HPI YoY
- ▲ 11.31%
- Current HPI
- 186.9465
- Rent YoY
- —
- Metro
- —
- State GDP YoY
- ▲ 1.55%
- F500 in state
- 6
Industry mix (Fortune 500 HQ in OK)
| Industry | F500 HQs | Revenue |
|---|---|---|
| Energy | 3 | $48B |
|
||
Price history
+7.9% since first listed28 events — show timeline
- 2026-03-31 Listed $96,999 MLSOK
- 2025-10-23 Relisted — MLSOK
- 2025-10-23 Listing Removed — MLSOK
- 2025-10-02 Relisted — MLSOK
- 2025-09-23 Relisted — MLSOK
- 2025-05-12 Listed $105,000 MLSOK
- 2024-04-28 Rental Removed $800 MLSOK
- 2024-03-14 Listed for Rent $800 MLSOK
- 2024-03-08 Listing Removed — MLSOK
- 2024-03-08 Relisted — MLSOK
- 2024-03-07 Rental Removed $800 MLSOK
- 2024-03-07 Listing Removed — MLSOK
- 2024-02-01 Listing Removed — MLSOK
- 2024-02-01 Listed $79,888 MLSOK
- 2024-01-30 Relisted — MLSOK
- 2024-01-29 Listing Removed — MLSOK
- 2024-01-04 Listed for Rent $800 MLSOK
- 2023-12-06 Relisted — MLSOK
- 2023-11-27 Pending — MLSOK
- 2023-10-18 Relisted — MLSOK
- 2023-09-12 Pending — MLSOK
- 2023-07-26 Price Changed $79,888 MLSOK
- 2023-03-10 Relisted — MLSOK
- 2023-02-09 Listing Removed — MLSOK
- 2023-02-09 Relisted — MLSOK
- 2023-01-10 Listing Removed — MLSOK
- 2022-09-07 Price Changed $84,900 MLSOK
- 2022-07-12 Listed $89,900 MLSOK
Property tax history
+3.0%/yrLatest (2025): $324 · +6.9% YoY. Source: county tax records.
Cash-flow waterfall
monthlySold comps — $/sqft
last 12 mo · ≤1 miLoading sold comps…