3185 Crescent Rd · Wyeville, WI
Flood risk 1/10 · Minimal
- FEMA flood zone
- X (unshaded)
- Chance of flooding over 30 yrs
- 0.0%
- Est. flood insurance / yr
- $473 – $860
Fire risk 3/10 · Minor
- Est. fire insurance / yr
- $636 – $1,182
Heat risk 2/10 · Minimal
- Hot days now (above 96°F)
- 7 days/yr
- Hot days in 30 yrs
- 14 days/yr
Wind risk 2/10 · Minimal
- Chance of severe wind over 30 yrs
- —
Air-quality risk 1/10 · Minimal
- Unhealthy air days now
- 0 days/yr
- Unhealthy air days in 30 yrs
- 0 days/yr
Risk factors via First Street. Map © Google.
Why this score? — see what drove the D- grade
The composite is a weighted blend of 9 inputs, each scored 0–100. Each bar is that input's sub-score; the figure is the points it added to the 100-point composite (weight × sub-score).
- Cash flow +12.8/30.0
- ARV discount +7.5/15.0
- DSCR +3.8/10.0
- Livability +3.2/5.0
- 1% rule +3.0/10.0
- Rent growth +2.5/5.0
- Condition / age +2.5/5.0
- Schools +2.4/10.0
- Appreciation +1.3/10.0
$214,900
🖨 Deal sheet 📄 Offer letter ✓ Due diligence
Listing remarks
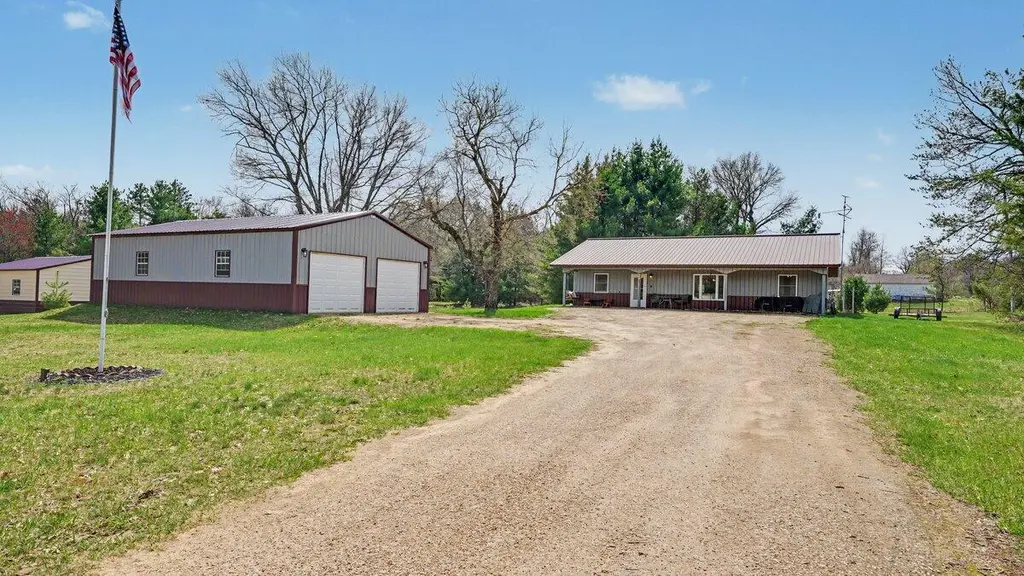
Just north of Tomah, this 1,600 sq ft barndominium offers 4 bedrooms, 1 bath, and sits on approximately 1.5+/- acres in a quiet rural setting. Built for durability, the home features low-maintenance metal siding and a metal roof, making it an excellent option for easy ownership. Interior updates include a renovated bathroom and updated electrical fixtures, while the layout provides practical, flexible living space. Outside, enjoy improved landscaping, a fire pit area, and a newly constructed 2-car detached garage for vehicles or hobbies. The manageable acreage offers room to enjoy the outdoors without heavy upkeep. Located near I-90/94 for convenient access to La Crosse and Madison.
Key facts
- Metal roof
- Renovated bathroom
- Improved landscaping
Tags
Neighborhood map
What this means for you Summary
Snapshot
- This is a 4-bed/1.0-bath other listed at $215k.
Deal economics
- At list price, monthly cash flow is $-18 ($-217/yr) — negative.
- To cash-flow at today's rent, offer at most $212k (1.5% below list).
- To meet the 1% rule (rent ≥ 1% of price), the offer needs to be $171k (20.2% below list).
- Recommended offer: $171k (20.2% below list) — sets the bar for 1% rule.
Location & tenants
- Location reads 65/100 on livability (#524 in WI) — a middle-class / working-renter tenant base. Strengths: cost of living A+, housing A+, employment B; Watch: health & safety D, amenities F, commute F.
- Tomah Area School District (town): math 27% / reading 28% proficiency, ranked #293 of 342 in WI (top 86%) — low school quality limits family demand, transient renter base, plan for 1-2y turnover.
- Zoned schools: Tomah High (math 11% / reading 25%, grade F, #397 of 483 statewide, top 82%, 868 students, 41% FRL).
- Market conditions: 34 active listings in the ZIP; 93 units permitted in Monroe County in 2024 (0 in 5+ unit buildings).
Forward outlook
- Local home prices are declining (-3.0%/yr); year-one equity from $1k of loan paydown is wiped out by about $6k of value loss. Plan a longer hold.
- Monroe County population projected to shrink 9% by 2050 — rents likely to lag national; underwrite the cash flow, not the appreciation.
Negotiation context
- Only 3 days on market — expect competitive offers; lowballing is unlikely to land.
- Current owner paid $138k; list at $215k implies a 56% gain — meaningful room to come down on a strong offer.
Questions for the listing agent
- What do current leases actually rent for vs. the listed asking? Can we see a recent rent roll and the last 12 months of T-12 income?
- Is there a deadline driving the sale (1031 exchange, divorce, estate, relocation)? That informs how much negotiation room exists.
- Schools are F-rated, which usually means shorter tenancies and higher turnover. Who's the typical renter profile here, and what's been the actual vacancy rate?
- The area grade is low — what's the realistic commute time and amenity access for the typical tenant pool here? Any planned neighborhood developments (good or bad) we should know about?
- What's the average days-on-market for RENTAL listings here right now (not sales)? A rising rental-DOM trend means longer vacancies and softer asking-rent achievability than the comps imply.
- What's the recent tenant-quality profile in this submarket — average credit score on applications, eviction rate, late-payment / NSF rate, and stable-employment percentage? A property-management company in the area should have these aggregated.
- How much new for-sale + rental construction is in the pipeline within 1–3 miles? Heavy new supply typically softens prices + rents 12–24 months out; constrained supply supports both.
Investment metrics
- 1% rule
- 0.80% ✗
- Cap rate
- 6.19%
- Cash-on-cash
- -0.36%
- DSCR
- 0.98
- GRM
- 10.4
CMA / ARV
No comps found within radius.
Projected returns pro-forma
-3.0% appreciation · 3.0% rent growth · sell at horizon
- IRR
- -16.9%
- Equity multiple
- 0.40×
- Total profit
- $-36,019
- Equity at exit
- $32,042
- IRR
- -8.8%
- Equity multiple
- 0.45×
- Total profit
- $-33,024
- Equity at exit
- $18,581
Cash invested: $60,172 (down + closing). Projections, not guarantees.
Landlord ↔ Tenant lean methodology
- Overall (STATE)
- 73 Landlord-Friendly
- State Wisconsin
- 73 Landlord-Friendly · R+2
- County
- — inherits STATE
- City
- — inherits STATE
ZIP-level market 54666
- Home prices YoY
- -4.0%
- Active inventory
- 34
- Price-to-rent
- 10.4×
Monthly cashflow live
- Estimated rent
- $1,715 medium interval (Pro) →
- Mortgage (P&I)
- −$1,127
- Tax from tax record
- −$156 /mo · $1,877/yr
- Insurance
- −$90
- HOA
- −$0
- Vacancy / Maint / Mgmt
- −$360
- Net cashflow
- $-18
Break-even live
UW: 25.0% down · 7.5% · 30yr · 1.5% tax · 5.0% vac · 8.0% maint · 8.0% mgmt
Financing live
Cash to close
- Down payment
- $53,725
- Closing costs
- $6,447
- Reserves months
- —
- Total cash needed
- —
Loan-product check · same deal, 3 products live
Conventional
25% down · 7.5% · 30yr
- Down + closing
- —
- Monthly P&I
- —
- Monthly cashflow
- —
- DSCR
- —
- Eligible?
- —
Personal DTI + credit; lowest rate.
DSCR
20% down · 8.5% · 30yr
- Down + closing
- —
- Monthly P&I
- —
- Monthly cashflow
- —
- DSCR
- —
- Eligible?
- —
No personal income docs; deal must DSCR.
Hard money
10% down · 12.0% · 12mo
- Down + closing
- —
- Monthly P&I
- —
- Monthly cashflow
- —
- DSCR
- —
- Eligible?
- —
Short-term bridge; refi at stabilization.
Listing history 3 events
-
2026-04-21status Pending
-
2026-04-18$214,900 Active
-
2020-10-07soldstatus $137,500
ⓘ Source: listings_history table (triggers on properties + properties_extension) + one-shot
backfill from property_details.listing_events for pre-trigger history.
Tax reassessment forecast WI · Partial reset (capped growth)
- Current annual tax
- $1,877 · $156/mo
- Projected year-2 tax
- $2,926 · $244/mo
- Expected delta
- +$1,049/yr (+$87/mo · 55.9%)
ⓘ Screening estimate from a state-policy table — verify with the county assessor before closing.
Climate risk First Street
- Flood 1/10 Low FEMA zone X (unshaded) · 0% chance over 30 yrs
- Wildfire 3/10 Moderate
- Heat 2/10 Low 7 d/yr ≥96°F today · 14 d/yr by 30 yrs out
- Wind 2/10 Low
- Air quality 1/10 Low 0 unhealthy d/yr today · 0 by 30 yrs out
Nearby sold comps map
Loading sold comps map…
Walkable amenities ~0.75 mi
Loading nearby amenities…
Taxation est. · year 1
- Rental income
- $20,580
- − Mortgage interest
- −$12,038
- − Property taxes
- −$1,877
- − Insurance
- −$1,074
- − Repairs & maintenance
- −$1,646
- − Management
- −$1,646
- − Depreciation
- −$6,252
- Taxable loss
- −$3,954
- Est. tax savings @ 24.0%
- +$949
- After-tax cash flow
- $732/yr
For passive investors: Depreciation is non-cash, so a rental often shows a tax loss while cash-flowing — sheltering income. Rental losses are passive: they offset passive income freely, and up to $25,000/yr can offset ordinary (W-2) income if you actively participate and your MAGI is under $100k (phasing out to $0 by $150k); unused losses carry forward. On sale, claimed depreciation is recaptured at up to 25%, and gains may owe capital-gains tax (a 1031 exchange can defer both). Figures are a year-1 estimate at your 24.0% rate — not tax advice; consult a CPA.
Schools (NCES district)
- District
- Tomah Area School District
- NCES district ID
- 5514910
- Math proficiency
- 27% ▼ -4.00%
- Reading proficiency
- 28% ▼ -5.00%
- Median HH income
- $50,063
- Composite
- 24.14/100
- National rank
- #7747
- State rank
- #293 of 342 in WI
Livability — Wyeville
- Score
- 65/100
- State rank
- #524
- US rank
- #13231
Category grades
Schools grade is shown separately in the Schools card above.
Census & demographics
- Population (ZIP)
- 2,623
Population outlook (Monroe County) Hauer SSP2
- Today (2025)
- 45,682 people
- By 2030
- 45,187 · -1.1%
- By 2040
- 43,768 · -4.2%
- By 2050
- 41,596 · -8.9%
- By 2075
- 35,555 · -22.2%
- By 2100
- 28,278 · -38.1%
Race, ethnicity, and origin ACS 2023
- Neighborhood character
- Predominantly White (88%)
- Race & ethnicity
- White 88% Two or more races 6% Hispanic / Latino 4% Native American 2% Black 1%
- Common ancestry
- Portuguese 8% Romanian 5% Lithuanian 2%
- Foreign-born
- 1%
- Languages at home
- 97% English-only · Spanish 2% German/W. Germanic 1%
Political lean MEDSL · Monroe
- 2024 margin
- Strong R (+26.1) · D 36.3% · R 62.5% · Other 1.2%
- 2008→2024 swing
- -34.1pp toward R · 2008: 8.0pp · 2024: -26.1pp
- All cycles
- 2024: R+26.1 2020: R+23.6 2016: R+22.5 2012: R+0.7 2008: D+8.0
Not yet ingested
- Civics
- —
Market trends
- HPI YoY
- ▼ -7.47%
- Current HPI
- 177.84
- Rent YoY
- —
- Metro
- —
- State GDP YoY
- ▲ 2.10%
- F500 in state
- 20
Industry mix (Fortune 500 HQ in WI)
| Industry | F500 HQs | Revenue |
|---|---|---|
| Industrial Machinery | 4 | $23B |
|
||
| Industrial Technology | 2 | $36B |
|
||
| Insurance | 1 | $36B |
|
||
| Professional Services | 1 | $19B |
|
||
| Utilities | 1 | $9B |
|
||
| Consumer Goods | 1 | $3B |
|
||
Price history
+56.3% since first listed3 events — show timeline
- 2026-04-21 Pending — METROMLS
- 2026-04-18 Listed $214,900 METROMLS
- 2020-10-07 Sold (Public Records) $137,500 Public Records
Property tax history
-0.1%/yrLatest (2025): $1,877 · +5.1% YoY. Source: county tax records.
Cash-flow waterfall
monthlySold comps — $/sqft
last 12 mo · ≤1 miLoading sold comps…