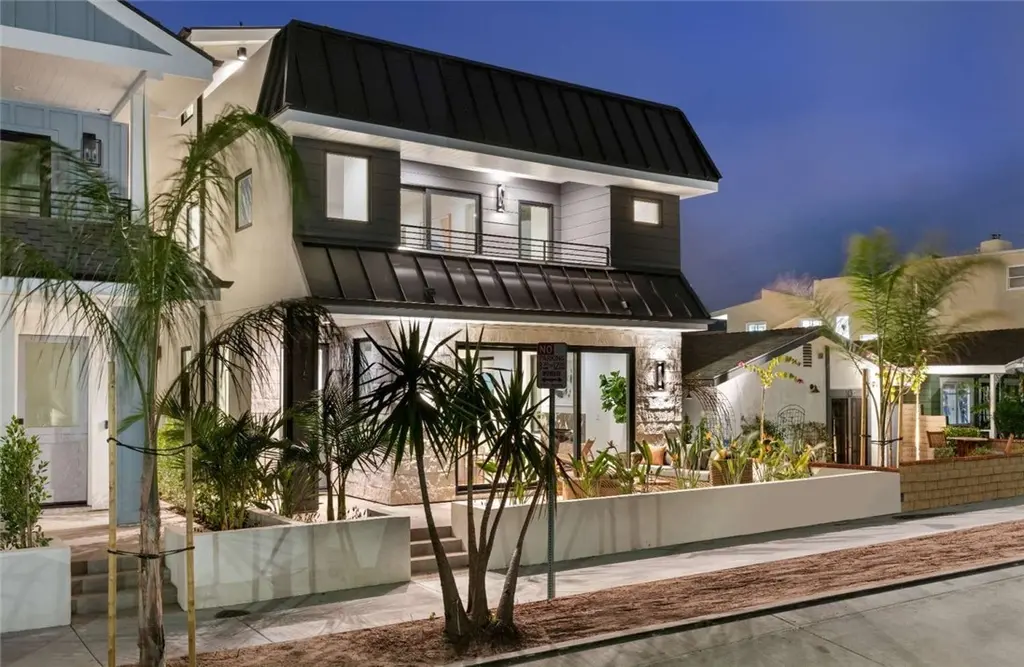
315 E Bay Ave · Newport Beach, CA
Flood risk No data
- FEMA flood zone
- —
- Chance of flooding over 30 yrs
- —
- Est. flood insurance / yr
- —
Fire risk No data
- Est. fire insurance / yr
- —
Heat risk No data
- Hot days now (above threshold)
- —
- Hot days in 30 yrs
- —
Wind risk No data
- Chance of severe wind over 30 yrs
- —
Air-quality risk No data
- Unhealthy air days now
- —
- Unhealthy air days in 30 yrs
- —
Risk factors via First Street. Map © Google.
Why this score? — see what drove the B+ grade
The composite is a weighted blend of 9 inputs, each scored 0–100. Each bar is that input's sub-score; the figure is the points it added to the 100-point composite (weight × sub-score).
- Cash flow +26.5/30.0
- Appreciation +10.0/10.0
- DSCR +9.0/10.0
- ARV discount +7.5/15.0
- 1% rule +7.1/10.0
- Rent growth +5.0/5.0
- Schools +4.8/10.0
- Condition / age +4.8/5.0
- Livability +3.8/5.0
$815,000
🖨 Deal sheet 📄 Offer letter ✓ Due diligence
Listing remarks MLS
EMBER CO-OWNERSHIP PROPERTY. Experience the joy of owning a luxury vacation home without the hassle or full cost! This Ember co-ownership home offers a 1/8th ownership stake, giving you 6.5 weeks per year to create unforgettable memories. This is true property ownership, so you can sell your share whenever you choose. Plus, the home is professionally managed and maintained, offering a * * headache-free way to own a stunning retreat. Why rent when you can own smarter, vacation better, and stress less with Ember? Meet the Apollo: your passport to the beach life in sunny Newport Beach, California. Located on the Balboa Peninsula with world-class beaches and surfing just steps from your front door, the Apollo also offers stunning sunset and ocean views from two rooftop terraces. Designed for bespoke modern living, this newly built seaside home has all the features and amenities needed for entertaining as well as relaxing. Outdoor spaces seamlessly transition inside with the home’s open floor plan and slideaway patio doors. You’ll love the professional-grade kitchen, luxurious ensuite bathrooms, and even a three-level elevator. This home comes with the Ember Peak Season Guarantee, which starts the first Tuesday in June and runs for eight weeks. Each ownership share includes a guaranteed seven-night stay during peak season.
Key facts
- Open floor plan
- Rooftop terraces
- 2,400 sq ft lot
Tags
Neighborhood map
What this means for you Summary
Snapshot
- This is a 4-bed/4.5-bath single-family listed at $815k. Condition is rated excellent.
Deal economics
- At list price, monthly cash flow is $2k ($26k/yr) — positive.
- The deal already cash-flows at list — no discount required.
- Meets the 1% rule at list price ($10k rent vs $815k).
- Recommended offer: $717k (12.0% below list) — sets the bar for market timing.
- Cap rate 9.5% vs local median 0.6% in Newport Beach — top-decile yield for the area; either an underpriced asset or a hidden risk that comps aren't pricing in. Stress-test before assuming the spread holds.
Location & tenants
- Location reads 76/100 on livability (#101 in CA, #3,645 nationally) — a middle-class / working-renter tenant base. Strengths: schools A+, amenities A+, employment A+; Watch: health & safety C-, cost of living F.
- Newport-Mesa Unified (urban): math 46% / reading 58% proficiency, ranked #106 of 517 in CA (top 20%) — acceptable for families but not a draw, mixed tenant base, ~2y average lease.
- Market conditions: Rents rising fast (+13.6%/yr); 52 active listings in the ZIP; 40 comparable units currently listed for rent nearby; rentals lingering (median 44d on market — plan ~5-8 weeks vacancy on turnover, expect pricing pressure); 78% of comp listings sitting > 30 days — soft ceiling on asking rent; high-income renter base; 6,974 units permitted in Orange County in 2024 (3,839 in 5+ unit buildings).
- At $9,849/mo this rent would consume 56% of the median local household income ($209k/yr) (locally 72% of renters already pay >50% of income on rent) — very limited rent-growth headroom before tenants either downsize or default.
Forward outlook
- In year one you build about $87k of equity ($6k loan paydown + $82k appreciation (10.0% local appreciation)).
- Orange County population projected at +14% by 2050 — modest demand growth; plan on rents tracking national, not racing it.
- At projected returns (10.0% appreciation + 8.0% rent growth), your $228k cash investment doubles in ~2 years — after that, you're playing with house money.
- By year 2, paydown + projected appreciation supports a ~$140k cash-out refi (75% LTV) — recoverable capital for the next deal without selling this one.
Negotiation context
- It's been on market 241 days — a 12% lower offer ($717k) is reasonable based on typical stale-listing flexibility.
- 10 sale attempts since 17y ago with the ask held roughly flat each time — persistent listings suggest the price (not the market) is what's stuck; bring a comps-based counter.
- Current owner paid $679k; 20% above their basis — modest negotiation headroom, anchor on the comps not their cost.
Questions for the listing agent
- It's been on market 241 days. Have you received any prior offers? Is the seller open to a 12% concession, seller financing, or rate buy-down credit?
- Why hasn't it sold? Are there any deal-killer items the seller is aware of (foundation, flood, title, zoning, code violations)?
- Is there a deadline driving the sale (1031 exchange, divorce, estate, relocation)? That informs how much negotiation room exists.
- Schools are A-rated — typically a magnet for longer-tenancy family renters. What's the average tenant stay here, and is there a school-zone premium baked into asking?
- What's the average days-on-market for RENTAL listings here right now (not sales)? A rising rental-DOM trend means longer vacancies and softer asking-rent achievability than the comps imply.
- What's the recent tenant-quality profile in this submarket — average credit score on applications, eviction rate, late-payment / NSF rate, and stable-employment percentage? A property-management company in the area should have these aggregated.
- How much new for-sale + rental construction is in the pipeline within 1–3 miles? Heavy new supply typically softens prices + rents 12–24 months out; constrained supply supports both.
Investment metrics
- 1% rule
- 1.21% ✓
- Cap rate
- 9.46%
- Cash-on-cash
- 11.30%
- DSCR
- 1.50
- GRM
- 6.9
CMA / ARV
- ARV (median comp)
- $4,634,125
- List price
- $815,000
- Delta
- -82.41%
- Verdict
- UNDERPRICED
- Comps
- 20 within 1.0 mi
Show comp detail 12 sales within ~0.75 mi
| Address | Dist | Beds/Ba | Sqft | Sold | Price | $/sf | Match |
|---|---|---|---|---|---|---|---|
| 200 E Balboa Blvd | 0.11mi | 4/4.0 | 3,029 (-0%) | 4mo | $4,500,000 | $1,486 | 89 |
| 505 W Edgewater Ave | 0.26mi | 4/4.5 | 3,208 (+6%) | 9mo | $12,750,000 | $3,974 | 71 |
| 930 E Balboa Blvd | 0.35mi | 3/4.5 (-1) | 3,327 (+10%) | 12mo | $12,900,000 | $3,877 | 52 |
| 612 Harbor Island Dr | 0.58mi | 4/4.5 | 3,337 (+10%) | 5mo | $7,600,000 | $2,277 | 52 |
| 112 Ruby Ave | 0.48mi | 4/3.0 | 2,766 (-9%) | 6mo | $4,875,000 | $1,762 | 52 |
| 222 Ruby Ave | 0.51mi | 5/4.0 (+1) | 2,794 (-8%) | 10mo | $4,400,000 | $1,575 | 47 |
| 129 Via Waziers | 0.74mi | 3/3.5 (-1) | 3,008 (-1%) | 12mo | $4,400,000 | $1,463 | 45 |
| 333 Apolena | 0.69mi | 4/5.5 | 3,294 (+8%) | 5mo | $9,400,000 | $2,854 | 45 |
| 114 Via Xanthe | 0.70mi | 3/3.5 (-1) | 3,299 (+9%) | 6mo | $5,800,000 | $1,758 | 39 |
| 1214 E Balboa Blvd | 0.59mi | 4/3.5 | 2,672 (-12%) | 12mo | $7,780,000 | $2,912 | 38 |
| 1305 E Balboa Blvd | 0.64mi | 3/3.5 (-1) | 2,634 (-13%) | 7mo | $6,925,000 | $2,629 | 33 |
| 816 Via Lido Nord | 0.71mi | 3/5.0 (-1) | 3,372 (+11%) | 11mo | $18,100,000 | $5,368 | 32 |
Match score weights: distance 35% · size 25% · config 20% · recency 20%. Top-matched comps best support the ARV.
Projected returns pro-forma
10.0% appreciation · 8.0% rent growth · sell at horizon
- IRR
- 34.9%
- Equity multiple
- 3.77×
- Total profit
- $632,921
- Equity at exit
- $734,217
- IRR
- 31.8%
- Equity multiple
- 9.26×
- Total profit
- $1,885,476
- Equity at exit
- $1,583,366
Cash invested: $228,200 (down + closing). Projections, not guarantees.
Landlord ↔ Tenant lean methodology
- Overall (STATE)
- 18 Strongly Tenant-Friendly
- State California
- 18 Strongly Tenant-Friendly · D+13
- County
- — inherits STATE
- City
- — inherits STATE
ZIP-level market 92661
- Home prices YoY
- 4.5%
- Rents YoY
- 13.6%
- Active inventory
- 52
- Price-to-rent
- 6.9×
Monthly cashflow live
- Estimated rent
- $9,849 medium interval (Pro) →
- Mortgage (P&I)
- −$4,274
- Tax est. 1.5%
- −$1,019 /mo · $12,225/yr
- Insurance
- −$340
- HOA
- −$0
- Vacancy / Maint / Mgmt
- −$2,068
- Net cashflow
- $2,149
Break-even live
UW: 25.0% down · 7.5% · 30yr · 1.5% tax · 5.0% vac · 8.0% maint · 8.0% mgmt
Financing live
Cash to close
- Down payment
- $203,750
- Closing costs
- $24,450
- Reserves months
- —
- Total cash needed
- —
Loan-product check · same deal, 3 products live
Conventional
25% down · 7.5% · 30yr
- Down + closing
- —
- Monthly P&I
- —
- Monthly cashflow
- —
- DSCR
- —
- Eligible?
- —
Personal DTI + credit; lowest rate.
DSCR
20% down · 8.5% · 30yr
- Down + closing
- —
- Monthly P&I
- —
- Monthly cashflow
- —
- DSCR
- —
- Eligible?
- —
No personal income docs; deal must DSCR.
Hard money
10% down · 12.0% · 12mo
- Down + closing
- —
- Monthly P&I
- —
- Monthly cashflow
- —
- DSCR
- —
- Eligible?
- —
Short-term bridge; refi at stabilization.
Rent comps 40 comps
| Address | Beds | Baths | Sqft | Rent | $/sqft | DOM | Units | Dist |
|---|---|---|---|---|---|---|---|---|
| 208 E Balboa Blvd Newport Beach, CA | 3.0 | 3.5 | 2690 | $10,800 | $4.01 | 44d | 1 | 0.07mi |
| 413 E Edgewater Ave Newport Beach, CA | 3.0 | 4.0 | 2576 | $35,000 | $13.59 | 44d | 1 | 0.09mi |
| 305 Montero St Newport Beach, CA | 4.0 | 3.5 | 2444 | $15,000 | $6.14 | 44d | 1 | 0.13mi |
| 130 S Bay Front Newport Beach, CA | 4.0 | 5.5 | 4482 | $65,000 | $14.50 | 44d | 1 | 0.30mi |
| 119 Opal Ave Newport Beach, CA | 3.0 | 2.5 | 2354 | $16,000 | $6.80 | 44d | 1 | 0.34mi |
| 124 Garnet Ave Newport Beach, CA | 4.0 | 2.0 | 2219 | $13,500 | $6.08 | 44d | 1 | 0.34mi |
| 204 Pearl Ave Newport Beach, CA | 3.0 | 3.5 | 2478 | $23,995 | $9.68 | 44d | 1 | 0.38mi |
| 312 Ruby Ave Newport Beach, CA | 4.0 | 2.5 | 2353 | $22,850 | $9.71 | 44d | 1 | 0.54mi |
| 203 Sapphire Ave Newport Beach, CA | 3.0 | 3.5 | 2347 | $27,000 | $11.50 | 44d | 1 | 0.55mi |
| 1214 E Balboa Blvd Newport Beach, CA | 4.0 | 3.5 | 2672 | $22,000 | $8.23 | 44d | 1 | 0.61mi |
| 736 Harbor Island Dr Newport Beach, CA | 5.0 | 4.0 | 3922 | $28,000 | $7.14 | 44d | 1 | 0.62mi |
| 220 Coral Ave Newport Beach, CA | 3.0 | 3.5 | 2394 | $17,000 | $7.10 | 44d | 1 | 0.63mi |
| 1025 W Balboa Blvd Newport Beach, CA | 5.0 | 6.5 | 3866 | $30,000 | $7.76 | 44d | 1 | 0.65mi |
| 780 Via Lido Soud Newport Beach, CA | 5.0 | 3.0 | 3366 | $29,000 | $8.62 | 44d | 1 | 0.68mi |
| 2732 Bayshore Dr Newport Beach, CA | 4.0 | 3.5 | 3115 | $39,000 | $12.52 | 44d | 1 | 0.72mi |
| 1411 E Bay Ave Newport Beach, CA | 4.0 | 4.0 | 2548 | $27,500 | $10.79 | 44d | 1 | 0.75mi |
| 117 Marine Ave Newport Beach, CA | 5.0 | 5.0 | 2279 | $15,000 | $6.58 | 44d | 1 | 0.75mi |
| 125 Grand Canal Newport Beach, CA | 5.0 | 4.0 | 2520 | $30,000 | $11.90 | 44d | 1 | 0.80mi |
| 1509 E Bay Ave Newport Beach, CA | 4.0 | 4.5 | 2582 | $45,000 | $17.43 | 44d | 1 | 0.81mi |
| 1514 E Oceanfront Newport Beach, CA | 4.0 | 5.0 | 4421 | $30,000 | $6.79 | 44d | 1 | 0.82mi |
| 1514 E Oceanfront Newport Beach, CA | 4.0 | 5.0 | 4421 | $30,000 | $6.79 | 24d | 1 | 0.82mi |
| 1229 W Balboa Blvd Newport Beach, CA | 4.0 | 4.5 | 2127 | $7,500 | $3.53 | 44d | 1 | 0.82mi |
| 112 Abalone Ave Newport Beach, CA | 5.0 | 4.0 | 2893 | $12,800 | $4.42 | 44d | 1 | 0.87mi |
| 1554 E Oceanfront Newport Beach, CA | 4.0 | 4.5 | 3649 | $30,000 | $8.22 | 17d | 1 | 0.89mi |
| 2461 Marino Dr Newport Beach, CA | 4.0 | 4.0 | 3859 | $24,995 | $6.48 | 44d | 1 | 0.91mi |
| 317 E Bay Front Newport Beach, CA | 3.0 | 3.5 | 2608 | $39,500 | $15.15 | 44d | 1 | 0.92mi |
| 1576 E Ocean Blvd Newport Beach, CA | 4.0 | 3.0 | 2321 | $16,500 | $7.11 | 44d | 1 | 0.92mi |
| 225 E Bay Front Newport Beach, CA | 4.0 | 4.5 | 2512 | $40,900 | $16.28 | 44d | 1 | 0.94mi |
| 503 L St Newport Beach, CA | 4.0 | 4.5 | 3148 | $19,500 | $6.19 | 44d | 1 | 1.02mi |
| 600 Cliff Dr Newport Beach, CA | 5.0 | 4.5 | 3642 | $15,000 | $4.12 | 44d | 1 | 1.06mi |
| 2025 E Balboa Blvd Newport Beach, CA | 4.0 | 4.0 | 3000 | $14,000 | $4.67 | 44d | 1 | 1.09mi |
| 2037 E Ocean Blvd Newport Beach, CA | 4.0 | 4.0 | 2943 | $30,000 | $10.19 | 44d | 1 | 1.14mi |
| 235 Via Ithaca Newport Beach, CA | 4.0 | 4.5 | 4315 | $25,000 | $5.79 | 24d | 1 | 1.15mi |
| 2105 E Balboa Blvd Newport Beach, CA | 4.0 | 4.5 | 2985 | $28,500 | $9.55 | 3d | 1 | 1.16mi |
| 2105 E Balboa Blvd Newport Beach, CA | 4.0 | 4.5 | 2985 | $28,500 | $9.55 | 44d | 1 | 1.16mi |
| 234 Via Graziana Newport Beach, CA | 4.0 | 3.5 | 2853 | $25,000 | $8.76 | 15d | 1 | 1.17mi |
| 730 Saint James Pl Newport Beach, CA | 3.0 | 3.5 | 2576 | $9,500 | $3.69 | 3d | 1 | 1.19mi |
| 2137 Channel Rd Newport Beach, CA | 4.0 | 2.5 | 2632 | $13,750 | $5.22 | 24d | 1 | 1.21mi |
| 2137 Channel Rd Newport Beach, CA | 4.0 | 2.5 | 2598 | $14,000 | $5.39 | 3d | 1 | 1.21mi |
| 1511 Cliff Dr Newport Beach, CA | 5.0 | 5.0 | 3431 | $16,500 | $4.81 | 15d | 1 | 1.21mi |
Listing history 35 events
-
2026-06-18days on market $815,000 Active 241 DOM
-
2026-06-17days on market $815,000 Active 240 DOM
-
2026-06-16days on market $815,000 Active 239 DOM
-
2026-06-15days on market $815,000 Active 238 DOM
-
2026-06-13days on market $815,000 Active 236 DOM
-
2026-06-13days on market $815,000 Active 235 DOM
-
2026-06-09days on market $815,000 Active 232 DOM
-
2026-06-08days on market $815,000 Active 231 DOM
-
2026-06-07days on market $815,000 Active 230 DOM
-
2026-06-04days on market $815,000 Active 227 DOM
-
2026-06-03days on market $815,000 Active 226 DOM
-
2026-06-02days on market $815,000 Active 225 DOM
-
2026-06-01days on market $815,000 Active 224 DOM
-
2026-05-31days on market $815,000 Active 223 DOM
-
2026-04-06status Active 1356-char remark
Show marketing remark (1356 chars)
EMBER CO-OWNERSHIP PROPERTY. Experience the joy of owning a luxury vacation home without the hassle or full cost! This Ember co-ownership home offers a 1/8th ownership stake, giving you 6.5 weeks per year to create unforgettable memories. This is true property ownership, so you can sell your share whenever you choose. Plus, the home is professionally managed and maintained, offering a * * headache-free way to own a stunning retreat. Why rent when you can own smarter, vacation better, and stress less with Ember? Meet the Apollo: your passport to the beach life in sunny Newport Beach, California. Located on the Balboa Peninsula with world-class beaches and surfing just steps from your front door, the Apollo also offers stunning sunset and ocean views from two rooftop terraces. Designed for bespoke modern living, this newly built seaside home has all the features and amenities needed for entertaining as well as relaxing. Outdoor spaces seamlessly transition inside with the home’s open floor plan and slideaway patio doors. You’ll love the professional-grade kitchen, luxurious ensuite bathrooms, and even a three-level elevator. This home comes with the Ember Peak Season Guarantee, which starts the first Tuesday in June and runs for eight weeks. Each ownership share includes a guaranteed seven-night stay during peak season.
-
2025-09-18$815,000 Active 1356-char remark
Show marketing remark (1356 chars)
EMBER CO-OWNERSHIP PROPERTY. Experience the joy of owning a luxury vacation home without the hassle or full cost! This Ember co-ownership home offers a 1/8th ownership stake, giving you 6.5 weeks per year to create unforgettable memories. This is true property ownership, so you can sell your share whenever you choose. Plus, the home is professionally managed and maintained, offering a * * headache-free way to own a stunning retreat. Why rent when you can own smarter, vacation better, and stress less with Ember? Meet the Apollo: your passport to the beach life in sunny Newport Beach, California. Located on the Balboa Peninsula with world-class beaches and surfing just steps from your front door, the Apollo also offers stunning sunset and ocean views from two rooftop terraces. Designed for bespoke modern living, this newly built seaside home has all the features and amenities needed for entertaining as well as relaxing. Outdoor spaces seamlessly transition inside with the home’s open floor plan and slideaway patio doors. You’ll love the professional-grade kitchen, luxurious ensuite bathrooms, and even a three-level elevator. This home comes with the Ember Peak Season Guarantee, which starts the first Tuesday in June and runs for eight weeks. Each ownership share includes a guaranteed seven-night stay during peak season.
-
2025-07-23historical
-
2025-01-23$855,000 Active
-
2023-04-26soldstatus $679,045 Closed Sale
-
2022-11-23status Active
-
2022-09-24status Active
-
2022-05-26historical
-
2022-05-26$679,045 Active
-
2022-05-18soldstatus $4,595,000
-
2022-05-03soldstatus $4,495,000 Closed Sale
-
2022-05-03$679,045 Active
-
2022-05-02status Pending Sale
-
2022-05-02soldstatus $4,495,000
-
2022-04-19historical Active Under Contract
-
2022-04-01$4,495,000 Active
-
2009-03-31historical
-
2009-03-26soldstatus $1,460,000 Closed
-
2009-03-24soldstatus $1,460,000
-
2009-01-26status
-
2009-01-06
ⓘ Source: listings_history table (triggers on properties + properties_extension) + one-shot
backfill from property_details.listing_events for pre-trigger history.
Nearby sold comps map
Loading sold comps map…
Walkable amenities ~0.75 mi
Loading nearby amenities…
Taxation est. · year 1
- Rental income
- $118,192
- − Mortgage interest
- −$45,653
- − Property taxes
- −$12,225
- − Insurance
- −$4,075
- − Repairs & maintenance
- −$9,455
- − Management
- −$9,455
- − Depreciation
- −$23,709
- Taxable income
- $13,619
- Est. tax owed @ 24.0%
- −$3,269
- After-tax cash flow
- $22,516/yr
For passive investors: Depreciation is non-cash, so a rental often shows a tax loss while cash-flowing — sheltering income. Rental losses are passive: they offset passive income freely, and up to $25,000/yr can offset ordinary (W-2) income if you actively participate and your MAGI is under $100k (phasing out to $0 by $150k); unused losses carry forward. On sale, claimed depreciation is recaptured at up to 25%, and gains may owe capital-gains tax (a 1031 exchange can defer both). Figures are a year-1 estimate at your 24.0% rate — not tax advice; consult a CPA.
Condition & rehab AI · 13 photos
This property is in excellent condition with a prime location and modern decor. It is move-in ready and would be a great investment for both resale and rental.
Value-add opportunities
- Both Upgrade the outdoor furniture to high-end pieces for a more luxurious look and feel. — Upgrading the outdoor furniture will enhance the curb appeal and make the property more attractive to potential buyers and renters.
- Both Add a smart home system for convenience and energy efficiency. — A smart home system can improve the comfort and energy efficiency of the property, making it more attractive to potential buyers and renters.
Renovation cost estimate screening
Value-add ROI direction
- Both Upgrade the outdoor furniture to high-end pieces for a more luxurious look and feel. — Upgrading the outdoor furniture will enhance the curb appeal and make the property more attractive to potential buyers and renters. ↑
- Both Add a smart home system for convenience and energy efficiency. — A smart home system can improve the comfort and energy efficiency of the property, making it more attractive to potential buyers and renters. ↑
ⓘ Cost ranges are severity-bucket heuristics (US national rule-of-thumb). Get contractor quotes + a written scope before underwriting a rehab budget.
Schools (NCES district)
- District
- Newport-Mesa Unified
- NCES district ID
- 0627240
- Math proficiency
- 46% ▼ -6.00%
- Reading proficiency
- 58% ▼ -5.00%
- Median HH income
- $83,922
- Composite
- 47.64/100
- National rank
- #2248
- State rank
- #106 of 517 in CA
Livability — Newport Beach
- Score
- 76/100
- State rank
- #101
- US rank
- #3645
Category grades
Schools grade is shown separately in the Schools card above.
Census & demographics
- Census place
- Newport Beach, CA
- County
- Orange County · 3,096,323 people
- City population
- 83,845
- Metro
- Los Angeles-Long Beach-Anaheim, CA
- Population (ZIP)
- 3,079
- Household income
- $209,231
- Rent vs Own
- Severe rent burden
- 72.0
Population outlook (Orange County) Hauer SSP2
- Today (2025)
- 3,477,456 people
- By 2030
- 3,613,117 · +3.9%
- By 2040
- 3,835,945 · +10.3%
- By 2050
- 3,968,736 · +14.1%
- By 2075
- 4,097,053 · +17.8%
- By 2100
- 3,903,633 · +12.3%
Race, ethnicity, and origin ACS 2023
- Neighborhood character
- Predominantly White (72%)
- Race & ethnicity
- White 72% Two or more races 22% Hispanic / Latino 10% Asian 2%
- Hispanic origin (detail)
- Mexican 9% Puerto Rican 2%
- Common ancestry
- Italian 8% Danish 5% Slovak 4%
- Foreign-born
- 8% · Canada
- Languages at home
- 88% English-only · Spanish 9% German/W. Germanic 2% Other Asian/Pacific 1%
Political lean MEDSL · Orange
- 2024 margin
- Toss-up / Even · D 49.7% · R 47.1% · Other 3.2%
- 2008→2024 swing
- +5.2pp toward D · 2008: -2.6pp · 2024: 2.6pp
- All cycles
- 2024: D+2.6 2020: D+9.0 2016: D+7.7 2012: R+8.3 2008: R+2.6
Not yet ingested
- Civics
- —
Market trends
- HPI YoY
- ▲ 18.17%
- Current HPI
- 425.2623
- Rent YoY
- ▲ 13.56%
- Metro
- Los Angeles-Long Beach-Anaheim, CA
- State GDP YoY
- ▲ 3.21%
- F500 in state
- 116
Industry mix (Fortune 500 HQ in CA)
| Industry | F500 HQs | Revenue |
|---|---|---|
| Technology | 27 | $1,492B |
|
||
| Financial Services | 3 | $174B |
|
||
| Retail | 3 | $44B |
|
||
| Insurance | 3 | $26B |
|
||
| Media / Entertainment | 2 | $115B |
|
||
| Pharmaceuticals / Biotech | 2 | $62B |
|
||
Price history
-44.2% since first listed21 events — show timeline
- 2026-04-06 Relisted — CRMLS
- 2025-09-18 Listed $815,000 CRMLS
- 2025-07-23 Listing Removed — CRMLS
- 2025-01-23 Listed $855,000 CRMLS
- 2023-04-26 Sold (MLS) $679,045 CRMLS
- 2022-11-23 Relisted — CRMLS
- 2022-09-24 Relisted — CRMLS
- 2022-05-26 Listed $679,045 CRMLS
- 2022-05-26 Listing Removed — CRMLS
- 2022-05-18 Sold (Public Records) $4,595,000 Public Records
- 2022-05-03 Listed $679,045 CRMLS
- 2022-05-03 Sold (MLS) $4,495,000 CRMLS
- 2022-05-02 Pending — CRMLS
- 2022-05-02 Sold (Public Records) $4,495,000 Public Records
- 2022-04-19 Contingent — CRMLS
- 2022-04-01 Listed $4,495,000 CRMLS
- 2009-03-31 Listing Removed — CRMLS
- 2009-03-26 Sold (MLS) $1,460,000 CRMLS
- 2009-03-24 Sold (Public Records) $1,460,000 Public Records
- 2009-01-26 Relisted — CRMLS
- 2009-01-06 Listed — CRMLS
Property tax history
+26.2%/yrLatest (2025): $50,385 · +1.6% YoY. Source: county tax records.
Cash-flow waterfall
monthlySold comps — $/sqft
last 12 mo · ≤1 miLoading sold comps…