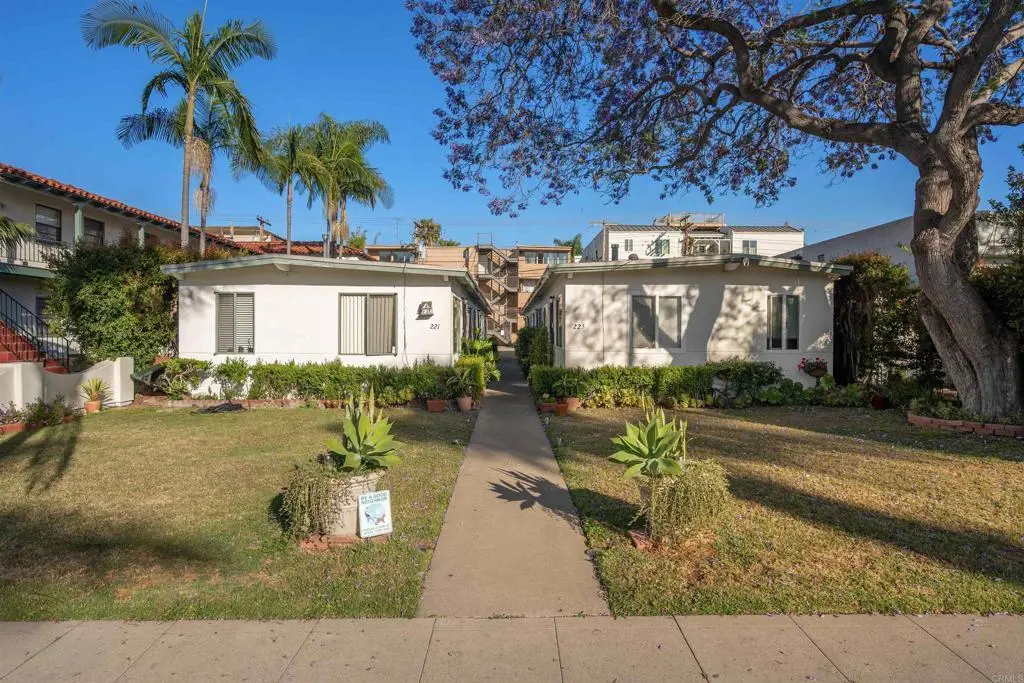
 7-Plex
221-225 D Ave · Coronado, CA
Flood risk 1/10 · Minimal
- FEMA flood zone
- X (unshaded)
- Chance of flooding over 30 yrs
- 0.0%
- Est. flood insurance / yr
- $507 – $1,088
Fire risk 1/10 · Minimal
- Est. fire insurance / yr
- $659 – $1,223
Heat risk 4/10 · Minor
- Hot days now (above 84°F)
- 7 days/yr
- Hot days in 30 yrs
- 19 days/yr
Wind risk 1/10 · Minimal
- Chance of severe wind over 30 yrs
- —
Air-quality risk 4/10 · Minor
- Unhealthy air days now
- 4 days/yr
- Unhealthy air days in 30 yrs
- 4 days/yr
Risk factors via First Street. Map © Google.
Why this score? — see what drove the D grade
The composite is a weighted blend of 9 inputs, each scored 0–100. Each bar is that input's sub-score; the figure is the points it added to the 100-point composite (weight × sub-score).
- Cash flow +10.7/30.0
- Schools +6.2/10.0
- Appreciation +5.7/10.0
- ARV discount +4.6/15.0
- Rent growth +3.6/5.0
- Livability +3.5/5.0
- 1% rule +3.2/10.0
- DSCR +3.1/10.0
- Condition / age +2.5/5.0
$3,600,000
🖨 Deal sheet (PDF) 📄 Offer letter ✓ Due diligence
Multi-family units
County records classify this as Multi-Family (2-4 Unit). Listing-text estimate: 7 units. estimate disagrees with records
Listing remarks
We proudly present a rarely available 7-unit residential income property in the heart of Coronado. Combining two lots totaling 7,018 square feet and zoned R-3 and classified under Tier 3 (historic review not required). Exceptional opportunity that surfaces once in a market cycle — just blocks from the iconic Ferry Landing with its waterfront dining, boutique shops, and direct access to San Diego Bay. Both APNs are being sold together. For the value-add investor, the existing units offer immediate upside through renovation and repositioning in one of California's most supply-constrained rental markets. For the developer or land banker, the R-3 zoning and combined lot size present a co
Key facts
- Waterfront dining
- Zoned r-3
- Combined lot size
Tags
Property features AI
Finance
- Other: Total of 7 leased units; Average one-bedroom area reported as 425 (unit of measure in listing); Building area total reported as 2,900 (unit of measure in listing)
- Financial info: Gross scheduled income approximately $121,000; Gross income approximately $120,700; Net operating income approximately $75,000; Laundry income approximately $300; Operating expenses approximately $46,000; Total expenses listed approximately $58,960; Insurance expense listed approximately $2,000; Water/sewer expense listed approximately $2,660; Trash expense listed approximately $3,700; New taxes listed approximately $39,600; Property subject to rent control
- HOA & community: Community features include golf course access, dog park, street lighting, storm drains, sidewalks, and nearby park
Exterior
- Parking: Five uncovered parking spaces (total 5 parking spaces)
- Utilities: Public sewer; Separate water meters: 2; Separate gas meters: 7; Separate electric meters: 7
- Home design: Attached multifamily property; Single-story buildings (total of 1 story); Two buildings on the parcel; Common walls (2+)
- Construction: Parcel numbers on file
- Exterior features: No pool; Lot is level/flat; Lot dimensions approximately 50 x 143' (combined parcels); Additional parcel on file
Interior
- Bedrooms: Total of 7 units (multifamily property)
- Interior features: Curb entry location; Entry level is ground floor
- Laundry & utility: Community laundry area; Laundry located in a designated area
Neighborhood map
What this means for you Summary
Snapshot
- This is a 7 × 2-bed/?-bath units multifamily listed at $3.60M.
Deal economics
- At list price, monthly cash flow is $-2k ($-20k/yr) — negative. Per door: $-242/mo.
- To cash-flow at today's rent, offer at most $3.36M (6.8% below list).
- To meet the 1% rule (rent ≥ 1% of price), the offer needs to be $2.94M (18.5% below list).
- Recommended offer: $2.94M (18.5% below list) — sets the bar for 1% rule.
- Cap rate 5.7% vs local median 0.9% in Coronado — top-decile yield for the area; either an underpriced asset or a hidden risk that comps aren't pricing in. Stress-test before assuming the spread holds.
Location & tenants
- Location reads 69/100 on livability (#249 in CA) — a middle-class / working-renter tenant base. Strengths: commute A+, employment A+, amenities A-; Watch: cost of living F, health & safety F.
- Coronado Unified (suburban): math 61% / reading 77% proficiency, ranked #47 of 517 in CA (top 9%) — acceptable for families but not a draw, mixed tenant base, ~2y average lease; only 5% free/reduced lunch — higher-income household profile.
- Zoned schools: Coronado Village Elementary (math 68% / reading 76%, grade A-, #122 of 1,571 statewide, top 8%, 780 students, 15% FRL); Coronado Middle (math 54% / reading 75%, grade A-, #45 of 498 statewide, top 9%, 641 students, 16% FRL); Coronado High (math 67% / reading 87%, grade A-, #61 of 1,170 statewide, top 5%, 1,045 students, 15% FRL).
- Market conditions: Rents rising fast (+4.4%/yr); 161 active listings in the ZIP; 19 comparable units currently listed for rent nearby; rentals lingering (median 46d on market — plan ~5-8 weeks vacancy on turnover, expect pricing pressure); 53% of comp listings sitting > 30 days — soft ceiling on asking rent; high-income renter base; 11,759 units permitted in San Diego County in 2024 (7,244 in 5+ unit buildings).
- At $29,350/mo this rent would consume 262% of the median local household income ($135k/yr) (locally 1052% of renters already pay >50% of income on rent) — very limited rent-growth headroom before tenants either downsize or default.
Forward outlook
- In year one you build about $76k of equity ($25k loan paydown + $51k appreciation (1.4% local appreciation)).
- San Diego County population projected at +20% by 2050 — long-run rental-demand tailwind backs the buy-and-hold thesis.
- By year 4, paydown + projected appreciation supports a ~$267k cash-out refi (75% LTV) — recoverable capital for the next deal without selling this one.
Negotiation context
- It's been on market 55 days — a 3% lower offer ($3.49M) is reasonable based on typical stale-listing flexibility.
- Current owner paid $75k; list at $3.60M implies a 4700% gain — meaningful room to come down on a strong offer.
Risks & watch-outs
- Watch-outs: built in 1955 — expect roof / HVAC / electrical / plumbing capex.
Questions for the listing agent
- What do current leases actually rent for vs. the listed asking? Can we see a recent rent roll and the last 12 months of T-12 income?
- It's been on market 55 days. Have you received any prior offers? Is the seller open to a 18% concession, seller financing, or rate buy-down credit?
- Can we see the unit-by-unit rent roll, current vacancy, and any below-market leases? What's the average tenancy length?
- What capital expenditures (roof, boiler, parking lot, exteriors) have been made in the last 5 years, and what's planned in the next 2?
- Built in 1955 — when were the roof, HVAC, electrical panel, plumbing, and water heater last replaced?
- Is there a deadline driving the sale (1031 exchange, divorce, estate, relocation)? That informs how much negotiation room exists.
- Schools are A-rated — typically a magnet for longer-tenancy family renters. What's the average tenant stay here, and is there a school-zone premium baked into asking?
- The area grade is low — what's the realistic commute time and amenity access for the typical tenant pool here? Any planned neighborhood developments (good or bad) we should know about?
- What's the average days-on-market for RENTAL listings here right now (not sales)? A rising rental-DOM trend means longer vacancies and softer asking-rent achievability than the comps imply.
- What's the recent tenant-quality profile in this submarket — average credit score on applications, eviction rate, late-payment / NSF rate, and stable-employment percentage? A property-management company in the area should have these aggregated.
- How much new apartment / multifamily construction is in the pipeline within 1–3 miles? Heavy new supply (>2% of stock underway) typically softens rents 12–24 months out; light construction supports rent growth.
Investment metrics
- 1% rule
- 0.82% ✗
- Cap rate
- 5.73%
- Cash-on-cash
- -2.01%
- DSCR
- 0.91
- GRM
- 10.2
CMA / ARV
- ARV (median comp)
- $3,381,042
- List price
- $3,600,000
- Delta
- 6.48%
- Verdict
- FAIR
- Comps
- 7 within 1.0 mi
Show comp detail 1 sale within ~0.75 mi
| Address | Dist | Beds/Ba | Sqft | Sold | Price | $/sf | Match |
|---|---|---|---|---|---|---|---|
| 756-62 G Ave | 0.65mi | 5/5.0 | 2,500 (-14%) | 2mo | $3,620,000 | $1,448 | 45 |
Match score weights: distance 35% · size 25% · config 20% · recency 20%. Top-matched comps best support the ARV.
Projected returns pro-forma
1.41% appreciation · 4.44% rent growth · sell at horizon
- IRR
- 1.4%
- Equity multiple
- 1.08×
- Total profit
- $75,913
- Equity at exit
- $1,306,426
- IRR
- 6.6%
- Equity multiple
- 1.87×
- Total profit
- $878,617
- Equity at exit
- $1,797,666
Cash invested: $1,008,000 (down + closing). Projections, not guarantees.
Landlord ↔ Tenant lean methodology
- Overall (STATE)
- 18 Strongly Tenant-Friendly
- State California
- 18 Strongly Tenant-Friendly · D+13
- County
- — inherits STATE
- City
- — inherits STATE
ZIP-level market 92118
- Home prices YoY
- 0.4%
- Rents YoY
- 4.4%
- Active inventory
- 161
- Price-to-rent
- 71.6×
Monthly cashflow live
- Estimated rent
- $29,350 medium interval (Pro) →
- Mortgage (P&I)
- −$18,879
- Tax est. 1.5%
- −$4,500 /mo · $54,000/yr
- Insurance
- −$1,500
- HOA
- −$0
- Vacancy / Maint / Mgmt
- −$6,164
- Net cashflow
- $-1,692
Break-even live
Sensitivity live
| Price | -10% $796 | -5% $-448 | +0% $-1,692 | +5% $-2,936 | +10% $-4,180 |
|---|---|---|---|---|---|
| Rent | -10% $-4,011 | -5% $-2,852 | +0% $-1,692 | +5% $-533 | +10% $626 |
| Rate | -1.0pp $121 | -0.5pp $-777 | base $-1,692 | +0.5pp $-2,625 | +1.0pp $-3,574 |
7-unit breakdown (identical units grouped — click to expand)
| Units | Beds | Baths | Est. rent |
|---|---|---|---|
| 7× units | 2 | — | $29,351 |
| #1 | 2 | — | $4,193 |
| #2 | 2 | — | $4,193 |
| #3 | 2 | — | $4,193 |
| #4 | 2 | — | $4,193 |
| #5 | 2 | — | $4,193 |
| #6 | 2 | — | $4,193 |
| #7 | 2 | — | $4,193 |
| Total (7 units) | $29,350 | ||
UW: 25.0% down · 7.5% · 30yr · 1.5% tax · 5.0% vac · 8.0% maint · 8.0% mgmt
Financing live
Cash to close
- Down payment
- $900,000
- Closing costs
- $108,000
- Reserves months
- —
- Total cash needed
- —
Loan-product check · same deal, 3 products live
Conventional
25% down · 7.5% · 30yr
- Down + closing
- —
- Monthly P&I
- —
- Monthly cashflow
- —
- DSCR
- —
- Eligible?
- —
Personal DTI + credit; lowest rate.
DSCR
20% down · 8.5% · 30yr
- Down + closing
- —
- Monthly P&I
- —
- Monthly cashflow
- —
- DSCR
- —
- Eligible?
- —
No personal income docs; deal must DSCR.
Hard money
10% down · 12.0% · 12mo
- Down + closing
- —
- Monthly P&I
- —
- Monthly cashflow
- —
- DSCR
- —
- Eligible?
- —
Short-term bridge; refi at stabilization.
Rent comps 19 comps
| Address | Beds | Baths | Sqft | Rent | $/sqft | DOM | Units | Dist |
|---|---|---|---|---|---|---|---|---|
| 120 C Ave Coronado, CA | 2.0–3.0 | 2.0 | 2246 | $8,000 | $3.56 | 16d | 2 | 0.14mi |
| 120 C Ave Coronado, CA | 2.0–3.0 | 2.0 | 2483 | $8,500 | $3.42 | 45d | 1 | 0.14mi |
| 1220 1st St #303 Coronado, CA | 3.0 | 3.0 | 2520 | $12,500 | $4.96 | 26d | 1 | 0.18mi |
| 1099 1st St Coronado, CA | 2.0–4.0 | 2.5–4.0 | 3092 | $6,700 | $2.17 | 45d | 4 | 0.20mi |
| 218 J Ave Coronado, CA | 3.0 | 2.5 | 2000 | $22,500 | $11.25 | 26d | 1 | 0.50mi |
| 733 H Ave Coronado, CA | 3.0 | 2.5 | 2477 | $8,750 | $3.53 | 26d | 1 | 0.64mi |
| 837 B Ave Coronado, CA | 3.0 | 2.5 | 2380 | $9,900 | $4.16 | 45d | 1 | 0.70mi |
| 540 Country Club Ln Coronado, CA | 3.0 | 3.0 | 2076 | $24,000 | $11.56 | 45d | 1 | 0.72mi |
| 610 Country Club Ln Coronado, CA | 3.0 | 2.5 | 2335 | $13,500 | $5.78 | 19d | 1 | 0.76mi |
| 911 E Ave #301 Coronado, CA | 3.0 | 2.5 | 2956 | $9,000 | $3.04 | 45d | 1 | 0.76mi |
| 942 D Ave Unit A Coronado, CA | 3.0 | 2.5 | 2358 | $9,500 | $4.03 | 45d | 1 | 0.79mi |
| 937 F Ave Coronado, CA | 3.0 | 3.5 | 2400 | $25,000 | $10.42 | 45d | 1 | 0.80mi |
| 958 A Ave Coronado, CA | 3.0 | 3.0 | 2200 | $7,000 | $3.18 | 45d | 1 | 0.84mi |
| 1612 Cajon Pl Coronado, CA | 3.0 | 3.0 | 2732 | $12,000 | $4.39 | 45d | 1 | 0.91mi |
| 817 Margarita Ave Coronado, CA | 3.0 | 2.0 | 2000 | $9,000 | $4.50 | 45d | 1 | 0.93mi |
| 200 Harbor Dr #1502 San Diego, CA | 2.0 | 3.0 | 2510 | $9,875 | $3.93 | 18d | 1 | 1.05mi |
| 700 W Harbor Dr San Diego, CA | 1.0–2.0 | 2.0 | 1530 | $9,495 | $6.21 | 18d | 3 | 1.05mi |
| 645 Front St #101 San Diego, CA | 3.0 | 3.0 | 2500 | $7,495 | $3.00 | 26d | 1 | 1.20mi |
| 1011 Union St San Diego, CA | 3.0 | 1.0–3.0 | 1496 | $11,401 | $7.62 | 1d | 29 | 1.43mi |
Listing history 16 events
-
2026-06-21days on market $3,600,000 Active 55 DOM
-
2026-06-18days on market $3,600,000 Active 52 DOM
-
2026-06-17days on market $3,600,000 Active 51 DOM
-
2026-06-16days on market $3,600,000 Active 50 DOM
-
2026-06-15days on market $3,600,000 Active 49 DOM
-
2026-06-13days on market $3,600,000 Active 47 DOM
-
2026-06-09days on market $3,600,000 Active 43 DOM
-
2026-06-08days on market $3,600,000 Active 42 DOM
-
2026-06-07days on market $3,600,000 Active 41 DOM
-
2026-06-04days on market $3,600,000 Active 38 DOM
-
2026-06-03days on market $3,600,000 Active 37 DOM
-
2026-06-02days on market $3,600,000 Active 36 DOM
-
2026-06-01days on market $3,600,000 Active 35 DOM
-
2026-05-31days on market $3,600,000 Active 34 DOM
-
2026-04-28$3,600,000 Active 977-char remark
-
1972-07-19soldstatus $75,000
ⓘ Source: listings_history table (triggers on properties + properties_extension) + one-shot
backfill from property_details.listing_events for pre-trigger history.
Climate risk First Street
- Flood 1/10 Low FEMA zone X (unshaded) · 0% chance over 30 yrs
- Wildfire 1/10 Low
- Heat 4/10 Moderate 7 d/yr ≥84°F today · 19 d/yr by 30 yrs out
- Wind 1/10 Low
- Air quality 4/10 Moderate 4 unhealthy d/yr today · 4 by 30 yrs out
Nearby sold comps map
Loading sold comps map…
Walkable amenities ~0.75 mi
Loading nearby amenities…
Taxation est. · year 1
- Rental income
- $352,200
- − Mortgage interest
- −$201,656
- − Property taxes
- −$54,000
- − Insurance
- −$18,000
- − Repairs & maintenance
- −$28,176
- − Management
- −$28,176
- − Depreciation
- −$104,727
- Taxable loss
- −$82,535
- Est. tax savings @ 24.0%
- +$19,808
- After-tax cash flow
- $-499/yr
For passive investors: Depreciation is non-cash, so a rental often shows a tax loss while cash-flowing — sheltering income. Rental losses are passive: they offset passive income freely, and up to $25,000/yr can offset ordinary (W-2) income if you actively participate and your MAGI is under $100k (phasing out to $0 by $150k); unused losses carry forward. On sale, claimed depreciation is recaptured at up to 25%, and gains may owe capital-gains tax (a 1031 exchange can defer both). Figures are a year-1 estimate at your 24.0% rate — not tax advice; consult a CPA.
Schools (NCES district)
- District
- Coronado Unified
- NCES district ID
- 0609870
- Math proficiency
- 61% ▼ -7.00%
- Reading proficiency
- 77% ▼ -1.00%
- Median HH income
- $91,550
- Composite
- 62.45/100
- National rank
- #691
- State rank
- #47 of 517 in CA
Livability — Coronado
- Score
- 69/100
- State rank
- #249
- US rank
- #8296
Category grades
Schools grade is shown separately in the Schools card above.
Census & demographics
- Census place
- Coronado, CA
- County
- San Diego County · 3,178,799 people
- City population
- 18,929
- Metro
- San Diego-Chula Vista-Carlsbad, CA
- Population (ZIP)
- 18,929
- Household income
- $134,534
- Rent vs Own
- Severe rent burden
- 1052.0
Population outlook (San Diego County) Hauer SSP2
- Today (2025)
- 3,678,185 people
- By 2030
- 3,856,546 · +4.8%
- By 2040
- 4,171,407 · +13.4%
- By 2050
- 4,421,607 · +20.2%
- By 2075
- 4,831,599 · +31.4%
- By 2100
- 4,832,502 · +31.4%
Race, ethnicity, and origin ACS 2023
- Neighborhood character
- Predominantly White (70%)
- Race & ethnicity
- White 70% Hispanic / Latino 19% Two or more races 11% Asian 4% Black 2%
- Hispanic origin (detail)
- Mexican 12% Puerto Rican 3%
- Common ancestry
- Italian 4% Lithuanian 4% Slovak 2%
- Foreign-born
- 10% · Canada, Jamaica
- Languages at home
- 84% English-only · Spanish 12% Tagalog/Filipino 1% Other Indo-European 1%
Political lean MEDSL · San Diego
- 2024 margin
- D (+16.8) · D 56.9% · R 40.1% · Other 2.9%
- 2008→2024 swing
- +6.6pp toward D · 2008: 10.2pp · 2024: 16.8pp
- All cycles
- 2024: D+16.8 2020: D+22.8 2016: D+17.8 2012: D+5.1 2008: D+10.2
Not yet ingested
- Civics
- —
Market trends
- HPI YoY
- ▲ 1.41%
- Current HPI
- 360.7979
- Rent YoY
- ▲ 4.44%
- Metro
- San Diego-Chula Vista-Carlsbad, CA
- State GDP YoY
- ▲ 3.21%
- F500 in state
- 116
Industry mix (Fortune 500 HQ in CA)
| Industry | F500 HQs | Revenue |
|---|---|---|
| Technology | 27 | $1,492B |
|
||
| Financial Services | 3 | $174B |
|
||
| Retail | 3 | $44B |
|
||
| Insurance | 3 | $26B |
|
||
| Media / Entertainment | 2 | $115B |
|
||
| Pharmaceuticals / Biotech | 2 | $62B |
|
||
Price history
+4700.0% since first listed2 events — show timeline
- 2026-04-28 Listed $3,600,000 CRMLS
- 1972-07-19 Sold (Public Records) $75,000 Public Records
Property tax history
+2.1%/yrLatest (2025): $3,066 · +0.9% YoY. Source: county tax records.
Cash-flow waterfall
monthlySold comps — $/sqft
last 12 mo · ≤1 miLoading sold comps…