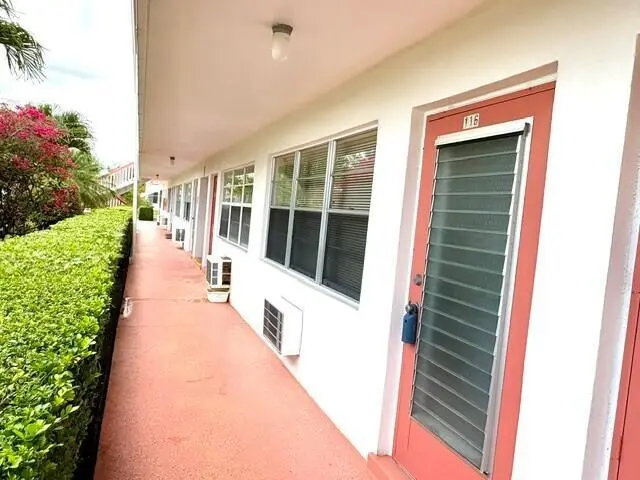
116 Windsor F · Plantation Mobile Home Park, FL
Flood risk 1/10 · Minimal
- FEMA flood zone
- X (unshaded)
- Chance of flooding over 30 yrs
- 0.0%
- Est. flood insurance / yr
- $507 – $1,088
Fire risk 2/10 · Minimal
- Est. fire insurance / yr
- $947 – $1,759
Heat risk 10/10 · Severe
- Hot days now (above 105°F)
- 7 days/yr
- Hot days in 30 yrs
- 27 days/yr
Wind risk 10/10 · Severe
- Chance of severe wind over 30 yrs
- 99.0%
Air-quality risk 2/10 · Minimal
- Unhealthy air days now
- 1 days/yr
- Unhealthy air days in 30 yrs
- 1 days/yr
Risk factors via First Street. Map © Google.
Why this score? — see what drove the C- grade
The composite is a weighted blend of 9 inputs, each scored 0–100. Each bar is that input's sub-score; the figure is the points it added to the 100-point composite (weight × sub-score).
- Cash flow +16.4/30.0
- 1% rule +10.0/10.0
- ARV discount +7.5/15.0
- DSCR +5.1/10.0
- Schools +4.3/10.0
- Livability +3.5/5.0
- Rent growth +2.5/5.0
- Condition / age +2.5/5.0
- Appreciation +0.0/10.0
$77,000
🖨 Deal sheet 📄 Offer letter ✓ Due diligence
Listing remarks
Discover unmatched convenience and comfort with this ideally located first-floor condo in Century Village, West Palm Beach. This residence offers one of the most desirable locations in the entire community, just steps from the gate with on-site gate security providing peace of mind and easy access for residents and guests. The CV Tram stop is directly in front of the unit, allowing effortless transportation throughout the community, while nearby bus routes make getting around the city simple and efficient. This unit is upgraded with tile flooring throughout. At 585 square feet, this unit has a little more space than the typical one bedroom and the porch is enclosed for even more area to enj
Key facts
- New tile
- Screened-in patio
- First floor
Tags
Property features AI
Finance
- Financial info: Pets allowed with possible restrictions (number and size limits may apply)
- HOA & community: Monthly HOA dues (amount listed separately); HOA amenities include: clubhouse, fitness center, pool, billiard room, community room, courtesy bus, jogging path, trails, sidewalks, picnic area, laundry, shuffleboard, bocce ball, pickleball courts
Exterior
- Parking: Assigned parking; Guest parking
- Security: Gated community with guard; Security patrol
- Utilities: Public water; Public sewer; Electric service: Three phase; Cable available
- Home design: Condominium; Single-story; Faces south; Resale condition
- Construction: Concrete construction
- Exterior features: Patio; Waterfront property
Interior
- Kitchen: Electric range; Refrigerator
- Bedrooms: One bedroom on the main level
- Bathrooms: One full bathroom on the main level
- Heating & cooling: Electric heating (window/wall units); Cooling via electric wall/window unit(s)
- Interior features: No additional interior features listed; Furnished
- Laundry & utility: Electric water heater; Community laundry available
Neighborhood map
What this means for you Summary
Snapshot
- This is a 1-bed/1.0-bath condo listed at $77k.
Deal economics
- At list price, monthly cash flow is $44 ($528/yr) — positive.
- The deal already cash-flows at list — no discount required.
- Meets the 1% rule at list price ($1k rent vs $77k).
Location & tenants
- Location reads 70/100 on livability (#430 in FL) — a middle-class / working-renter tenant base. Strengths: crime A+, cost of living A+, health & safety A+; Watch: schools F, amenities F, commute F.
- Palm Beach (suburban): math 46% / reading 53% proficiency, ranked #34 of 73 in FL (top 47%) — families likely to look elsewhere, expect single-tenant / working-renter base with shorter leases.
- Market conditions: Rents flat; 473 active listings in the ZIP; 40 comparable units currently listed for rent nearby; rentals at typical pace (median 24d on market — plan ~3-4 weeks tenant-placement turnaround); 3,974 units permitted in Palm Beach County in 2024 (1,012 in 5+ unit buildings).
- This rent runs 33% of the median local income ($52k/yr) — at the standard rent-burdened threshold; future hikes will face affordability resistance.
Forward outlook
- Local home prices are declining (-3.0%/yr); year-one equity from $532 of loan paydown is wiped out by about $2k of value loss. Plan a longer hold.
- Palm Beach County population projected at +30% by 2050 — long-run rental-demand tailwind backs the buy-and-hold thesis.
Negotiation context
- Only 10 days on market — expect competitive offers; lowballing is unlikely to land.
- Current owner paid $28k; list at $77k implies a 175% gain — meaningful room to come down on a strong offer.
Risks & watch-outs
- Watch-outs: HOA is 39% of rent.
- Climate carrying-cost: severe wind risk, 99% chance of damaging wind over 30y; extreme-heat days projected 7→27/yr by 2055 (HVAC capex compounding) — expect insurance premiums to compound above CPI over the hold.
Questions for the listing agent
- Built in 1972 — when were the roof, HVAC, electrical panel, plumbing, and water heater last replaced?
- What does the HOA fee cover, when was the last increase, and are there any pending special assessments or reserve-fund shortfalls?
- Any open or pending special assessments — roof, HVAC, plumbing, elevator, façade? What's the per-unit balance and payoff schedule, and is the seller paying it off at close or rolling it to the buyer?
- Is there a deadline driving the sale (1031 exchange, divorce, estate, relocation)? That informs how much negotiation room exists.
- Schools are F-rated, which usually means shorter tenancies and higher turnover. Who's the typical renter profile here, and what's been the actual vacancy rate?
- What's the average days-on-market for RENTAL listings here right now (not sales)? A rising rental-DOM trend means longer vacancies and softer asking-rent achievability than the comps imply.
- What's the recent tenant-quality profile in this submarket — average credit score on applications, eviction rate, late-payment / NSF rate, and stable-employment percentage? A property-management company in the area should have these aggregated.
- How much new apartment / multifamily construction is in the pipeline within 1–3 miles? Heavy new supply (>2% of stock underway) typically softens rents 12–24 months out; light construction supports rent growth.
Investment metrics
- 1% rule
- 1.82% ✓
- Cap rate
- 6.98%
- Cash-on-cash
- 2.45%
- DSCR
- 1.11
- GRM
- 4.6
CMA / ARV
No comps found within radius.
Projected returns pro-forma
-3.0% appreciation · 0.02% rent growth · sell at horizon
- IRR
- -18.7%
- Equity multiple
- 0.38×
- Total profit
- $-13,409
- Equity at exit
- $11,481
- IRR
- -34.1%
- Equity multiple
- -0.04×
- Total profit
- $-22,439
- Equity at exit
- $6,658
Cash invested: $21,560 (down + closing). Projections, not guarantees.
Landlord ↔ Tenant lean methodology
- Overall (STATE)
- 87 Strongly Landlord-Friendly
- State Florida
- 87 Strongly Landlord-Friendly · R+3
- County
- — inherits STATE
- City
- — inherits STATE
ZIP-level market 33417
- Home prices YoY
- -29.2%
- Rents YoY
- 0.0%
- Active inventory
- 473
- Price-to-rent
- 4.6×
Monthly cashflow live
- Estimated rent
- $1,402 high interval (Pro) →
- Mortgage (P&I)
- −$404
- Tax from tax record
- −$88 /mo · $1,055/yr
- Insurance
- −$32
- HOA
- −$540
- Vacancy / Maint / Mgmt
- −$294
- Net cashflow
- $44
Break-even live
UW: 25.0% down · 7.5% · 30yr · 1.5% tax · 5.0% vac · 8.0% maint · 8.0% mgmt
Financing live
Cash to close
- Down payment
- $19,250
- Closing costs
- $2,310
- Reserves months
- —
- Total cash needed
- —
Loan-product check · same deal, 3 products live
Conventional
25% down · 7.5% · 30yr
- Down + closing
- —
- Monthly P&I
- —
- Monthly cashflow
- —
- DSCR
- —
- Eligible?
- —
Personal DTI + credit; lowest rate.
DSCR
20% down · 8.5% · 30yr
- Down + closing
- —
- Monthly P&I
- —
- Monthly cashflow
- —
- DSCR
- —
- Eligible?
- —
No personal income docs; deal must DSCR.
Hard money
10% down · 12.0% · 12mo
- Down + closing
- —
- Monthly P&I
- —
- Monthly cashflow
- —
- DSCR
- —
- Eligible?
- —
Short-term bridge; refi at stabilization.
Rent comps 40 comps
| Address | Beds | Baths | Sqft | Rent | $/sqft | DOM | Units | Dist |
|---|---|---|---|---|---|---|---|---|
| 226 Windsor J Unit J West Palm Beach, FL | 1.0 | 1.5 | 738 | $1,250 | $1.69 | 24d | 1 | 0.01mi |
| 210 Windsor J Unit J West Palm Beach, FL | 1.0 | 1.0 | 585 | $1,400 | $2.39 | 24d | 1 | 0.02mi |
| 218 Windsor J Unit J West Palm Beach, FL | 1.0 | 1.0 | 585 | $1,275 | $2.18 | 24d | 1 | 0.02mi |
| 150 Windsor G West Palm Beach, FL | 1.0 | 1.0 | 585 | $1,500 | $2.56 | 7d | 1 | 0.06mi |
| 361 Windsor N West Palm Beach, FL | 1.0 | 1.5 | 702 | $1,350 | $1.92 | 24d | 1 | 0.10mi |
| 298 Windsor M Unit M West Palm Beach, FL | 1.0 | 1.5 | 702 | $1,300 | $1.85 | 24d | 1 | 0.12mi |
| 298 Windsor M Unit M West Palm Beach, FL | 1.0 | 1.5 | 702 | $1,250 | $1.78 | 17d | 1 | 0.12mi |
| 36 Windsor B West Palm Beach, FL | 1.0 | 1.0 | 585 | $1,200 | $2.05 | 24d | 1 | 0.13mi |
| 36 Windsor B West Palm Beach, FL | 1.0 | 1.0 | 585 | $1,200 | $2.05 | 1d | 1 | 0.13mi |
| 284 Windsor M Unit M West Palm Beach, FL | 1.0 | 1.0 | 585 | $1,350 | $2.31 | 24d | 1 | 0.13mi |
| 16 Windsor a West Palm Beach, FL | 1.0 | 1.0 | 585 | $1,300 | $2.22 | 5d | 1 | 0.13mi |
| 63 Windsor C Unit C West Palm Beach, FL | 1.0 | 1.5 | 702 | $1,650 | $2.35 | 24d | 1 | 0.17mi |
| 364 Camden Dr Unit 364 West Palm Beach, FL | 1.0 | 1.0 | 570 | $1,500 | $2.63 | 24d | 1 | 0.21mi |
| 372 Camden P West Palm Beach, FL | 1.0 | 1.0 | 570 | $1,200 | $2.11 | 24d | 1 | 0.21mi |
| 374 Camden P West Palm Beach, FL | 1.0 | 1.0 | 570 | $1,150 | $2.02 | 18d | 1 | 0.22mi |
| 179 Berkshire I Unit I West Palm Beach, FL | 1.0 | 1.0 | 585 | $1,225 | $2.09 | 24d | 1 | 0.23mi |
| 3 Berkshire a West Palm Beach, FL | 1.0 | 1.0 | 585 | $1,900 | $3.25 | 24d | 1 | 0.23mi |
| 220 Berkshire K #220 West Palm Beach, FL | 1.0 | 1.0 | 585 | $1,300 | $2.22 | 20d | 1 | 0.26mi |
| 325 Andover E West Palm Beach, FL | 1.0 | 1.0 | 532 | $1,450 | $2.73 | 24d | 1 | 0.26mi |
| 326 Andover E West Palm Beach, FL | 1.0 | 1.5 | 684 | $1,490 | $2.18 | 24d | 1 | 0.27mi |
| 157 Camden G West Palm Beach, FL | 1.0 | 1.5 | 646 | $1,350 | $2.09 | 24d | 1 | 0.27mi |
| 209 Camden I Unit 209 West Palm Beach, FL | 1.0 | 1.5 | 738 | $1,350 | $1.83 | 24d | 1 | 0.28mi |
| 231 Berkshire K #231 West Palm Beach, FL | 1.0 | 1.0 | 585 | $1,150 | $1.97 | 3d | 1 | 0.28mi |
| 216 Berkshire K Unit K West Palm Beach, FL | 1.0 | 1.0 | 585 | $1,400 | $2.39 | 20d | 1 | 0.30mi |
| 89 Berkshire D #89 West Palm Beach, FL | 1.0 | 1.0 | 585 | $1,150 | $1.97 | 24d | 1 | 0.30mi |
| 89 Berkshire D #89 West Palm Beach, FL | 1.0 | 1.0 | 585 | $1,050 | $1.79 | 7d | 1 | 0.30mi |
| 100 Andover D West Palm Beach, FL | 1.0 | 1.5 | 684 | $1,400 | $2.05 | 24d | 1 | 0.32mi |
| 34 Andover B West Palm Beach, FL | 1.0 | 1.0 | 532 | $1,250 | $2.35 | 7d | 1 | 0.33mi |
| 92 Berkshire Cres Unit 92 West Palm Beach, FL | 1.0 | 1.0 | 615 | $1,350 | $2.20 | 24d | 1 | 0.33mi |
| 172 Camden I West Palm Beach, FL | 1.0 | 1.5 | 646 | $1,400 | $2.17 | 3d | 1 | 0.33mi |
| 132 Andover F Unit 132 West Palm Beach, FL | 1.0 | 1.5 | 684 | $1,400 | $2.05 | 24d | 1 | 0.34mi |
| 22 Andover a West Palm Beach, FL | 1.0 | 1.5 | 684 | $1,375 | $2.01 | 24d | 1 | 0.35mi |
| 311 Andover M West Palm Beach, FL | 1.0 | 1.5 | 684 | $1,400 | $2.05 | 24d | 1 | 0.38mi |
| 311 Andover M Unit M West Palm Beach, FL | 1.0 | 1.5 | 684 | $1,400 | $2.05 | 24d | 1 | 0.38mi |
| 150 Bedford E West Palm Beach, FL | 1.0 | 1.0 | 570 | $1,375 | $2.41 | 7d | 1 | 0.46mi |
| 6386 Emerald Dunes Dr West Palm Beach, FL | 1.0–3.0 | 1.0–2.0 | 1060 | $1,850 | $1.74 | 15d | 2 | 0.47mi |
| 6386 Emerald Dunes Dr West Palm Beach, FL | 1.0–3.0 | 1.0–2.0 | 1060 | $1,850 | $1.74 | 3d | 2 | 0.47mi |
| 142 Kent I West Palm Beach, FL | 1.0 | 1.5 | 684 | $1,475 | $2.16 | 24d | 1 | 0.48mi |
| 107 Kent St Unit 107* West Palm Beach, FL | 1.0 | 1.0 | 570 | $1,500 | $2.63 | 24d | 1 | 0.48mi |
| 333 Northampton Q Unit 333 West Palm Beach, FL | 1.0 | 1.0 | 570 | $1,300 | $2.28 | 24d | 1 | 0.52mi |
HOA detail condo
- Monthly dues
- $540 · $6,480/yr
- Likely covers
- security
- Assessments
- None detected in remarks — confirm with the listing agent.
Listing history 9 events
-
2026-06-18days on market $77,000 Active 10 DOM
-
2026-06-17days on market $77,000 Active 9 DOM
-
2026-06-16days on market $77,000 Active 8 DOM
-
2026-06-15days on market $77,000 Active 7 DOM
-
2026-06-13days on market $77,000 Active 5 DOM
-
2026-06-08days on market $77,000 Active 1 DOM
-
2026-02-18price $77,000
-
2025-12-07$85,500 Active
-
1983-11-01soldstatus $28,000
ⓘ Source: listings_history table (triggers on properties + properties_extension) + one-shot
backfill from property_details.listing_events for pre-trigger history.
Tax reassessment forecast FL · Resets to sale price
- Current annual tax
- $1,055 · $88/mo
- Projected year-2 tax
- $1,055 · $88/mo
- Expected delta
- $0/yr ($0/mo · 0.0%)
ⓘ Screening estimate from a state-policy table — verify with the county assessor before closing.
Climate risk First Street
- Flood 1/10 Low FEMA zone X (unshaded) · 0% chance over 30 yrs
- Wildfire 2/10 Low
- Heat 10/10 Extreme 7 d/yr ≥105°F today · 27 d/yr by 30 yrs out
- Wind 10/10 Extreme 99% chance of damaging wind over 30 yrs
- Air quality 2/10 Low 1 unhealthy d/yr today · 1 by 30 yrs out
Nearby sold comps map
Loading sold comps map…
Walkable amenities ~0.75 mi
Loading nearby amenities…
Taxation est. · year 1
- Rental income
- $16,827
- − Mortgage interest
- −$4,313
- − Property taxes
- −$1,055
- − Insurance
- −$385
- − Repairs & maintenance
- −$1,346
- − Management
- −$1,346
- − HOA
- −$6,480
- − Depreciation
- −$2,240
- Taxable loss
- −$338
- Est. tax savings @ 24.0%
- +$81
- After-tax cash flow
- $609/yr
For passive investors: Depreciation is non-cash, so a rental often shows a tax loss while cash-flowing — sheltering income. Rental losses are passive: they offset passive income freely, and up to $25,000/yr can offset ordinary (W-2) income if you actively participate and your MAGI is under $100k (phasing out to $0 by $150k); unused losses carry forward. On sale, claimed depreciation is recaptured at up to 25%, and gains may owe capital-gains tax (a 1031 exchange can defer both). Figures are a year-1 estimate at your 24.0% rate — not tax advice; consult a CPA.
Schools (NCES district)
- District
- Palm Beach
- NCES district ID
- 1201500
- Math proficiency
- 46% ▼ -16.00%
- Reading proficiency
- 53% ▼ -4.00%
- Median HH income
- $53,943
- Composite
- 42.72/100
- National rank
- #3160
- State rank
- #34 of 73 in FL
Livability — Plantation Mobile Home Park
- Score
- 70/100
- State rank
- #430
- US rank
- #7700
Category grades
Schools grade is shown separately in the Schools card above.
Census & demographics
- County
- Palm Beach County · 1,438,312 people
- Metro
- Miami-Fort Lauderdale-Pompano Beach, FL
- Population (ZIP)
- 38,079
- Household income
- $51,605
- Rent vs Own
- Severe rent burden
- 2548.0
Population outlook (Palm Beach County) Hauer SSP2
- Today (2025)
- 1,637,487 people
- By 2030
- 1,743,255 · +6.5%
- By 2040
- 1,948,712 · +19.0%
- By 2050
- 2,132,979 · +30.3%
- By 2075
- 2,530,027 · +54.5%
- By 2100
- 2,706,979 · +65.3%
Race, ethnicity, and origin ACS 2023
- Neighborhood character
- Highly diverse neighborhood (Simpson 0.72)
- Race & ethnicity
- White 34% Black 30% Hispanic / Latino 27% Two or more races 16% Asian 3%
- Hispanic origin (detail)
- Mexican 3% Puerto Rican 6% Cuban 5% Dominican 2%
- Common ancestry
- Hispanic 10% Romanian 3% Scotch-Irish 1%
- Foreign-born
- 34% · Canada, Jamaica
- Languages at home
- 58% English-only · Spanish 24% French/Haitian/Cajun 11% Other Indo-European 3%
Political lean MEDSL · Palm Beach
- 2024 margin
- Toss-up / Even · D 50.0% · R 49.2%
- 2008→2024 swing
- -22.1pp toward R · 2008: 22.9pp · 2024: 0.8pp
- All cycles
- 2024: D+0.8 2020: D+12.8 2016: D+15.3 2012: D+17.0 2008: D+22.9
Not yet ingested
- Civics
- —
Market trends
- HPI YoY
- ▼ -138.62%
- Current HPI
- 335.8396
- Rent YoY
- ▬ 0.02%
- Metro
- Miami-Fort Lauderdale-Pompano Beach, FL
- State GDP YoY
- ▲ 3.28%
- F500 in state
- 36
Industry mix (Fortune 500 HQ in FL)
| Industry | F500 HQs | Revenue |
|---|---|---|
| Industrial Technology | 2 | $29B |
|
||
| Insurance | 2 | $17B |
|
||
| Retail | 1 | $60B |
|
||
| Technology Distribution | 1 | $58B |
|
||
| Homebuilding | 1 | $35B |
|
||
| Technology Manufacturing | 1 | $35B |
|
||
Price history
+175.0% since first listed3 events — show timeline
- 2026-02-18 Price Changed $77,000 Beaches MLS
- 2025-12-07 Listed $85,500 Beaches MLS
- 1983-11-01 Sold (Public Records) $28,000 Public Records
Property tax history
+6.8%/yrLatest (2025): $1,055 · +0.9% YoY. Source: county tax records.
Cash-flow waterfall
monthlySold comps — $/sqft
last 12 mo · ≤1 miLoading sold comps…