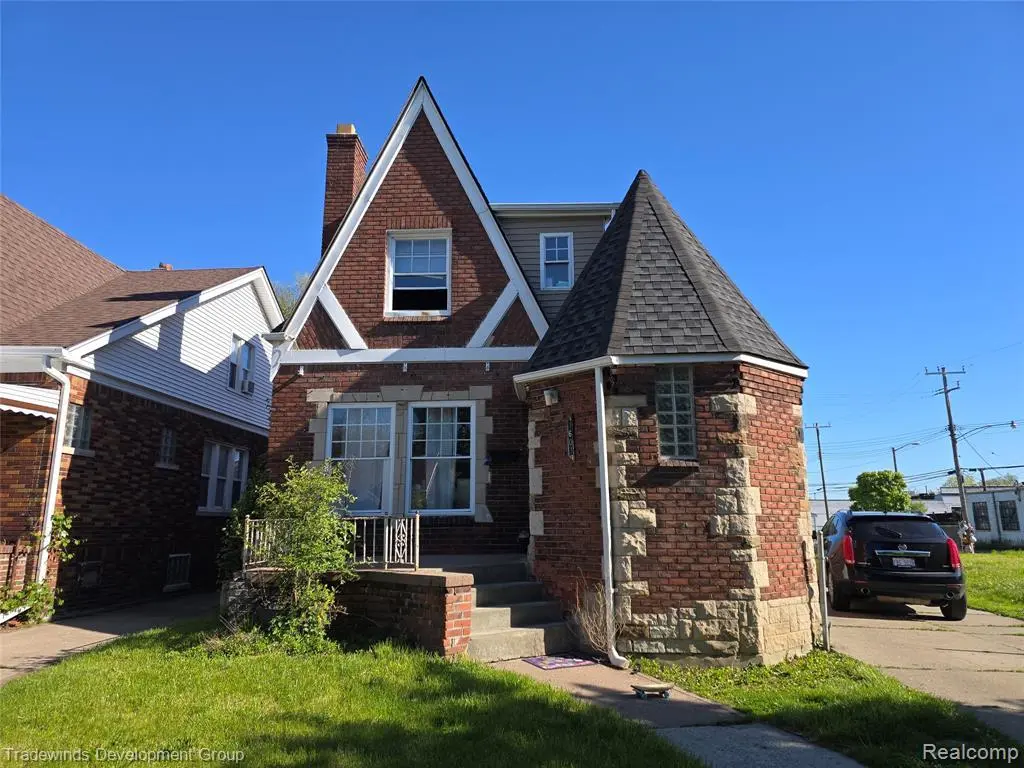
7607 Dobel St · Detroit, MI
Flood risk 6/10 · Moderate
- FEMA flood zone
- X (unshaded)
- Chance of flooding over 30 yrs
- 0.74%
- Est. flood insurance / yr
- $473 – $860
Fire risk 1/10 · Minimal
- Est. fire insurance / yr
- $784 – $1,456
Heat risk 3/10 · Minor
- Hot days now (above 97°F)
- 7 days/yr
- Hot days in 30 yrs
- 15 days/yr
Wind risk 2/10 · Minimal
- Chance of severe wind over 30 yrs
- —
Air-quality risk 3/10 · Minor
- Unhealthy air days now
- 2 days/yr
- Unhealthy air days in 30 yrs
- 5 days/yr
Risk factors via First Street. Map © Google.
Why this score? — see what drove the B- grade
The composite is a weighted blend of 9 inputs, each scored 0–100. Each bar is that input's sub-score; the figure is the points it added to the 100-point composite (weight × sub-score).
- Cash flow +30.0/30.0
- 1% rule +10.0/10.0
- DSCR +10.0/10.0
- ARV discount +7.5/15.0
- Rent growth +4.2/5.0
- Livability +3.7/5.0
- Condition / age +2.5/5.0
- Schools +1.3/10.0
- Appreciation +0.0/10.0
$99,000
🖨 Deal sheet (PDF) 📄 Offer letter ✓ Due diligence
Listing remarks
This could be your home or the next cashcow in your portfolio! Great 5 bed 2 bath located in Airport Sub the home you have been waiting for! Must see the inside! Formal dining room, large common areas upstairs, partially finished basement, laundry hook ups, and 2 car garage. This home is close to shopping, places of worship, schools, grocery, pharmacy, restaurants and freeways. Located west of Van Dyke and south of McNichols. Close to Mt. Olivet and Detroit City Airport. This home is just waiting for your updates. Cash or Conv. Home sold as is. Please do not disturb tenants this property is occupied. All information to be confirmed by the buyer and/or their agent(s).
Key facts
- Large common areas
- Close to schools
- Formal dining room
Tags
Property features AI
Finance
- Financial info: Property has a lease
Exterior
- Parking: Detached 2-car garage
- Utilities: Public water; Natural gas heating (forced air)
- Home design: Residential property; 1 1/2-story structure; Built in 1936; Frontage approximately 35 feet
- Construction: Brick construction; Basement foundation; Year built: 1936
- Exterior features: Brick exterior; Paved street frontage
Interior
- Kitchen: Kitchen on the entry level (approximately 10 x 11)
- Bedrooms: Two bedrooms on the second level (each about 9 x 9); Three bedrooms on the entry level (each about 9 x 9, one listed as W=9)
- Bathrooms: Two full bathrooms; Entry-level bathroom approx. 6 x 7; Second-level bathroom approx. 7 x 6
- Heating & cooling: Forced air heating; Natural gas fuel
- Interior features: 9 total rooms; Unfinished basement
- Laundry & utility: Basement present (unfinished)
Neighborhood map
What this means for you Summary
Snapshot
- This is a 5-bed/1.5-bath single-family listed at $99k.
Deal economics
- At list price, monthly cash flow is $592 ($7k/yr) — positive.
- The deal already cash-flows at list — no discount required.
- Meets the 1% rule at list price ($2k rent vs $99k).
- Cap rate 13.5% vs local median 10.0% in Detroit — top-decile yield for the area; either an underpriced asset or a hidden risk that comps aren't pricing in. Stress-test before assuming the spread holds.
Location & tenants
- Location reads 73/100 on livability (#218 in MI) — a middle-class / working-renter tenant base. Strengths: amenities A+, commute A+, cost of living A+; Watch: crime F, employment F.
- Detroit Public Schools Community District (urban): math 10% / reading 24% proficiency, ranked #499 of 540 in MI (top 92%) — low school quality limits family demand, transient renter base, plan for 1-2y turnover; 90% free/reduced lunch — lower-income household profile, screen leases tightly.
- Zoned schools: Al Holmes Academy of Blended Learning (math 10% / reading 10%, grade F, #1,230 of 1,397 statewide, top 91%, 391 students, 95% FRL); Osborn High School (math 5% / reading 15%, grade F, #659 of 713 statewide, top 97%, 407 students, 92% FRL) — zoned schools at 94% FRL track the district average.
- Market conditions: Rents rising fast (+6.7%/yr); 227 active listings in the ZIP; 1 comparable units currently listed for rent nearby; lower-income renter base — watch delinquency; 2,639 units permitted in Wayne County in 2024 (1,216 in 5+ unit buildings).
- At $1,672/mo this rent would consume 57% of the median local household income ($35k/yr) (locally 2372% of renters already pay >50% of income on rent) — very limited rent-growth headroom before tenants either downsize or default.
Forward outlook
- Local home prices are declining (-3.0%/yr); year-one equity from $684 of loan paydown is wiped out by about $3k of value loss. Plan a longer hold.
- Wayne County population projected at -17% by 2050 — secular population decline; favor cash flow + early exit over multi-decade hold.
- At projected returns (-3.0% appreciation + 6.7% rent growth), your $28k cash investment doubles in ~5 years — after that, you're playing with house money.
Negotiation context
- Only 7 days on market — expect competitive offers; lowballing is unlikely to land.
Risks & watch-outs
- Watch-outs: built in 1936 — expect roof / HVAC / electrical / plumbing capex.
- Climate carrying-cost: major flood risk — expect insurance premiums to compound above CPI over the hold.
Questions for the listing agent
- Built in 1936 — when were the roof, HVAC, electrical panel, plumbing, and water heater last replaced?
- Is there a deadline driving the sale (1031 exchange, divorce, estate, relocation)? That informs how much negotiation room exists.
- Schools are F-rated, which usually means shorter tenancies and higher turnover. Who's the typical renter profile here, and what's been the actual vacancy rate?
- Crime grade is F in this area — have there been break-ins, vandalism, or insurance claims at this property in the last 3 years? What carrier currently insures it and at what premium?
- What's the average days-on-market for RENTAL listings here right now (not sales)? A rising rental-DOM trend means longer vacancies and softer asking-rent achievability than the comps imply.
- What's the recent tenant-quality profile in this submarket — average credit score on applications, eviction rate, late-payment / NSF rate, and stable-employment percentage? A property-management company in the area should have these aggregated.
- How much new for-sale + rental construction is in the pipeline within 1–3 miles? Heavy new supply typically softens prices + rents 12–24 months out; constrained supply supports both.
Investment metrics
- 1% rule
- 1.69% ✓
- Cap rate
- 13.47%
- Cash-on-cash
- 25.63%
- DSCR
- 2.14
- GRM
- 4.9
CMA / ARV
No comps found within radius.
Projected returns pro-forma
-3.0% appreciation · 6.72% rent growth · sell at horizon
- IRR
- 23.6%
- Equity multiple
- 2.02×
- Total profit
- $28,216
- Equity at exit
- $14,761
- IRR
- 33.8%
- Equity multiple
- 4.68×
- Total profit
- $102,109
- Equity at exit
- $8,560
Cash invested: $27,720 (down + closing). Projections, not guarantees.
Landlord ↔ Tenant lean methodology
- Overall (STATE)
- 62 Landlord-Friendly
- State Michigan
- 62 Landlord-Friendly · EVEN
- County
- — inherits STATE
- City
- — inherits STATE
ZIP-level market 48234
- Home prices YoY
- -11.9%
- Rents YoY
- 6.7%
- Active inventory
- 227
- Price-to-rent
- 4.9×
Monthly cashflow live
- Estimated rent
- $1,672 medium interval (Pro) →
- Mortgage (P&I)
- −$519
- Tax from tax record
- −$168 /mo · $2,020/yr
- Insurance
- −$41
- HOA
- −$0
- Vacancy / Maint / Mgmt
- −$351
- Net cashflow
- $592
Break-even live
Sensitivity live
| Price | -10% $648 | -5% $620 | +0% $592 | +5% $564 | +10% $536 |
|---|---|---|---|---|---|
| Rent | -10% $460 | -5% $526 | +0% $592 | +5% $658 | +10% $724 |
| Rate | -1.0pp $642 | -0.5pp $617 | base $592 | +0.5pp $566 | +1.0pp $540 |
UW: 25.0% down · 7.5% · 30yr · 1.5% tax · 5.0% vac · 8.0% maint · 8.0% mgmt
Financing live
Cash to close
- Down payment
- $24,750
- Closing costs
- $2,970
- Reserves months
- —
- Total cash needed
- —
Loan-product check · same deal, 3 products live
Conventional
25% down · 7.5% · 30yr
- Down + closing
- —
- Monthly P&I
- —
- Monthly cashflow
- —
- DSCR
- —
- Eligible?
- —
Personal DTI + credit; lowest rate.
DSCR
20% down · 8.5% · 30yr
- Down + closing
- —
- Monthly P&I
- —
- Monthly cashflow
- —
- DSCR
- —
- Eligible?
- —
No personal income docs; deal must DSCR.
Hard money
10% down · 12.0% · 12mo
- Down + closing
- —
- Monthly P&I
- —
- Monthly cashflow
- —
- DSCR
- —
- Eligible?
- —
Short-term bridge; refi at stabilization.
Rent comps 1 comps
| Address | Beds | Baths | Sqft | Rent | $/sqft | DOM | Units | Dist |
|---|---|---|---|---|---|---|---|---|
| 18431 Teppert St Detroit, MI | 4.0 | 1.0 | 1200 | $1,400 | $1.17 | 3d | 1 | 1.21mi |
Listing history 8 events
-
2026-06-21days on market $99,000 Active 7 DOM
-
2026-06-18days on market $99,000 Active 4 DOM
-
2026-06-17days on market $99,000 Active 3 DOM
-
2026-06-16days on market $99,000 Active 2 DOM
-
2026-06-15days on market $99,000 Active 1 DOM
-
2026-06-15days on market $99,000 Active 3 DOM
-
2026-06-13remarks 677-char remark
-
2026-06-13$99,000 Active 1 DOM
ⓘ Source: listings_history table (triggers on properties + properties_extension) + one-shot
backfill from property_details.listing_events for pre-trigger history.
Tax reassessment forecast MI · Partial reset (capped growth)
- Current annual tax
- $2,020 · $168/mo
- Projected year-2 tax
- $2,020 · $168/mo
- Expected delta
- $0/yr ($0/mo · -0.0%)
ⓘ Screening estimate from a state-policy table — verify with the county assessor before closing.
Climate risk First Street
- Flood 6/10 Major FEMA zone X (unshaded) · 74% chance over 30 yrs
- Wildfire 1/10 Low
- Heat 3/10 Moderate 7 d/yr ≥97°F today · 15 d/yr by 30 yrs out
- Wind 2/10 Low
- Air quality 3/10 Moderate 2 unhealthy d/yr today · 5 by 30 yrs out
Nearby sold comps map
Loading sold comps map…
Walkable amenities ~0.75 mi
Loading nearby amenities…
Taxation est. · year 1
- Rental income
- $20,064
- − Mortgage interest
- −$5,546
- − Property taxes
- −$2,020
- − Insurance
- −$495
- − Repairs & maintenance
- −$1,605
- − Management
- −$1,605
- − Depreciation
- −$2,880
- Taxable income
- $5,913
- Est. tax owed @ 24.0%
- −$1,419
- After-tax cash flow
- $5,687/yr
For passive investors: Depreciation is non-cash, so a rental often shows a tax loss while cash-flowing — sheltering income. Rental losses are passive: they offset passive income freely, and up to $25,000/yr can offset ordinary (W-2) income if you actively participate and your MAGI is under $100k (phasing out to $0 by $150k); unused losses carry forward. On sale, claimed depreciation is recaptured at up to 25%, and gains may owe capital-gains tax (a 1031 exchange can defer both). Figures are a year-1 estimate at your 24.0% rate — not tax advice; consult a CPA.
Schools (NCES district)
- District
- Detroit Public Schools Community District
- NCES district ID
- 2601103
- Math proficiency
- 10% ▼ -2.00%
- Reading proficiency
- 24% ▲ 6.00%
- Median HH income
- $25,815
- Composite
- 13.06/100
- National rank
- #9564
- State rank
- #499 of 540 in MI
Livability — Detroit
- Score
- 73/100
- State rank
- #218
- US rank
- #5427
Category grades
Schools grade is shown separately in the Schools card above.
Census & demographics
- Census place
- Detroit, MI
- County
- Wayne County · 1,562,939 people
- City population
- 572,865
- Metro
- Detroit-Warren-Dearborn, MI
- Population (ZIP)
- 32,760
- Household income
- $35,322
- Rent vs Own
- Severe rent burden
- 2372.0
Population outlook (Wayne County) Hauer SSP2
- Today (2025)
- 1,675,273 people
- By 2030
- 1,620,300 · -3.3%
- By 2040
- 1,502,341 · -10.3%
- By 2050
- 1,384,039 · -17.4%
- By 2075
- 1,124,592 · -32.9%
- By 2100
- 881,193 · -47.4%
Race, ethnicity, and origin ACS 2023
- Neighborhood character
- Predominantly Black (94%)
- Race & ethnicity
- Black 94% White 3% Two or more races 1%
- Common ancestry
- Romanian 1%
- Foreign-born
- 2% · Canada, Vietnam, Philippines
- Languages at home
- 97% English-only · French/Haitian/Cajun 1%
Political lean MEDSL · Wayne
- 2024 margin
- Strong D (+29.0) · D 62.7% · R 33.7% · Other 3.6%
- 2008→2024 swing
- -20.5pp toward R · 2008: 49.5pp · 2024: 29.0pp
- All cycles
- 2024: D+29.0 2020: D+38.1 2016: D+37.3 2012: D+46.9 2008: D+49.5
Not yet ingested
- Civics
- —
Market trends
- HPI YoY
- ▼ -44.65%
- Current HPI
- 328.8978
- Rent YoY
- ▲ 6.72%
- Metro
- Detroit-Warren-Dearborn, MI
- State GDP YoY
- ▲ 1.37%
- F500 in state
- 28
Industry mix (Fortune 500 HQ in MI)
| Industry | F500 HQs | Revenue |
|---|---|---|
| Automotive Parts | 3 | $48B |
|
||
| Automotive | 2 | $372B |
|
||
| Chemicals | 1 | $45B |
|
||
| Automotive Retail | 1 | $29B |
|
||
| Healthcare / Medical Devices | 1 | $23B |
|
||
| Automotive Technology | 1 | $20B |
|
||
Price history
+25.3% since first listed4 events — show timeline
- 2026-06-12 Listed $99,000 MiRealSource-MiMLS
- 2024-04-16 Sold (Public Records) $119,000 Public Records
- 2024-01-24 Sold (Public Records) $89,000 Public Records
- 2020-06-19 Sold (Public Records) $79,000 Public Records
Property tax history
+19.2%/yrLatest (2025): $2,020 · +16.1% YoY. Source: county tax records.
Cash-flow waterfall
monthlySold comps — $/sqft
last 12 mo · ≤1 miLoading sold comps…