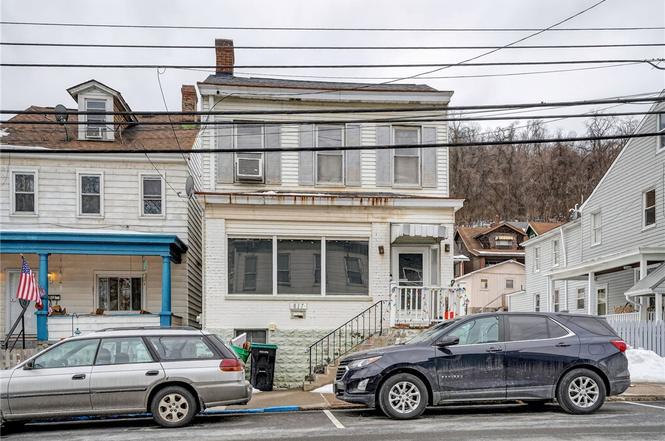
817 North Ave · Millvale, PA
Flood risk 6/10 · Moderate
- FEMA flood zone
- X (unshaded)
- Chance of flooding over 30 yrs
- 0.74%
- Est. flood insurance / yr
- $473 – $860
Fire risk 1/10 · Minimal
- Est. fire insurance / yr
- $511 – $949
Heat risk 4/10 · Minor
- Hot days now (above 98°F)
- 8 days/yr
- Hot days in 30 yrs
- 19 days/yr
Wind risk 2/10 · Minimal
- Chance of severe wind over 30 yrs
- 0.0%
Air-quality risk 4/10 · Minor
- Unhealthy air days now
- 4 days/yr
- Unhealthy air days in 30 yrs
- 5 days/yr
Risk factors via First Street. Map © Google.
Why this score? — see what drove the B grade
The composite is a weighted blend of 9 inputs, each scored 0–100. Each bar is that input's sub-score; the figure is the points it added to the 100-point composite (weight × sub-score).
- Cash flow +30.0/30.0
- 1% rule +10.0/10.0
- DSCR +10.0/10.0
- ARV discount +7.5/15.0
- Livability +4.2/5.0
- Schools +4.1/10.0
- Rent growth +3.8/5.0
- Condition / age +2.5/5.0
- Appreciation +0.0/10.0
$90,000
🖨 Deal sheet (PDF) 📄 Offer letter ✓ Due diligence
Listing remarks
1890 character home offering ~1,900 sq ft above grade plus a full unfinished basement for storage or future potential (basement bath present). Inside you’ll find a generously sized living room and a large eat-in kitchen, along with original charm features including stained-glass windows. The home needs cosmetic updating—multiple rooms will benefit from a full flooring refresh, and the bathrooms retain older finishes. Exterior also needs attention, including repainting for improved curb appeal. Major positives include a roof under 5 years old, an energy-efficient boiler estimated at 6–7 years old, and recent lead-free water service from the street along with newer gas and w
Key facts
- Pellet stove
- 2,613 sq ft lot
- Built 1905
Tags
Neighborhood map
What this means for you Summary
Snapshot
- This is a 3-bed/1.0-bath single-family listed at $90k.
Deal economics
- At list price, monthly cash flow is $1k ($14k/yr) — positive.
- The deal already cash-flows at list — no discount required.
- Meets the 1% rule at list price ($2k rent vs $90k).
Location & tenants
- Location reads 85/100 on livability (#75 in PA, #544 nationally) — a professional / high-income tenant draw. Strengths: commute A+, cost of living A+, housing A+; Watch: employment C-.
- Shaler Area SD (suburban): math 36% / reading 59% proficiency, ranked #208 of 539 in PA (top 39%) — families likely to look elsewhere, expect single-tenant / working-renter base with shorter leases.
- Zoned schools: Shaler Area Hs (math 61% / reading 10%, grade F, #308 of 437 statewide, top 71%, 1,225 students, 36% FRL).
- Zoned-school proficiency averages 36% at this address vs 48% district-wide (-12 pts) — the specific schools serving this property underperform the Shaler Area SD average; the district grade overstates school quality for this exact location.
- Market conditions: Rents rising fast (+5.3%/yr); 27 active listings in the ZIP; 8 comparable units currently listed for rent nearby; rentals at typical pace (median 21d on market — plan ~3-4 weeks tenant-placement turnaround); solid renter incomes; 2,996 units permitted in Allegheny County in 2024 (1,588 in 5+ unit buildings).
- This rent runs 33% of the median local income ($86k/yr) — at the standard rent-burdened threshold; future hikes will face affordability resistance.
Forward outlook
- Local home prices are declining (-3.0%/yr); year-one equity from $622 of loan paydown is wiped out by about $3k of value loss. Plan a longer hold.
- At projected returns (-3.0% appreciation + 5.3% rent growth), your $25k cash investment doubles in ~3 years — after that, you're playing with house money.
Negotiation context
- Only 10 days on market — expect competitive offers; lowballing is unlikely to land.
Risks & watch-outs
- Watch-outs: property tax is 3.2% of price; built in 1905 — expect roof / HVAC / electrical / plumbing capex.
- Climate carrying-cost: major flood risk — expect insurance premiums to compound above CPI over the hold.
Questions for the listing agent
- Built in 1905 — when were the roof, HVAC, electrical panel, plumbing, and water heater last replaced?
- Property tax is high relative to price — has the assessment been appealed recently, and will the sale trigger a re-assessment?
- Is there a deadline driving the sale (1031 exchange, divorce, estate, relocation)? That informs how much negotiation room exists.
- What's the average days-on-market for RENTAL listings here right now (not sales)? A rising rental-DOM trend means longer vacancies and softer asking-rent achievability than the comps imply.
- What's the recent tenant-quality profile in this submarket — average credit score on applications, eviction rate, late-payment / NSF rate, and stable-employment percentage? A property-management company in the area should have these aggregated.
- How much new for-sale + rental construction is in the pipeline within 1–3 miles? Heavy new supply typically softens prices + rents 12–24 months out; constrained supply supports both.
Investment metrics
- 1% rule
- 2.64% ✓
- Cap rate
- 21.33%
- Cash-on-cash
- 53.71%
- DSCR
- 3.39
- GRM
- 3.2
CMA / ARV
- ARV (on-the-fly)
- $251,370
- Comps found
- 9
Show comp detail 9 sales within ~0.75 mi
| Address | Dist | Beds/Ba | Sqft | Sold | Price | $/sf | Match |
|---|---|---|---|---|---|---|---|
| 220 Lindenwood Dr | 0.27mi | 3/2.0 | 1,779 (-6%) | 21mo | $327,900 | $184 | 56 |
| 312 Friday Rd | 0.45mi | 3/1.5 | 1,652 (-13%) | 1mo | $220,000 | $133 | 55 |
| 30 Perry St | 0.70mi | 3/2.0 | 2,016 (+7%) | 1mo | $321,000 | $159 | 52 |
| 518 North Ave | 0.32mi | 3/1.0 | 1,688 (-11%) | 23mo | $161,507 | $96 | 48 |
| 53 Lawrence St | 0.21mi | 4/2.0 (+1) | 1,714 (-9%) | 24mo | $177,000 | $103 | 46 |
| 9 Spring St | 0.69mi | 3/1.0 | 1,750 (-7%) | 16mo | $150,000 | $86 | 42 |
| 410 Stanton Ave | 0.71mi | 3/2.5 | 2,000 (+6%) | 12mo | $260,000 | $130 | 41 |
| 833 Reserve St | 0.71mi | 3/1.5 | 1,632 (-14%) | 8mo | $317,900 | $195 | 36 |
| 841 Stanton Ave | 0.68mi | 3/1.5 | 1,648 (-13%) | 11mo | $235,000 | $143 | 36 |
Match score weights: distance 35% · size 25% · config 20% · recency 20%. Top-matched comps best support the ARV.
Projected returns pro-forma
-3.0% appreciation · 5.31% rent growth · sell at horizon
- IRR
- 54.7%
- Equity multiple
- 3.50×
- Total profit
- $63,019
- Equity at exit
- $13,419
- IRR
- 60.7%
- Equity multiple
- 7.83×
- Total profit
- $172,147
- Equity at exit
- $7,782
Cash invested: $25,200 (down + closing). Projections, not guarantees.
Landlord ↔ Tenant lean methodology
- Overall (STATE)
- 62 Landlord-Friendly
- State Pennsylvania
- 62 Landlord-Friendly · EVEN
- County
- — inherits STATE
- City
- — inherits STATE
ZIP-level market 15209
- Home prices YoY
- -27.7%
- Rents YoY
- 5.3%
- Active inventory
- 27
- Price-to-rent
- 3.2×
Monthly cashflow live
- Estimated rent
- $2,376 high interval (Pro) →
- Mortgage (P&I)
- −$472
- Tax from tax record
- −$239 /mo · $2,871/yr
- Insurance
- −$38
- HOA
- −$0
- Vacancy / Maint / Mgmt
- −$499
- Net cashflow
- $1,128
Break-even live
Sensitivity live
| Price | -10% $1,179 | -5% $1,153 | +0% $1,128 | +5% $1,102 | +10% $1,077 |
|---|---|---|---|---|---|
| Rent | -10% $940 | -5% $1,034 | +0% $1,128 | +5% $1,222 | +10% $1,316 |
| Rate | -1.0pp $1,173 | -0.5pp $1,151 | base $1,128 | +0.5pp $1,105 | +1.0pp $1,081 |
UW: 25.0% down · 7.5% · 30yr · 1.5% tax · 5.0% vac · 8.0% maint · 8.0% mgmt
Financing live
Cash to close
- Down payment
- $22,500
- Closing costs
- $2,700
- Reserves months
- —
- Total cash needed
- —
Loan-product check · same deal, 3 products live
Conventional
25% down · 7.5% · 30yr
- Down + closing
- —
- Monthly P&I
- —
- Monthly cashflow
- —
- DSCR
- —
- Eligible?
- —
Personal DTI + credit; lowest rate.
DSCR
20% down · 8.5% · 30yr
- Down + closing
- —
- Monthly P&I
- —
- Monthly cashflow
- —
- DSCR
- —
- Eligible?
- —
No personal income docs; deal must DSCR.
Hard money
10% down · 12.0% · 12mo
- Down + closing
- —
- Monthly P&I
- —
- Monthly cashflow
- —
- DSCR
- —
- Eligible?
- —
Short-term bridge; refi at stabilization.
Rent comps 8 comps
| Address | Beds | Baths | Sqft | Rent | $/sqft | DOM | Units | Dist |
|---|---|---|---|---|---|---|---|---|
| 404 Reetz St Pittsburgh, PA | 4.0 | 1.0 | 1500 | $2,050 | $1.37 | 17d | 1 | 0.81mi |
| 107 Shoup St #2 Pittsburgh, PA | 2.0 | 1.0 | 2064 | $2,000 | $0.97 | 45d | 1 | 0.89mi |
| 5275 Butler St Pittsburgh, PA | 2.0 | 1.0–2.0 | 885 | $4,076 | $4.61 | 3d | 130 | 1.15mi |
| 5264 Dresden Way Pittsburgh, PA | 2.0 | 2.0 | 1853 | $2,500 | $1.35 | 25d | 1 | 1.20mi |
| 4107 Willow St Pittsburgh, PA | 2.0 | 1.0–2.0 | 917 | $3,334 | $3.63 | 3d | 28 | 1.25mi |
| 160 56th St Pittsburgh, PA | 3.0 | 3.0 | 1737 | $3,900 | $2.25 | 20d | 1 | 1.33mi |
| 17 Cambria Pt Pittsburgh, PA | 3.0 | 4.0 | 1692 | $1,995 | $1.18 | 45d | 1 | 1.33mi |
| 147 39th St Pittsburgh, PA | 3.0 | 1.0–2.0 | 934 | $3,463 | $3.71 | 3d | 44 | 1.40mi |
Listing history 4 events
-
2026-02-28status Pending
-
2026-02-18$90,000 Active
-
2016-08-17soldstatus $302,500
-
2004-10-01soldstatus $58,900
ⓘ Source: listings_history table (triggers on properties + properties_extension) + one-shot
backfill from property_details.listing_events for pre-trigger history.
Tax reassessment forecast PA · Partial reset (capped growth)
- Current annual tax
- $2,871 · $239/mo
- Projected year-2 tax
- $2,871 · $239/mo
- Expected delta
- $0/yr ($0/mo · 0.0%)
ⓘ Screening estimate from a state-policy table — verify with the county assessor before closing.
Climate risk First Street
- Flood 6/10 Major FEMA zone X (unshaded) · 74% chance over 30 yrs
- Wildfire 1/10 Low
- Heat 4/10 Moderate 8 d/yr ≥98°F today · 19 d/yr by 30 yrs out
- Wind 2/10 Low 0% chance of damaging wind over 30 yrs
- Air quality 4/10 Moderate 4 unhealthy d/yr today · 5 by 30 yrs out
Nearby sold comps map
Loading sold comps map…
Walkable amenities ~0.75 mi
Loading nearby amenities…
Taxation est. · year 1
- Rental income
- $28,507
- − Mortgage interest
- −$5,041
- − Property taxes
- −$2,871
- − Insurance
- −$450
- − Repairs & maintenance
- −$2,281
- − Management
- −$2,281
- − Depreciation
- −$2,618
- Taxable income
- $12,965
- Est. tax owed @ 24.0%
- −$3,112
- After-tax cash flow
- $10,424/yr
For passive investors: Depreciation is non-cash, so a rental often shows a tax loss while cash-flowing — sheltering income. Rental losses are passive: they offset passive income freely, and up to $25,000/yr can offset ordinary (W-2) income if you actively participate and your MAGI is under $100k (phasing out to $0 by $150k); unused losses carry forward. On sale, claimed depreciation is recaptured at up to 25%, and gains may owe capital-gains tax (a 1031 exchange can defer both). Figures are a year-1 estimate at your 24.0% rate — not tax advice; consult a CPA.
Schools (NCES district)
- District
- Shaler Area SD
- NCES district ID
- 4221200
- Math proficiency
- 36% ▼ -16.00%
- Reading proficiency
- 59% ▼ -15.00%
- Median HH income
- $57,411
- Composite
- 41.33/100
- National rank
- #3506
- State rank
- #208 of 539 in PA
Livability — Millvale
- Score
- 85/100
- State rank
- #75
- US rank
- #544
Category grades
Schools grade is shown separately in the Schools card above.
Census & demographics
- Census place
- Millvale, PA
- County
- Allegheny County · 1,022,028 people
- Metro
- Pittsburgh, PA
- Population (ZIP)
- 12,328
- Household income
- $85,542
- Rent vs Own
- Severe rent burden
- 356.0
Population outlook (Allegheny County) Hauer SSP2
- Today (2025)
- 1,250,282 people
- By 2030
- 1,256,482 · +0.5%
- By 2040
- 1,256,318 · +0.5%
- By 2050
- 1,244,169 · -0.5%
- By 2075
- 1,197,693 · -4.2%
- By 2100
- 1,093,187 · -12.6%
Race, ethnicity, and origin ACS 2023
- Neighborhood character
- Predominantly White (90%)
- Race & ethnicity
- White 90% Hispanic / Latino 3% Black 3% Two or more races 2% Asian 1%
- Common ancestry
- Romanian 13% Serbian 2% Italian 2%
- Foreign-born
- 3% · Canada
- Languages at home
- 96% English-only · Spanish 2% Other Indo-European 1% Arabic 1%
Political lean MEDSL · Allegheny
- 2024 margin
- Strong D (+20.3) · D 59.7% · R 39.4%
- 2008→2024 swing
- +4.8pp toward D · 2008: 15.5pp · 2024: 20.3pp
- All cycles
- 2024: D+20.3 2020: D+20.4 2016: D+16.4 2012: D+14.4 2008: D+15.5
Not yet ingested
- Civics
- —
Market trends
- HPI YoY
- ▼ -117.81%
- Current HPI
- 307.7796
- Rent YoY
- ▲ 5.31%
- Metro
- Pittsburgh, PA
- State GDP YoY
- ▲ 1.68%
- F500 in state
- 34
Industry mix (Fortune 500 HQ in PA)
| Industry | F500 HQs | Revenue |
|---|---|---|
| Healthcare | 2 | $309B |
|
||
| Insurance | 2 | $27B |
|
||
| Telecommunications / Media | 1 | $124B |
|
||
| Industrial Distribution | 1 | $22B |
|
||
| Financial Services | 1 | $20B |
|
||
| Chemicals / Materials | 1 | $18B |
|
||
Price history
+52.8% since first listed4 events — show timeline
- 2026-02-28 Pending — West Penn MLS
- 2026-02-18 Listed $90,000 West Penn MLS
- 2016-08-17 Sold (Public Records) $302,500 Public Records
- 2004-10-01 Sold (Public Records) $58,900 Public Records
Property tax history
+2.2%/yrLatest (2026): $2,871 · +13.0% YoY. Source: county tax records.
Cash-flow waterfall
monthlySold comps — $/sqft
last 12 mo · ≤1 miLoading sold comps…