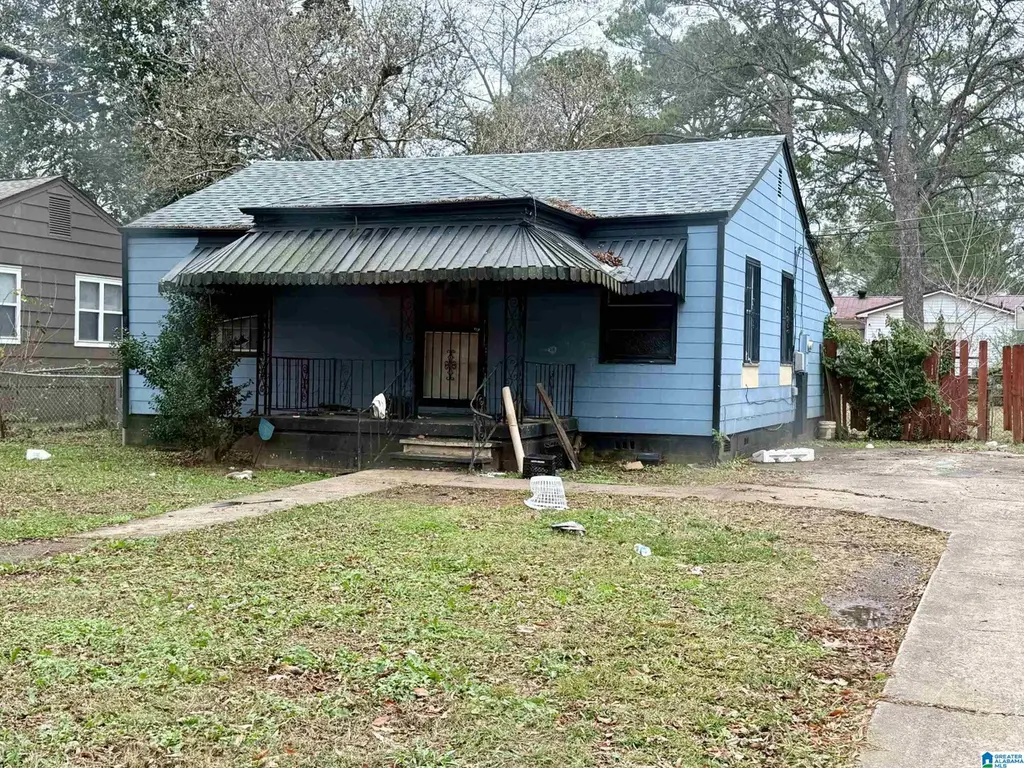
5828 Court Q · Birmingham, AL
Flood risk 1/10 · Minimal
- FEMA flood zone
- X (unshaded)
- Chance of flooding over 30 yrs
- 0.0%
- Est. flood insurance / yr
- $507 – $1,088
Fire risk 1/10 · Minimal
- Est. fire insurance / yr
- $916 – $1,700
Heat risk 6/10 · Moderate
- Hot days now (above 106°F)
- 7 days/yr
- Hot days in 30 yrs
- 18 days/yr
Wind risk 6/10 · Moderate
- Chance of severe wind over 30 yrs
- 27.0%
Air-quality risk 4/10 · Minor
- Unhealthy air days now
- 5 days/yr
- Unhealthy air days in 30 yrs
- 5 days/yr
Risk factors via First Street. Map © Google.
Why this score? — see what drove the B+ grade
The composite is a weighted blend of 9 inputs, each scored 0–100. Each bar is that input's sub-score; the figure is the points it added to the 100-point composite (weight × sub-score).
- Cash flow +30.0/30.0
- ARV discount +15.0/15.0
- 1% rule +10.0/10.0
- DSCR +10.0/10.0
- Livability +3.4/5.0
- Appreciation +2.6/10.0
- Condition / age +2.5/5.0
- Rent growth +2.1/5.0
- Schools +0.9/10.0
$44,900
🖨 Deal sheet (PDF) 📄 Offer letter ✓ Due diligence
Listing remarks MLS
Great opportunity in the Central Park area! This 2-bedroom, 1-bath home is perfect for a first-time buyer or an investor looking for a solid rental property. The layout includes a comfortable living room and a functional kitchen, offering a great starting point for your updates and improvements. Home needs TLC but has potential with its convenient location and level lot. Don’t miss the chance to make this affordable property your next project or investment!
Key facts
- 7,840 sq ft lot
- Built 1952
- Listed 181 days
Neighborhood map
What this means for you Summary
Snapshot
- This is a 2-bed/1.0-bath single-family listed at $45k.
Deal economics
- At list price, monthly cash flow is $405 ($5k/yr) — positive.
- The deal already cash-flows at list — no discount required.
- Meets the 1% rule at list price ($903 rent vs $45k).
- Recommended offer: $40k (12.0% below list) — sets the bar for market timing.
- Cap rate 17.1% vs local median 6.2% in Birmingham — top-decile yield for the area; either an underpriced asset or a hidden risk that comps aren't pricing in. Stress-test before assuming the spread holds.
Location & tenants
- Location reads 67/100 on livability (#78 in AL) — a middle-class / working-renter tenant base. Strengths: commute A+, cost of living A+, housing A+; Watch: amenities C-, schools F, crime F.
- Birmingham City (urban): math 4% / reading 20% proficiency, ranked #116 of 129 in AL (top 90%) — low school quality limits family demand, transient renter base, plan for 1-2y turnover; 82% free/reduced lunch — lower-income household profile, screen leases tightly.
- Market conditions: Rents soft (-1.5%/yr); 88 active listings in the ZIP; 9 comparable units currently listed for rent nearby; rentals lingering (median 45d on market — plan ~5-8 weeks vacancy on turnover, expect pricing pressure); 56% of comp listings sitting > 30 days — soft ceiling on asking rent; 2,114 units permitted in Jefferson County in 2024 (556 in 5+ unit buildings).
Forward outlook
- Local home prices are declining (-3.0%/yr); year-one equity from $310 of loan paydown is wiped out by about $1k of value loss. Plan a longer hold.
- Jefferson County population projected to shrink 4% by 2050 — rents likely to lag national; underwrite the cash flow, not the appreciation.
- At projected returns (-3.0% appreciation + 0.0% rent growth), your $13k cash investment doubles in ~4 years — after that, you're playing with house money.
Negotiation context
- It's been on market 182 days — a 12% lower offer ($40k) is reasonable based on typical stale-listing flexibility.
- Current owner paid $10k; list at $45k implies a 349% gain — meaningful room to come down on a strong offer.
Risks & watch-outs
- Watch-outs: built in 1952 — expect roof / HVAC / electrical / plumbing capex.
- Climate carrying-cost: major wind risk, 27% chance of damaging wind over 30y; extreme-heat days projected 7→18/yr by 2055 (HVAC capex compounding) — expect insurance premiums to compound above CPI over the hold.
Questions for the listing agent
- It's been on market 182 days. Have you received any prior offers? Is the seller open to a 12% concession, seller financing, or rate buy-down credit?
- Built in 1952 — when were the roof, HVAC, electrical panel, plumbing, and water heater last replaced?
- Why hasn't it sold? Are there any deal-killer items the seller is aware of (foundation, flood, title, zoning, code violations)?
- Is there a deadline driving the sale (1031 exchange, divorce, estate, relocation)? That informs how much negotiation room exists.
- Schools are F-rated, which usually means shorter tenancies and higher turnover. Who's the typical renter profile here, and what's been the actual vacancy rate?
- Crime grade is F in this area — have there been break-ins, vandalism, or insurance claims at this property in the last 3 years? What carrier currently insures it and at what premium?
- What's the average days-on-market for RENTAL listings here right now (not sales)? A rising rental-DOM trend means longer vacancies and softer asking-rent achievability than the comps imply.
- What's the recent tenant-quality profile in this submarket — average credit score on applications, eviction rate, late-payment / NSF rate, and stable-employment percentage? A property-management company in the area should have these aggregated.
- How much new for-sale + rental construction is in the pipeline within 1–3 miles? Heavy new supply typically softens prices + rents 12–24 months out; constrained supply supports both.
Investment metrics
- 1% rule
- 2.01% ✓
- Cap rate
- 17.11%
- Cash-on-cash
- 38.64%
- DSCR
- 2.72
- GRM
- 4.1
CMA / ARV
- ARV (median comp)
- $57,664
- List price
- $44,900
- Delta
- -22.13%
- Verdict
- UNDERPRICED
- Comps
- 20 within 1.0 mi
Show comp detail 9 sales within ~0.75 mi
| Address | Dist | Beds/Ba | Sqft | Sold | Price | $/sf | Match |
|---|---|---|---|---|---|---|---|
| 5857 Court Q | 0.08mi | 2/1.0 | 720 (0%) | 10mo | $60,000 | $83 | 88 |
| 1609 34th St SW | 0.55mi | 2/1.0 | 726 (+1%) | 4mo | $20,000 | $28 | 70 |
| 5848 Court Q | 0.05mi | 2/1.0 | 800 (+11%) | 12mo | $45,000 | $56 | 69 |
| 5115 Avenue P | 0.44mi | 2/1.0 | 760 (+6%) | 12mo | $24,900 | $33 | 60 |
| 1437 58th St W | 0.29mi | 2/1.0 | 822 (+14%) | 15mo | $45,000 | $55 | 50 |
| 1759 50th St | 0.50mi | 2/1.0 | 792 (+10%) | 13mo | $70,000 | $88 | 49 |
| 1272 Pineview Rd | 0.55mi | 2/1.0 | 816 (+13%) | 9mo | $60,000 | $74 | 45 |
| 5321 Avenue K | 0.72mi | 2/1.0 | 792 (+10%) | 8mo | $30,100 | $38 | 43 |
| 904 24th St | 0.72mi | 2/1.0 | 783 (+9%) | 20mo | $33,000 | $42 | 35 |
Match score weights: distance 35% · size 25% · config 20% · recency 20%. Top-matched comps best support the ARV.
Projected returns pro-forma
-3.0% appreciation · 0.0% rent growth · sell at horizon
- IRR
- 31.4%
- Equity multiple
- 2.26×
- Total profit
- $15,876
- Equity at exit
- $6,695
- IRR
- 36.8%
- Equity multiple
- 3.93×
- Total profit
- $36,850
- Equity at exit
- $3,882
Cash invested: $12,572 (down + closing). Projections, not guarantees.
Landlord ↔ Tenant lean methodology
- Overall (STATE)
- 90 Strongly Landlord-Friendly
- State Alabama
- 90 Strongly Landlord-Friendly · R+15
- County
- — inherits STATE
- City
- — inherits STATE
ZIP-level market 35228
- Home prices YoY
- -3.5%
- Rents YoY
- -1.5%
- Active inventory
- 88
- Price-to-rent
- 4.1×
Monthly cashflow live
- Estimated rent
- $903 high interval (Pro) →
- Mortgage (P&I)
- −$235
- Tax from tax record
- −$54 /mo · $654/yr
- Insurance
- −$19
- HOA
- −$0
- Vacancy / Maint / Mgmt
- −$190
- Net cashflow
- $405
Break-even live
Sensitivity live
| Price | -10% $430 | -5% $418 | +0% $405 | +5% $392 | +10% $379 |
|---|---|---|---|---|---|
| Rent | -10% $334 | -5% $369 | +0% $405 | +5% $441 | +10% $476 |
| Rate | -1.0pp $427 | -0.5pp $416 | base $405 | +0.5pp $393 | +1.0pp $381 |
UW: 25.0% down · 7.5% · 30yr · 1.5% tax · 5.0% vac · 8.0% maint · 8.0% mgmt
Financing live
Cash to close
- Down payment
- $11,225
- Closing costs
- $1,347
- Reserves months
- —
- Total cash needed
- —
Loan-product check · same deal, 3 products live
Conventional
25% down · 7.5% · 30yr
- Down + closing
- —
- Monthly P&I
- —
- Monthly cashflow
- —
- DSCR
- —
- Eligible?
- —
Personal DTI + credit; lowest rate.
DSCR
20% down · 8.5% · 30yr
- Down + closing
- —
- Monthly P&I
- —
- Monthly cashflow
- —
- DSCR
- —
- Eligible?
- —
No personal income docs; deal must DSCR.
Hard money
10% down · 12.0% · 12mo
- Down + closing
- —
- Monthly P&I
- —
- Monthly cashflow
- —
- DSCR
- —
- Eligible?
- —
Short-term bridge; refi at stabilization.
Rent comps 9 comps
| Address | Beds | Baths | Sqft | Rent | $/sqft | DOM | Units | Dist |
|---|---|---|---|---|---|---|---|---|
| 1012 33rd St SW Birmingham, AL | 1.0–2.0 | 1.0–2.0 | 800 | $750 | $0.94 | 4d | 1 | 0.26mi |
| 5714 Court M Unit 5720 Birmingham, AL | 1.0 | 1.0 | 600 | $700 | $1.17 | 45d | 1 | 0.52mi |
| 1272 Meadow Ln Birmingham, AL | 2.0 | 1.0 | 744 | $800 | $1.08 | 45d | 1 | 0.61mi |
| 5710 Monte Sano Dr Birmingham, AL | 2.0 | 1.0 | 700 | $950 | $1.36 | 45d | 1 | 0.72mi |
| 1045 57th St Birmingham, AL | 1.0 | 1.0 | 700 | $775 | $1.11 | 45d | 1 | 0.75mi |
| 5712 Monte Sano Rd Birmingham, AL | 2.0 | 1.0 | 700 | $900 | $1.29 | 45d | 1 | 0.84mi |
| 2300 31st St SW Unit ENSLEY2316 A Birmingham, AL | 2.0 | 1.0 | 750 | $1,000 | $1.33 | 4d | 1 | 1.10mi |
| 1348 41st Street Ensley Unit B Birmingham, AL | 1.0 | 1.0 | 460 | $723 | $1.57 | 20d | 1 | 1.15mi |
| 1317 Woodward Rd Birmingham, AL | 2.0 | 1.0 | 672 | $800 | $1.19 | 3d | 1 | 1.26mi |
Listing history 13 events
-
2026-06-10days on market $44,900 Active 182 DOM
-
2026-06-09days on market $44,900 Active 181 DOM
-
2026-06-08days on market $44,900 Active 180 DOM
-
2026-06-07days on market $44,900 Active 179 DOM
-
2026-06-03days on market $44,900 Active 175 DOM
-
2026-06-02days on market $44,900 Active 174 DOM
-
2026-06-01days on market $44,900 Active 173 DOM
-
2026-05-31days on market $44,900 Active 172 DOM
-
2025-12-10$44,900 Active 467-char remark
Show marketing remark (467 chars)
Great opportunity in the Central Park area! This 2-bedroom, 1-bath home is perfect for a first-time buyer or an investor looking for a solid rental property. The layout includes a comfortable living room and a functional kitchen, offering a great starting point for your updates and improvements. Home needs TLC but has potential with its convenient location and level lot. Don’t miss the chance to make this affordable property your next project or investment!
-
2011-01-06soldstatus $10,000
-
2008-09-03soldstatus $67,000
-
1999-09-15soldstatus $34,000
-
1999-09-15soldstatus $34,000
ⓘ Source: listings_history table (triggers on properties + properties_extension) + one-shot
backfill from property_details.listing_events for pre-trigger history.
Tax reassessment forecast AL · Resets to sale price
- Current annual tax
- $654 · $54/mo
- Projected year-2 tax
- $654 · $54/mo
- Expected delta
- $0/yr ($0/mo · 0.0%)
ⓘ Screening estimate from a state-policy table — verify with the county assessor before closing.
Climate risk First Street
- Flood 1/10 Low FEMA zone X (unshaded) · 0% chance over 30 yrs
- Wildfire 1/10 Low
- Heat 6/10 Major 7 d/yr ≥106°F today · 18 d/yr by 30 yrs out
- Wind 6/10 Major 27% chance of damaging wind over 30 yrs
- Air quality 4/10 Moderate 5 unhealthy d/yr today · 5 by 30 yrs out
Nearby sold comps map
Loading sold comps map…
Walkable amenities ~0.75 mi
Loading nearby amenities…
Taxation est. · year 1
- Rental income
- $10,838
- − Mortgage interest
- −$2,515
- − Property taxes
- −$654
- − Insurance
- −$224
- − Repairs & maintenance
- −$867
- − Management
- −$867
- − Depreciation
- −$1,306
- Taxable income
- $4,405
- Est. tax owed @ 24.0%
- −$1,057
- After-tax cash flow
- $3,801/yr
For passive investors: Depreciation is non-cash, so a rental often shows a tax loss while cash-flowing — sheltering income. Rental losses are passive: they offset passive income freely, and up to $25,000/yr can offset ordinary (W-2) income if you actively participate and your MAGI is under $100k (phasing out to $0 by $150k); unused losses carry forward. On sale, claimed depreciation is recaptured at up to 25%, and gains may owe capital-gains tax (a 1031 exchange can defer both). Figures are a year-1 estimate at your 24.0% rate — not tax advice; consult a CPA.
Schools (NCES district)
- District
- Birmingham City
- NCES district ID
- 0100390
- Math proficiency
- 4% ▼ -17.00%
- Reading proficiency
- 20% ▼ -4.00%
- Median HH income
- $31,988
- Composite
- 9.49/100
- National rank
- #9850
- State rank
- #116 of 129 in AL
Livability — Birmingham
- Score
- 67/100
- State rank
- #78
- US rank
- #10412
Category grades
Schools grade is shown separately in the Schools card above.
Census & demographics
- Census place
- Birmingham, AL
- County
- Jefferson County · 527,445 people
- City population
- 210,422
- Metro
- Birmingham-Hoover, AL
- Population (ZIP)
- 10,216
- Household income
- $50,815
- Rent vs Own
- Severe rent burden
- 456.0
Population outlook (Jefferson County) Hauer SSP2
- Today (2025)
- 669,185 people
- By 2030
- 669,694 · +0.1%
- By 2040
- 661,388 · -1.2%
- By 2050
- 643,086 · -3.9%
- By 2075
- 577,267 · -13.7%
- By 2100
- 474,758 · -29.1%
Race, ethnicity, and origin ACS 2023
- Neighborhood character
- Predominantly Black (89%)
- Race & ethnicity
- Black 89% Hispanic / Latino 5% Two or more races 5% White 5%
- Foreign-born
- 2% · Canada
- Languages at home
- 95% English-only · Spanish 5%
Political lean MEDSL · Jefferson
- 2024 margin
- D (+10.4) · D 54.6% · R 44.2% · Other 1.2%
- 2008→2024 swing
- +5.4pp toward D · 2008: 5.1pp · 2024: 10.4pp
- All cycles
- 2024: D+10.4 2020: D+13.2 2016: D+7.2 2012: D+6.0 2008: D+5.1
Not yet ingested
- Civics
- —
Market trends
- HPI YoY
- ▼ -4.84%
- Current HPI
- 134.8633
- Rent YoY
- ▼ -1.47%
- Metro
- Birmingham-Hoover, AL
- State GDP YoY
- ▲ 2.94%
- F500 in state
- 4
Industry mix (Fortune 500 HQ in AL)
| Industry | F500 HQs | Revenue |
|---|---|---|
| Financial Services | 1 | $8B |
|
||
| Healthcare | 1 | $5B |
|
||
Price history
+32.1% since first listed5 events — show timeline
- 2025-12-10 Listed $44,900 Greater Alabama MLS
- 2011-01-06 Sold (Public Records) $10,000 Public Records
- 2008-09-03 Sold (Public Records) $67,000 Public Records
- 1999-09-15 Sold (Public Records) $34,000 Public Records
- 1999-09-15 Sold (Public Records) $34,000 Public Records
Property tax history
+0.9%/yrLatest (2025): $654 · +0.0% YoY. Source: county tax records.
Cash-flow waterfall
monthlySold comps — $/sqft
last 12 mo · ≤1 miLoading sold comps…