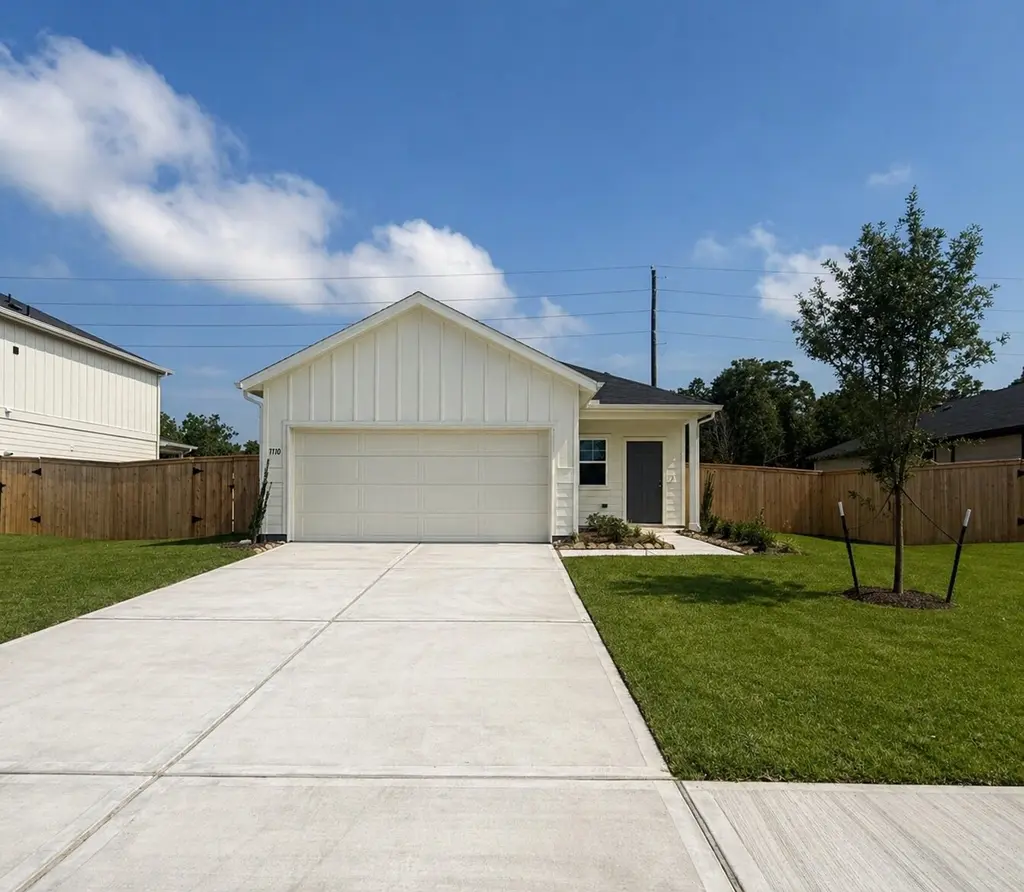
7110 Thomas James Ct · Cove, TX
Flood risk 1/10 · Minimal
- FEMA flood zone
- X (unshaded)
- Chance of flooding over 30 yrs
- 0.0%
- Est. flood insurance / yr
- $507 – $1,088
Fire risk 4/10 · Minor
- Est. fire insurance / yr
- $1,222 – $2,270
Heat risk 9/10 · Severe
- Hot days now (above 111°F)
- 7 days/yr
- Hot days in 30 yrs
- 25 days/yr
Wind risk 9/10 · Severe
- Chance of severe wind over 30 yrs
- 99.0%
Air-quality risk 2/10 · Minimal
- Unhealthy air days now
- 1 days/yr
- Unhealthy air days in 30 yrs
- 1 days/yr
Risk factors via First Street. Map © Google.
Why this score? — see what drove the D+ grade
The composite is a weighted blend of 9 inputs, each scored 0–100. Each bar is that input's sub-score; the figure is the points it added to the 100-point composite (weight × sub-score).
- Cash flow +13.9/30.0
- ARV discount +9.7/15.0
- Schools +6.2/10.0
- 1% rule +4.2/10.0
- DSCR +4.2/10.0
- Condition / age +4.0/5.0
- Rent growth +3.4/5.0
- Livability +3.2/5.0
- Appreciation +0.0/10.0
$280,020
🖨 Deal sheet (PDF) 📄 Offer letter ✓ Due diligence
Listing remarks MLS
This single-story home offers a well-designed layout that blends comfort and functionality. A welcoming foyer leads to a private study, while the open-concept living area flows seamlessly into the kitchen and dining space, featuring a large island and ample counter space. The owner’s suite is tucked at the rear for privacy, complete with a dual-sink bath and walk-in closet. Two additional bedrooms are positioned on the opposite side, along with a full bath and nearby laundry room. A covered patio option extends outdoor living, and a 2-car garage adds everyday convenience, all in a thoughtfully designed single-level home.
Key facts
- 7,500 sq ft lot
- 2 garage spots
- Community pool
Neighborhood map
What this means for you Summary
Snapshot
- This is a 3-bed/2.0-bath single-family listed at $280k. Condition is rated good.
Deal economics
- At list price, monthly cash flow is $30 ($364/yr) — positive.
- The deal already cash-flows at list — no discount required.
- To meet the 1% rule (rent ≥ 1% of price), the offer needs to be $258k (7.8% below list).
- Recommended offer: $258k (7.8% below list) — sets the bar for 1% rule.
- Cap rate 6.4% vs local median 5.3% in Cove — meaningfully above typical; check what's discounted (condition, days-on-market, listing class) to confirm the premium yield is real.
Location & tenants
- Location reads 64/100 on livability (#766 in TX) — a middle-class / working-renter tenant base. Strengths: employment A+, housing A+, crime A; Watch: schools D, amenities F, commute F.
- Barbers Hill ISD (rural): math 72% / reading 65% proficiency, ranked #12 of 826 in TX (top 2%) — acceptable for families but not a draw, mixed tenant base, ~2y average lease.
- Market conditions: Rents rising (+3.4%/yr); 781 active listings in the ZIP; 4 comparable units currently listed for rent nearby; rentals at typical pace (median 26d on market — plan ~3-4 weeks tenant-placement turnaround); high-income renter base; 629 units permitted in Chambers County in 2024 (0 in 5+ unit buildings).
Forward outlook
- Local home prices are declining (-3.0%/yr); year-one equity from $2k of loan paydown is wiped out by about $8k of value loss. Plan a longer hold.
- Chambers County population projected at +46% by 2050 — long-run rental-demand tailwind backs the buy-and-hold thesis.
Negotiation context
- It's been on market 52 days — a 3% lower offer ($272k) is reasonable based on typical stale-listing flexibility.
Risks & watch-outs
- Climate carrying-cost: severe wind risk, 99% chance of damaging wind over 30y; extreme-heat days projected 7→25/yr by 2055 (HVAC capex compounding) — expect insurance premiums to compound above CPI over the hold.
Questions for the listing agent
- It's been on market 52 days. Have you received any prior offers? Is the seller open to a 8% concession, seller financing, or rate buy-down credit?
- What does the HOA fee cover, when was the last increase, and are there any pending special assessments or reserve-fund shortfalls?
- Is there a deadline driving the sale (1031 exchange, divorce, estate, relocation)? That informs how much negotiation room exists.
- Schools are D-rated, which usually means shorter tenancies and higher turnover. Who's the typical renter profile here, and what's been the actual vacancy rate?
- The area grade is low — what's the realistic commute time and amenity access for the typical tenant pool here? Any planned neighborhood developments (good or bad) we should know about?
- What's the average days-on-market for RENTAL listings here right now (not sales)? A rising rental-DOM trend means longer vacancies and softer asking-rent achievability than the comps imply.
- What's the recent tenant-quality profile in this submarket — average credit score on applications, eviction rate, late-payment / NSF rate, and stable-employment percentage? A property-management company in the area should have these aggregated.
- How much new for-sale + rental construction is in the pipeline within 1–3 miles? Heavy new supply typically softens prices + rents 12–24 months out; constrained supply supports both.
Investment metrics
- 1% rule
- 0.92% ✗
- Cap rate
- 6.42%
- Cash-on-cash
- 0.46%
- DSCR
- 1.02
- GRM
- 9.0
CMA / ARV
- ARV (median comp)
- $294,542
- List price
- $280,020
- Delta
- -4.93%
- Verdict
- FAIR
- Comps
- 20 within 1.0 mi
Show comp detail 12 sales within ~0.75 mi
| Address | Dist | Beds/Ba | Sqft | Sold | Price | $/sf | Match |
|---|---|---|---|---|---|---|---|
| 635 Hidden Brook Dr | 0.18mi | 3/2.0 | 1,516 (+0%) | 1mo | $282,000 | $186 | 90 |
| 6830 Bens Lndg | 0.11mi | 3/2.0 | 1,580 (+4%) | 1mo | $274,870 | $174 | 86 |
| 6810 Bens Lndg | 0.31mi | 3/2.0 | 1,512 (0%) | 3mo | $259,140 | $171 | 83 |
| 6922 Bens Lndg | 0.04mi | 4/2.5 (+1) | 1,642 (+9%) | 1mo | $269,180 | $164 | 76 |
| 6707 Alejandro Pl | 0.32mi | 3/2.0 | 1,592 (+5%) | 1mo | $299,100 | $188 | 76 |
| 411 Ruby Ford Dr | 0.35mi | 3/2.0 | 1,408 (-7%) | 1mo | $254,970 | $181 | 72 |
| 6818 Bens Lndg | 0.15mi | 4/2.5 (+1) | 1,642 (+9%) | 1mo | $269,800 | $164 | 71 |
| 14906 Rain Tree Dr | 0.33mi | 3/2.0 | 1,636 (+8%) | 4mo | $299,000 | $183 | 68 |
| 14915 Spring Forest Ln | 0.37mi | 3/2.0 | 1,660 (+10%) | 3mo | $307,000 | $185 | 64 |
| 14503 Sweet Water Dr | 0.74mi | 3/2.0 | 1,516 (+0%) | 3mo | $280,000 | $185 | 63 |
| 6743 Camila St | 0.36mi | 4/2.0 (+1) | 1,682 (+11%) | 2mo | $284,000 | $169 | 57 |
| 14926 Diamond Way | 0.54mi | 4/2.0 (+1) | 1,662 (+10%) | 3mo | $237,000 | $143 | 51 |
Match score weights: distance 35% · size 25% · config 20% · recency 20%. Top-matched comps best support the ARV.
Projected returns pro-forma
-3.0% appreciation · 3.42% rent growth · sell at horizon
- IRR
- -15.0%
- Equity multiple
- 0.46×
- Total profit
- $-42,260
- Equity at exit
- $41,752
- IRR
- -5.7%
- Equity multiple
- 0.62×
- Total profit
- $-29,427
- Equity at exit
- $24,211
Cash invested: $78,406 (down + closing). Projections, not guarantees.
Landlord ↔ Tenant lean methodology
- Overall (STATE)
- 87 Strongly Landlord-Friendly
- State Texas
- 87 Strongly Landlord-Friendly · R+5
- County
- — inherits STATE
- City
- — inherits STATE
ZIP-level market 77523
- Home prices YoY
- -31.5%
- Rents YoY
- 3.4%
- Active inventory
- 781
- Price-to-rent
- 9.0×
Monthly cashflow live
- Estimated rent
- $2,583 medium interval (Pro) →
- Mortgage (P&I)
- −$1,468
- Tax est. 1.5%
- −$350 /mo · $4,200/yr
- Insurance
- −$117
- HOA
- −$75
- Vacancy / Maint / Mgmt
- −$542
- Net cashflow
- $30
Break-even live
Sensitivity live
| Price | -10% $224 | -5% $127 | +0% $30 | +5% $-66 | +10% $-163 |
|---|---|---|---|---|---|
| Rent | -10% $-174 | -5% $-72 | +0% $30 | +5% $132 | +10% $234 |
| Rate | -1.0pp $171 | -0.5pp $102 | base $30 | +0.5pp $-42 | +1.0pp $-116 |
UW: 25.0% down · 7.5% · 30yr · 1.5% tax · 5.0% vac · 8.0% maint · 8.0% mgmt
Financing live
Cash to close
- Down payment
- $70,005
- Closing costs
- $8,401
- Reserves months
- —
- Total cash needed
- —
Loan-product check · same deal, 3 products live
Conventional
25% down · 7.5% · 30yr
- Down + closing
- —
- Monthly P&I
- —
- Monthly cashflow
- —
- DSCR
- —
- Eligible?
- —
Personal DTI + credit; lowest rate.
DSCR
20% down · 8.5% · 30yr
- Down + closing
- —
- Monthly P&I
- —
- Monthly cashflow
- —
- DSCR
- —
- Eligible?
- —
No personal income docs; deal must DSCR.
Hard money
10% down · 12.0% · 12mo
- Down + closing
- —
- Monthly P&I
- —
- Monthly cashflow
- —
- DSCR
- —
- Eligible?
- —
Short-term bridge; refi at stabilization.
Rent comps 4 comps
| Address | Beds | Baths | Sqft | Rent | $/sqft | DOM | Units | Dist |
|---|---|---|---|---|---|---|---|---|
| 14930 Spring Forest Ln Baytown, TX | 4.0 | 2.0 | 1829 | $2,750 | $1.50 | 45d | 1 | 0.30mi |
| 14739 Sweet Water Dr Baytown, TX | 4.0 | 2.0 | 1821 | $2,395 | $1.32 | 3d | 1 | 0.52mi |
| 5815 Littoral Rd Baytown, TX | 3.0 | 2.0 | 1305 | $1,845 | $1.41 | 21d | 1 | 1.24mi |
| 8414 Liberty Sky Rd Baytown, TX | 3.0 | 2.5 | 2046 | $2,095 | $1.02 | 26d | 1 | 1.42mi |
HOA detail
- Monthly dues
- $75 · $900/yr
Listing history 4 events
-
2026-06-02status $280,020 Pending 52 DOM
-
2026-06-01days on market $280,020 Active 52 DOM
-
2026-05-31days on market $280,020 Active 51 DOM
-
2026-04-10$280,020 Active 634-char remark
Show marketing remark (634 chars)
This single-story home offers a well-designed layout that blends comfort and functionality. A welcoming foyer leads to a private study, while the open-concept living area flows seamlessly into the kitchen and dining space, featuring a large island and ample counter space. The owner’s suite is tucked at the rear for privacy, complete with a dual-sink bath and walk-in closet. Two additional bedrooms are positioned on the opposite side, along with a full bath and nearby laundry room. A covered patio option extends outdoor living, and a 2-car garage adds everyday convenience, all in a thoughtfully designed single-level home.
ⓘ Source: listings_history table (triggers on properties + properties_extension) + one-shot
backfill from property_details.listing_events for pre-trigger history.
Climate risk First Street
- Flood 1/10 Low FEMA zone X (unshaded) · 0% chance over 30 yrs
- Wildfire 4/10 Moderate
- Heat 9/10 Extreme 7 d/yr ≥111°F today · 25 d/yr by 30 yrs out
- Wind 9/10 Extreme 99% chance of damaging wind over 30 yrs
- Air quality 2/10 Low 1 unhealthy d/yr today · 1 by 30 yrs out
Nearby sold comps map
Loading sold comps map…
Walkable amenities ~0.75 mi
Loading nearby amenities…
Taxation est. · year 1
- Rental income
- $30,995
- − Mortgage interest
- −$15,685
- − Property taxes
- −$4,200
- − Insurance
- −$1,400
- − Repairs & maintenance
- −$2,480
- − Management
- −$2,480
- − HOA
- −$900
- − Depreciation
- −$8,146
- Taxable loss
- −$4,296
- Est. tax savings @ 24.0%
- +$1,031
- After-tax cash flow
- $1,395/yr
For passive investors: Depreciation is non-cash, so a rental often shows a tax loss while cash-flowing — sheltering income. Rental losses are passive: they offset passive income freely, and up to $25,000/yr can offset ordinary (W-2) income if you actively participate and your MAGI is under $100k (phasing out to $0 by $150k); unused losses carry forward. On sale, claimed depreciation is recaptured at up to 25%, and gains may owe capital-gains tax (a 1031 exchange can defer both). Figures are a year-1 estimate at your 24.0% rate — not tax advice; consult a CPA.
Condition & rehab AI · 7 photos
This single-story home offers a well-designed layout with good condition and minimal repairs needed. It is move-in ready with a good curb appeal and potential for further value enhancement through painting and landscaping.
Value-add opportunities
- Both Painting the exterior and interior walls — Fresh paint enhances curb appeal and interior aesthetics
- Both Landscaping improvements — Enhances curb appeal and adds value
- Both Adding smart home features — Improves convenience and adds modern appeal
Renovation cost estimate screening
Value-add ROI direction
- Both Painting the exterior and interior walls — Fresh paint enhances curb appeal and interior aesthetics ↑
- Both Landscaping improvements — Enhances curb appeal and adds value ↑
- Both Adding smart home features — Improves convenience and adds modern appeal ↑
ⓘ Cost ranges are severity-bucket heuristics (US national rule-of-thumb). Get contractor quotes + a written scope before underwriting a rehab budget.
Schools (NCES district)
- District
- Barbers Hill ISD
- NCES district ID
- 4809450
- Math proficiency
- 72% ▼ -5.00%
- Reading proficiency
- 65% ▼ -1.00%
- Median HH income
- $87,257
- Composite
- 61.73/100
- National rank
- #737
- State rank
- #12 of 826 in TX
Livability — Cove
- Score
- 64/100
- State rank
- #766
- US rank
- #13996
Category grades
Schools grade is shown separately in the Schools card above.
Census & demographics
- County
- Chambers County · 30,186 people
- Metro
- Houston-The Woodlands-Sugar Land, TX
- Population (ZIP)
- 30,186
- Household income
- $124,188
- Rent vs Own
- Severe rent burden
- 549.0
Population outlook (Chambers County) Hauer SSP2
- Today (2025)
- 46,946 people
- By 2030
- 51,094 · +8.8%
- By 2040
- 59,578 · +26.9%
- By 2050
- 68,318 · +45.5%
- By 2075
- 90,485 · +92.7%
- By 2100
- 104,885 · +123.4%
Race, ethnicity, and origin ACS 2023
- Neighborhood character
- Majority White (62%)
- Race & ethnicity
- White 62% Hispanic / Latino 25% Two or more races 11% Black 8% Asian 2%
- Hispanic origin (detail)
- Mexican 22%
- Common ancestry
- Lithuanian 1% Slovak 1% Serbian 1%
- Foreign-born
- 9% · Canada
- Languages at home
- 82% English-only · Spanish 17%
Political lean MEDSL · Chambers
- 2024 margin
- Solid R (+65.6) · D 16.8% · R 82.4%
- 2008→2024 swing
- -14.4pp toward R · 2008: -51.2pp · 2024: -65.6pp
- All cycles
- 2024: R+65.6 2020: R+61.7 2016: R+62.1 2012: R+61.1 2008: R+51.2
Not yet ingested
- Civics
- —
Market trends
- HPI YoY
- ▼ -102.33%
- Current HPI
- 222.6999
- Rent YoY
- ▲ 3.42%
- Metro
- Houston-The Woodlands-Sugar Land, TX
- State GDP YoY
- ▲ 3.95%
- F500 in state
- 110
Industry mix (Fortune 500 HQ in TX)
| Industry | F500 HQs | Revenue |
|---|---|---|
| Energy | 16 | $1,198B |
|
||
| Technology | 5 | $198B |
|
||
| Engineering / Construction | 4 | $72B |
|
||
| Energy Services | 3 | $60B |
|
||
| Utilities | 3 | $41B |
|
||
| Healthcare | 2 | $330B |
|
||
Price history
1 event — show timeline
- 2026-04-10 Listed $280,020 HARMLS
Cash-flow waterfall
monthlySold comps — $/sqft
last 12 mo · ≤1 miLoading sold comps…