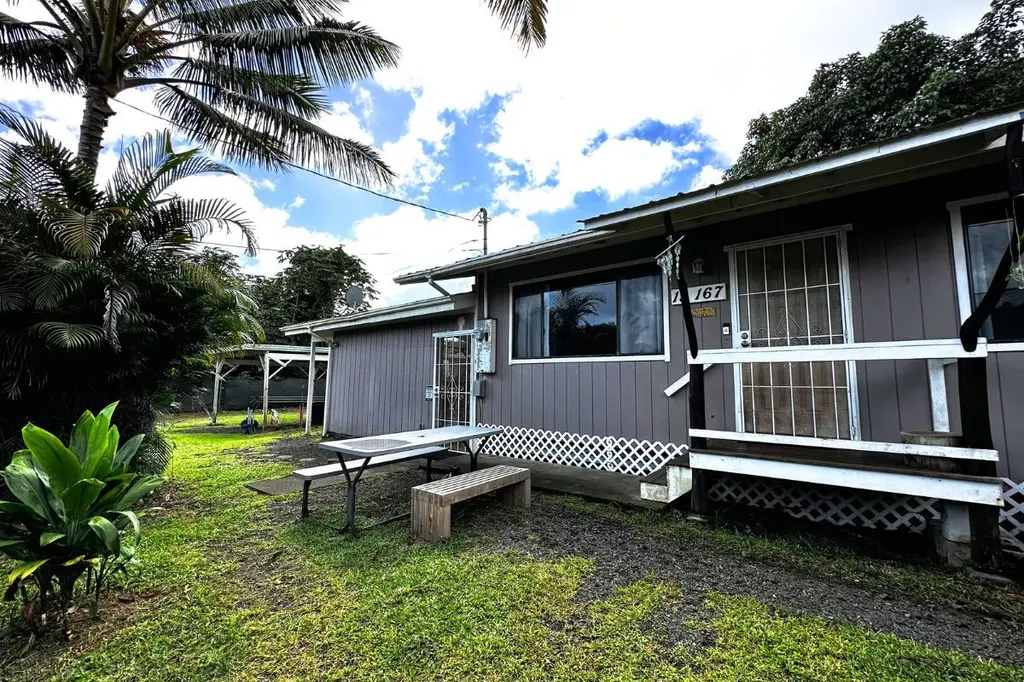
15-167 Puni Paka Loop · Hawaiian Beaches, HI
Flood risk 7/10 · Major
- FEMA flood zone
- X (unshaded)
- Chance of flooding over 30 yrs
- 0.99%
- Est. flood insurance / yr
- $507 – $1,088
Fire risk No data
- Est. fire insurance / yr
- —
Heat risk No data
- Hot days now (above threshold)
- —
- Hot days in 30 yrs
- —
Wind risk No data
- Chance of severe wind over 30 yrs
- —
Air-quality risk 1/10 · Minimal
- Unhealthy air days now
- —
- Unhealthy air days in 30 yrs
- —
Risk factors via First Street. Map © Google.
Why this score? — see what drove the D+ grade
The composite is a weighted blend of 9 inputs, each scored 0–100. Each bar is that input's sub-score; the figure is the points it added to the 100-point composite (weight × sub-score).
- Cash flow +16.5/30.0
- ARV discount +8.3/15.0
- DSCR +5.1/10.0
- 1% rule +3.7/10.0
- Schools +3.7/10.0
- Livability +2.8/5.0
- Rent growth +2.5/5.0
- Condition / age +2.5/5.0
- Appreciation +0.0/10.0
$249,900
🖨 Deal sheet (PDF) 📄 Offer letter ✓ Due diligence
Listing remarks
Bright, beautiful, and move-in ready, this 3-bedroom, 1.5-bath home In Hawaiian Beaches offers comfortable island living on a fully fenced lot that feels exceptionally wide and expansive. The permitted screened-in lanai provides valuable additional living space and includes its own half bath, making it perfect for entertaining, relaxing, or enjoying Hawaii's indoor-outdoor lifestyle. Dwelling serviced by solar hot water to help lower electricity costs. The property features a convenient carport with room for your vehicle & tools. Access is easy with a main gate for driving onto the property, plus a separate pedestrian gate ideal for returning home from a walk or bike ride. An outdoor
Key facts
- Fish pond
- Fire pit
- Outdoor shower
Tags
Property features AI
Finance
- Financial info: Not in use as a short-term vacation rental
Exterior
- Parking: Covered parking
- Utilities: Electricity available; Private water source; Cesspool sewer; County solid waste disposal (no charge)
- Exterior features: Fee simple ownership; Lava zone 2; Zoned A-1A; Paved road access
Interior
- Kitchen: Dishwasher; Oven; Range hood; Refrigerator
- Flooring: Carpet
- Bathrooms: 1 full bathroom; 1 half bathroom
- Interior features: Carpet flooring
Neighborhood map
What this means for you Summary
Snapshot
- This is a 3-bed/2.0-bath single-family listed at $250k.
Deal economics
- At list price, monthly cash flow is $80 ($959/yr) — positive.
- The deal already cash-flows at list — no discount required.
- To meet the 1% rule (rent ≥ 1% of price), the offer needs to be $218k (12.8% below list).
- Recommended offer: $218k (12.8% below list) — sets the bar for 1% rule.
- Cap rate 7.0% vs local median 4.8% in Hawaiian Beaches — top-decile yield for the area; either an underpriced asset or a hidden risk that comps aren't pricing in. Stress-test before assuming the spread holds.
Location & tenants
- Location reads 55/100 on livability (#128 in HI) — a working-class tenant base; expect higher turnover. Strengths: housing B; Watch: health & safety C-, amenities F, commute F.
- Hawaii Department Of Education (suburban): math 32% / reading 50% proficiency, ranked #1 of 1 in HI (top 100%) — families likely to look elsewhere, expect single-tenant / working-renter base with shorter leases.
- Zoned schools: Keonepoko Elementary School (math 8% / reading 24%, grade F, #169 of 183 statewide, top 93%, 562 students, 75% FRL); Pahoa High & Intermediate School (math 17% / reading 42%, grade F, #35 of 43 statewide, top 86%, 723 students, 74% FRL) — zoned schools average 75% FRL vs 39% district-wide (36 pts higher); higher-poverty schools than district average — tighter screening recommended.
- Zoned-school proficiency averages 23% at this address vs 41% district-wide (-18 pts) — the specific schools serving this property underperform the Hawaii Department Of Education average; the district grade overstates school quality for this exact location.
- Market conditions: 387 active listings in the ZIP; 982 units permitted in Hawaii County in 2024 (0 in 5+ unit buildings).
Forward outlook
- Local home prices are declining (-3.0%/yr); year-one equity from $2k of loan paydown is wiped out by about $7k of value loss. Plan a longer hold.
- Hawaii County population projected at +24% by 2050 — long-run rental-demand tailwind backs the buy-and-hold thesis.
Negotiation context
- Only 14 days on market — expect competitive offers; lowballing is unlikely to land.
- 2 sale attempts with the ask held roughly flat each time — persistent listings suggest the price (not the market) is what's stuck; bring a comps-based counter.
- Current owner paid $75k; list at $250k implies a 233% gain — meaningful room to come down on a strong offer.
Risks & watch-outs
- Watch-outs: flood insurance adds $66/mo.
- Climate carrying-cost: major flood risk — expect insurance premiums to compound above CPI over the hold.
Questions for the listing agent
- What's the actual annual flood-insurance premium (NFIP or private), and is the property in a SFHA with mandatory coverage?
- Is there a deadline driving the sale (1031 exchange, divorce, estate, relocation)? That informs how much negotiation room exists.
- Schools are D-rated, which usually means shorter tenancies and higher turnover. Who's the typical renter profile here, and what's been the actual vacancy rate?
- The area grade is low — what's the realistic commute time and amenity access for the typical tenant pool here? Any planned neighborhood developments (good or bad) we should know about?
- What's the average days-on-market for RENTAL listings here right now (not sales)? A rising rental-DOM trend means longer vacancies and softer asking-rent achievability than the comps imply.
- What's the recent tenant-quality profile in this submarket — average credit score on applications, eviction rate, late-payment / NSF rate, and stable-employment percentage? A property-management company in the area should have these aggregated.
- How much new for-sale + rental construction is in the pipeline within 1–3 miles? Heavy new supply typically softens prices + rents 12–24 months out; constrained supply supports both.
Investment metrics
- 1% rule
- 0.87% ✗
- Cap rate
- 7.00%
- Cash-on-cash
- 2.51%
- DSCR
- 1.11
- GRM
- 9.6
CMA / ARV
- ARV (on-the-fly)
- $254,496
- Comps found
- 2
Show comp detail 2 sales within ~0.75 mi
| Address | Dist | Beds/Ba | Sqft | Sold | Price | $/sf | Match |
|---|---|---|---|---|---|---|---|
| 15-174 Puni Paka Loop | 0.04mi | 3/2.0 | 1,056 (0%) | 1mo | $162,000 | $153 | 97 |
| 15-2711 Oio St | 0.41mi | 3/2.0 | 1,056 (0%) | 14mo | $255,000 | $241 | 70 |
Match score weights: distance 35% · size 25% · config 20% · recency 20%. Top-matched comps best support the ARV.
Projected returns pro-forma
-3.0% appreciation · 3.0% rent growth · sell at horizon
- IRR
- -14.1%
- Equity multiple
- 0.49×
- Total profit
- $-35,426
- Equity at exit
- $37,261
- IRR
- -5.4%
- Equity multiple
- 0.65×
- Total profit
- $-24,377
- Equity at exit
- $21,607
Cash invested: $69,972 (down + closing). Projections, not guarantees.
Landlord ↔ Tenant lean methodology
- Overall (STATE)
- 37 Tenant-Leaning
- State Hawaii
- 37 Tenant-Leaning · D+13
- County
- — inherits STATE
- City
- — inherits STATE
ZIP-level market 96778
- Home prices YoY
- -15.3%
- Active inventory
- 387
- Price-to-rent
- 9.6×
Monthly cashflow live
- Estimated rent
- $2,179 medium interval (Pro) →
- Mortgage (P&I)
- −$1,311
- Tax from tax record
- −$160 /mo · $1,923/yr
- Insurance
- −$104
- Flood insurance flood zone
- −$66 /mo · $798/yr
- HOA
- −$0
- Lot rent
- −$0
- Vacancy / Maint / Mgmt
- −$458
- Net cashflow
- $80
Break-even live
Sensitivity live
| Price | -10% $221 | -5% $151 | +0% $80 | +5% $9 | +10% $-62 |
|---|---|---|---|---|---|
| Rent | -10% $-92 | -5% $-6 | +0% $80 | +5% $166 | +10% $252 |
| Rate | -1.0pp $206 | -0.5pp $143 | base $80 | +0.5pp $15 | +1.0pp $-51 |
UW: 25.0% down · 7.5% · 30yr · 1.5% tax · 5.0% vac · 8.0% maint · 8.0% mgmt
Financing live
Cash to close
- Down payment
- $62,475
- Closing costs
- $7,497
- Reserves months
- —
- Total cash needed
- —
Loan-product check · same deal, 3 products live
Conventional
25% down · 7.5% · 30yr
- Down + closing
- —
- Monthly P&I
- —
- Monthly cashflow
- —
- DSCR
- —
- Eligible?
- —
Personal DTI + credit; lowest rate.
DSCR
20% down · 8.5% · 30yr
- Down + closing
- —
- Monthly P&I
- —
- Monthly cashflow
- —
- DSCR
- —
- Eligible?
- —
No personal income docs; deal must DSCR.
Hard money
10% down · 12.0% · 12mo
- Down + closing
- —
- Monthly P&I
- —
- Monthly cashflow
- —
- DSCR
- —
- Eligible?
- —
Short-term bridge; refi at stabilization.
Listing history 11 events
-
2026-06-22days on market $249,900 Active 14 DOM
-
2026-06-21days on market $249,900 Active 13 DOM
-
2026-06-18days on market $249,900 Active 10 DOM
-
2026-06-17days on market $249,900 Active 9 DOM
-
2026-06-16days on market $249,900 Active 8 DOM
-
2026-06-15days on market $249,900 Active 7 DOM
-
2026-06-13days on market $249,900 Active 5 DOM
-
2026-06-13days on market $249,900 Active 4 DOM
-
2026-06-10days on market $249,900 Active 2 DOM
-
2026-06-08remarks 695-char remark
-
2026-06-08$249,900 Active 1 DOM
ⓘ Source: listings_history table (triggers on properties + properties_extension) + one-shot
backfill from property_details.listing_events for pre-trigger history.
Tax reassessment forecast HI · Partial reset (capped growth)
- Current annual tax
- $1,923 · $160/mo
- Projected year-2 tax
- $1,923 · $160/mo
- Expected delta
- $0/yr ($0/mo · 0.0%)
ⓘ Screening estimate from a state-policy table — verify with the county assessor before closing.
Climate risk First Street
- Flood 7/10 Severe FEMA zone X (unshaded) · 99% chance over 30 yrs
- Air quality 1/10 Low
Nearby sold comps map
Loading sold comps map…
Walkable amenities ~0.75 mi
Loading nearby amenities…
Taxation est. · year 1
- Rental income
- $26,145
- − Mortgage interest
- −$13,998
- − Property taxes
- −$1,923
- − Insurance
- −$2,047
- − Repairs & maintenance
- −$2,092
- − Management
- −$2,092
- − Depreciation
- −$7,270
- Taxable loss
- −$3,276
- Est. tax savings @ 24.0%
- +$786
- After-tax cash flow
- $1,745/yr
For passive investors: Depreciation is non-cash, so a rental often shows a tax loss while cash-flowing — sheltering income. Rental losses are passive: they offset passive income freely, and up to $25,000/yr can offset ordinary (W-2) income if you actively participate and your MAGI is under $100k (phasing out to $0 by $150k); unused losses carry forward. On sale, claimed depreciation is recaptured at up to 25%, and gains may owe capital-gains tax (a 1031 exchange can defer both). Figures are a year-1 estimate at your 24.0% rate — not tax advice; consult a CPA.
Schools (NCES district)
- District
- Hawaii Department Of Education
- NCES district ID
- 1500030
- Math proficiency
- 32% ▼ -10.00%
- Reading proficiency
- 50% ▼ -3.00%
- Median HH income
- $69,005
- Composite
- 37.07/100
- National rank
- #4504
- State rank
- #1 of 1 in HI
Livability — Hawaiian Beaches
- Score
- 55/100
- State rank
- #128
- US rank
- #23148
Category grades
Schools grade is shown separately in the Schools card above.
Census & demographics
- Census place
- Hawaiian Beaches, HI
- Population (ZIP)
- 14,225
Population outlook (Hawaii County) Hauer SSP2
- Today (2025)
- 220,733 people
- By 2030
- 232,156 · +5.2%
- By 2040
- 252,486 · +14.4%
- By 2050
- 272,703 · +23.5%
- By 2075
- 332,113 · +50.5%
- By 2100
- 398,342 · +80.5%
Race, ethnicity, and origin ACS 2023
- Neighborhood character
- Highly diverse neighborhood (Simpson 0.82)
- Race & ethnicity
- White 37% Two or more races 30% Hispanic / Latino 15% Pacific Islander 15% Asian 12%
- Hispanic origin (detail)
- Mexican 4% Puerto Rican 9%
- Common ancestry
- Russian 7% Italian 3% Romanian 3%
- Foreign-born
- 12% · Canada, Vietnam
- Languages at home
- 77% English-only · Other Asian/Pacific 11% Tagalog/Filipino 1% Russian/Polish/Slavic 1%
Political lean MEDSL · Hawaii
- 2024 margin
- Strong D (+28.3) · D 63.0% · R 34.7% · Other 2.3%
- 2008→2024 swing
- -25.4pp toward R · 2008: 53.7pp · 2024: 28.3pp
- All cycles
- 2024: D+28.3 2020: D+36.2 2016: D+36.6 2012: D+51.3 2008: D+53.7
Not yet ingested
- Civics
- —
Market trends
- HPI YoY
- ▼ -31.52%
- Current HPI
- 173.8168
- Rent YoY
- —
- Metro
- —
- State GDP YoY
- —
- F500 in state
- 0
Price history
+371.5% since first listed6 events — show timeline
- 2026-06-08 Listed $249,900 HI Information Service
- 2025-11-04 Listing Removed — HI Information Service
- 2025-01-06 Listed $250,000 HI Information Service
- 1991-11-20 Sold (Public Records) $75,000 Public Records
- 1983-06-29 Sold (Public Records) $53,000 Public Records
- 1983-06-01 Sold (Public Records) $53,000 Public Records
Property tax history
+6.2%/yrLatest (2025): $1,923 · +1.2% YoY. Source: county tax records.
Cash-flow waterfall
monthlySold comps — $/sqft
last 12 mo · ≤1 miLoading sold comps…