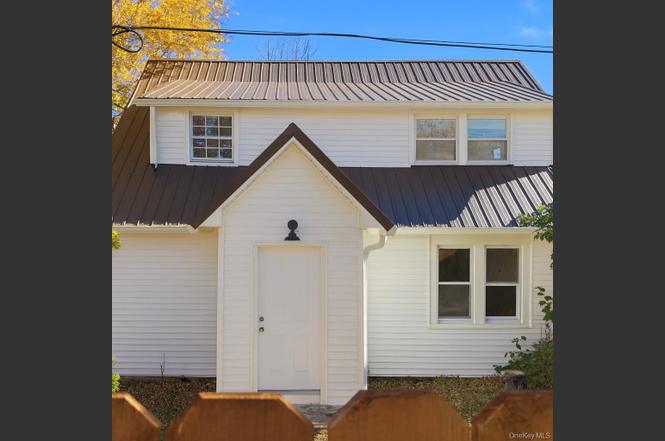
88 Cold Spring Rd · Liberty, NY
Flood risk 1/10 · Minimal
- FEMA flood zone
- X (unshaded)
- Chance of flooding over 30 yrs
- 0.0%
- Est. flood insurance / yr
- $473 – $860
Fire risk 1/10 · Minimal
- Est. fire insurance / yr
- $691 – $1,283
Heat risk 2/10 · Minimal
- Hot days now (above 90°F)
- 7 days/yr
- Hot days in 30 yrs
- 17 days/yr
Wind risk 2/10 · Minimal
- Chance of severe wind over 30 yrs
- 4.0%
Air-quality risk 2/10 · Minimal
- Unhealthy air days now
- 0 days/yr
- Unhealthy air days in 30 yrs
- 1 days/yr
Risk factors via First Street. Map © Google.
Why this score? — see what drove the D+ grade
The composite is a weighted blend of 9 inputs, each scored 0–100. Each bar is that input's sub-score; the figure is the points it added to the 100-point composite (weight × sub-score).
- ARV discount +11.9/15.0
- Appreciation +10.0/10.0
- Cash flow +8.1/30.0
- Livability +3.1/5.0
- 1% rule +2.8/10.0
- Schools +2.8/10.0
- Rent growth +2.5/5.0
- Condition / age +2.5/5.0
- DSCR +2.1/10.0
$299,900
🖨 Deal sheet 📄 Offer letter ✓ Due diligence
Listing remarks
Welcome to 88 Cold Spring Rd, offering a fully renovated, move-in-ready Cape-style home with low property taxes! This property is loaded with quality details, such as recessed lighting with an optional amber halo effect to create a relaxing atmosphere, quartz countertops, matching stainless steel appliances, and soft-close cabinets. It also features a large kitchen island that flows into a formal dining area and living space, complete with a fireplace. Other great perks include the bedroom and full bath on the main level, as well as a fully converted garage space with exposed beams, vaulted ceilings, and sliding doors that step onto a deck (soon to be stained) overlooking the back yard. Mov
Key facts
- Large kitchen island
- Fully renovated
- Quartz countertops
Tags
Property features AI
Exterior
- Parking: Driveway (off-street parking); No carport
- Utilities: Electric service by NYSEG; Septic tank; Utilities: see remarks
- Home design: Single family residence; Updated / remodeled
- Construction: Frame construction
- Exterior features: Frame construction; Not waterfront
Interior
- Kitchen: Dishwasher; Oven; Range; Refrigerator; Kitchen island; Quartz or quartzite counters; Open, galley-style layout; Breakfast bar
- Bedrooms: Includes a first-floor bedroom
- Flooring: Laminate flooring
- Bathrooms: 2 full bathrooms
- Heating & cooling: Baseboard heating; Electric heating; Oil heating; No central cooling
- Interior features: Beamed ceilings; Breakfast bar; Entrance foyer; Formal dining room; Galley-style kitchen; High ceilings; His and hers closets; Kitchen island; Open kitchen; Primary bathroom; Quartz or quartzite counters; Recessed lighting; Storage; Washer/dryer hookup; First-floor bedroom; First-floor full bath
- Laundry & utility: Electric dryer hookup; Laundry located in basement; Washer/dryer hookup
Neighborhood map
What this means for you Summary
Snapshot
- This is a 3-bed/2.0-bath single-family listed at $300k.
Deal economics
- At list price, monthly cash flow is $-295 ($-4k/yr) — negative.
- To cash-flow at today's rent, offer at most $248k (17.4% below list).
- To meet the 1% rule (rent ≥ 1% of price), the offer needs to be $235k (21.6% below list).
- Recommended offer: $235k (21.6% below list) — sets the bar for 1% rule.
- Cap rate 5.1% vs local median 3.8% in Liberty — top-decile yield for the area; either an underpriced asset or a hidden risk that comps aren't pricing in. Stress-test before assuming the spread holds.
Location & tenants
- Location reads 62/100 on livability (#890 in NY) — a middle-class / working-renter tenant base. Strengths: cost of living A+, health & safety A+, housing B+; Watch: crime D+, amenities F, commute F.
- Liberty Central School District (town): math 31% / reading 34% proficiency, ranked #569 of 590 in NY (top 96%) — families likely to look elsewhere, expect single-tenant / working-renter base with shorter leases.
- Zoned schools: Liberty Elementary School (math 27% / reading 42%, grade F, #1,577 of 2,108 statewide, top 77%, 691 students, 64% FRL); Liberty Middle School (math 12% / reading 29%, grade F, #664 of 729 statewide, top 91%, 529 students, 68% FRL); Liberty High School (math 92% / reading 70%, grade A, #495 of 1,100 statewide, top 46%, 596 students, 62% FRL) — zoned schools average 65% FRL vs 48% district-wide (16 pts higher); higher-poverty schools than district average — tighter screening recommended.
- Zoned-school proficiency averages 45% at this address vs 32% district-wide (+13 pts) — the actual schools serving this property are materially stronger than the Liberty Central School District average implies; a family-tenant draw the district grade alone would hide.
- Market conditions: 65 active listings in the ZIP; 1 comparable units currently listed for rent nearby; 739 units permitted in Sullivan County in 2024 (5 in 5+ unit buildings).
Forward outlook
- In year one you build about $32k of equity ($2k loan paydown + $30k appreciation (10.0% local appreciation)).
- Sullivan County population projected at -24% by 2050 — secular population decline; favor cash flow + early exit over multi-decade hold.
- By year 2, paydown + projected appreciation supports a ~$52k cash-out refi (75% LTV) — recoverable capital for the next deal without selling this one.
Negotiation context
- It's been on market 246 days — a 12% lower offer ($264k) is reasonable based on typical stale-listing flexibility.
- Current owner paid $200k; 50% above their basis — modest negotiation headroom, anchor on the comps not their cost.
Risks & watch-outs
- Watch-outs: built in 1940 — expect roof / HVAC / electrical / plumbing capex.
Questions for the listing agent
- What do current leases actually rent for vs. the listed asking? Can we see a recent rent roll and the last 12 months of T-12 income?
- It's been on market 246 days. Have you received any prior offers? Is the seller open to a 22% concession, seller financing, or rate buy-down credit?
- Built in 1940 — when were the roof, HVAC, electrical panel, plumbing, and water heater last replaced?
- Why hasn't it sold? Are there any deal-killer items the seller is aware of (foundation, flood, title, zoning, code violations)?
- Is there a deadline driving the sale (1031 exchange, divorce, estate, relocation)? That informs how much negotiation room exists.
- Crime grade is D in this area — have there been break-ins, vandalism, or insurance claims at this property in the last 3 years? What carrier currently insures it and at what premium?
- The area grade is low — what's the realistic commute time and amenity access for the typical tenant pool here? Any planned neighborhood developments (good or bad) we should know about?
- What's the average days-on-market for RENTAL listings here right now (not sales)? A rising rental-DOM trend means longer vacancies and softer asking-rent achievability than the comps imply.
- What's the recent tenant-quality profile in this submarket — average credit score on applications, eviction rate, late-payment / NSF rate, and stable-employment percentage? A property-management company in the area should have these aggregated.
- How much new for-sale + rental construction is in the pipeline within 1–3 miles? Heavy new supply typically softens prices + rents 12–24 months out; constrained supply supports both.
Investment metrics
- 1% rule
- 0.78% ✗
- Cap rate
- 5.11%
- Cash-on-cash
- -4.22%
- DSCR
- 0.81
- GRM
- 10.6
CMA / ARV
- ARV (on-the-fly)
- $332,748
- Comps found
- 9
Show comp detail 9 sales within ~0.75 mi
| Address | Dist | Beds/Ba | Sqft | Sold | Price | $/sf | Match |
|---|---|---|---|---|---|---|---|
| 13 California | 0.08mi | 3/2.0 | 1,904 (-10%) | 5mo | $300,000 | $158 | 76 |
| 21 Woodland Ave | 0.29mi | 3/2.5 | 1,975 (-6%) | 5mo | $318,000 | $161 | 70 |
| 26 Delaware Ave | 0.37mi | 3/2.5 | 2,224 (+6%) | 14mo | $251,000 | $113 | 59 |
| 39 Winslow Pl | 0.39mi | 2/1.5 (-1) | 1,960 (-7%) | 5mo | $220,000 | $112 | 59 |
| 9 Delaware Ave | 0.40mi | 4/2.5 (+1) | 1,970 (-6%) | 17mo | $312,000 | $158 | 50 |
| 182 Cold Spring Rd | 0.38mi | 4/2.0 (+1) | 2,280 (+8%) | 18mo | $366,000 | $161 | 48 |
| 22 Marion Ave | 0.65mi | 4/1.5 (+1) | 2,228 (+6%) | 6mo | $369,000 | $166 | 48 |
| 55 Delaware Ave | 0.27mi | 4/2.0 (+1) | 2,363 (+12%) | 19mo | $340,000 | $144 | 46 |
| 72 Lincoln Pl | 0.74mi | 4/2.0 (+1) | 1,842 (-12%) | 0mo | $269,000 | $146 | 39 |
Match score weights: distance 35% · size 25% · config 20% · recency 20%. Top-matched comps best support the ARV.
Projected returns pro-forma
10.0% appreciation · 3.0% rent growth · sell at horizon
- IRR
- 21.3%
- Equity multiple
- 2.72×
- Total profit
- $144,610
- Equity at exit
- $270,174
- IRR
- 19.3%
- Equity multiple
- 6.25×
- Total profit
- $440,811
- Equity at exit
- $582,640
Cash invested: $83,972 (down + closing). Projections, not guarantees.
Landlord ↔ Tenant lean methodology
- Overall (STATE)
- 15 Strongly Tenant-Friendly
- State New York
- 15 Strongly Tenant-Friendly · D+10
- County
- — inherits STATE
- City
- — inherits STATE
ZIP-level market 12754
- Home prices YoY
- 28.0%
- Active inventory
- 65
- Price-to-rent
- 10.6×
Monthly cashflow live
- Estimated rent
- $2,350 medium interval (Pro) →
- Mortgage (P&I)
- −$1,573
- Tax from tax record
- −$454 /mo · $5,450/yr
- Insurance
- −$125
- HOA
- −$0
- Vacancy / Maint / Mgmt
- −$494
- Net cashflow
- $-295
Break-even live
UW: 25.0% down · 7.5% · 30yr · 1.5% tax · 5.0% vac · 8.0% maint · 8.0% mgmt
Financing live
Cash to close
- Down payment
- $74,975
- Closing costs
- $8,997
- Reserves months
- —
- Total cash needed
- —
Loan-product check · same deal, 3 products live
Conventional
25% down · 7.5% · 30yr
- Down + closing
- —
- Monthly P&I
- —
- Monthly cashflow
- —
- DSCR
- —
- Eligible?
- —
Personal DTI + credit; lowest rate.
DSCR
20% down · 8.5% · 30yr
- Down + closing
- —
- Monthly P&I
- —
- Monthly cashflow
- —
- DSCR
- —
- Eligible?
- —
No personal income docs; deal must DSCR.
Hard money
10% down · 12.0% · 12mo
- Down + closing
- —
- Monthly P&I
- —
- Monthly cashflow
- —
- DSCR
- —
- Eligible?
- —
Short-term bridge; refi at stabilization.
Rent comps 1 comps
| Address | Beds | Baths | Sqft | Rent | $/sqft | DOM | Units | Dist |
|---|---|---|---|---|---|---|---|---|
| 12 Liberty St Liberty, NY | 4.0 | 2.5 | 2200 | $2,350 | $1.07 | 23d | 1 | 0.48mi |
Listing history 25 events
-
2026-06-18days on market $299,900 Active 246 DOM
-
2026-06-17days on market $299,900 Active 245 DOM
-
2026-06-16days on market $299,900 Active 244 DOM
-
2026-06-15days on market $299,900 Active 243 DOM
-
2026-06-14days on market $299,900 Active 241 DOM
-
2026-06-13days on market $299,900 Active 240 DOM
-
2026-06-10days on market $299,900 Active 238 DOM
-
2026-06-09days on market $299,900 Active 237 DOM
-
2026-06-08days on market $299,900 Active 236 DOM
-
2026-06-07days on market $299,900 Active 235 DOM
-
2026-06-03days on market $299,900 Active 231 DOM
-
2026-06-02days on market $299,900 Active 230 DOM
-
2026-06-01days on market $299,900 Active 229 DOM
-
2026-05-31days on market $299,900 Active 228 DOM
-
2026-05-31days on market $299,900 Active 227 DOM
-
2026-05-15price $299,900
-
2026-04-15price $325,000
-
2026-04-06price $350,000
-
2026-03-02price $399,900
-
2025-12-18price $415,000
-
2025-12-03price $449,900
-
2025-10-29price $469,900
-
2025-10-15$499,900 Active
-
2025-02-25soldstatus $200,000
-
1995-08-31soldstatus $40,000
ⓘ Source: listings_history table (triggers on properties + properties_extension) + one-shot
backfill from property_details.listing_events for pre-trigger history.
Tax reassessment forecast NY · Partial reset (capped growth)
- Current annual tax
- $5,450 · $454/mo
- Projected year-2 tax
- $5,450 · $454/mo
- Expected delta
- $0/yr ($0/mo · 0.0%)
ⓘ Screening estimate from a state-policy table — verify with the county assessor before closing.
Climate risk First Street
- Flood 1/10 Low FEMA zone X (unshaded) · 0% chance over 30 yrs
- Wildfire 1/10 Low
- Heat 2/10 Low 7 d/yr ≥90°F today · 17 d/yr by 30 yrs out
- Wind 2/10 Low 4% chance of damaging wind over 30 yrs
- Air quality 2/10 Low 0 unhealthy d/yr today · 1 by 30 yrs out
Nearby sold comps map
Loading sold comps map…
Walkable amenities ~0.75 mi
Loading nearby amenities…
Taxation est. · year 1
- Rental income
- $28,200
- − Mortgage interest
- −$16,799
- − Property taxes
- −$5,450
- − Insurance
- −$1,500
- − Repairs & maintenance
- −$2,256
- − Management
- −$2,256
- − Depreciation
- −$8,724
- Taxable loss
- −$8,784
- Est. tax savings @ 24.0%
- +$2,108
- After-tax cash flow
- $-1,435/yr
For passive investors: Depreciation is non-cash, so a rental often shows a tax loss while cash-flowing — sheltering income. Rental losses are passive: they offset passive income freely, and up to $25,000/yr can offset ordinary (W-2) income if you actively participate and your MAGI is under $100k (phasing out to $0 by $150k); unused losses carry forward. On sale, claimed depreciation is recaptured at up to 25%, and gains may owe capital-gains tax (a 1031 exchange can defer both). Figures are a year-1 estimate at your 24.0% rate — not tax advice; consult a CPA.
Schools (NCES district)
- District
- Liberty Central School District
- NCES district ID
- 3617220
- Math proficiency
- 31% ▼ -8.00%
- Reading proficiency
- 34% ▼ -4.00%
- Median HH income
- $43,542
- Composite
- 27.65/100
- National rank
- #6920
- State rank
- #569 of 590 in NY
Livability — Liberty
- Score
- 62/100
- State rank
- #890
- US rank
- #17254
Category grades
Schools grade is shown separately in the Schools card above.
Census & demographics
- City population
- 8,525
- Population (ZIP)
- 8,525
Population outlook (Sullivan County) Hauer SSP2
- Today (2025)
- 68,974 people
- By 2030
- 65,609 · -4.9%
- By 2040
- 58,878 · -14.6%
- By 2050
- 52,500 · -23.9%
- By 2075
- 39,941 · -42.1%
- By 2100
- 28,880 · -58.1%
Race, ethnicity, and origin ACS 2023
- Neighborhood character
- Diverse neighborhood (Simpson 0.56)
- Race & ethnicity
- White 56% Hispanic / Latino 36% Two or more races 8% Black 4% Asian 2% Native American 1%
- Hispanic origin (detail)
- Mexican 3% Puerto Rican 7% Dominican 2%
- Common ancestry
- Romanian 3% Lithuanian 2% Scotch-Irish 1%
- Foreign-born
- 22% · Canada, Dominican Republic, Jamaica
- Languages at home
- 71% English-only · Spanish 25% Other Indo-European 2% French/Haitian/Cajun 1%
Political lean MEDSL · Sullivan
- 2024 margin
- R (+16.7) · D 41.6% · R 58.4%
- 2008→2024 swing
- -26.2pp toward R · 2008: 9.5pp · 2024: -16.7pp
- All cycles
- 2024: R+16.7 2020: R+9.2 2016: R+13.7 2012: D+10.4 2008: D+9.5
Not yet ingested
- Civics
- —
Market trends
- HPI YoY
- ▲ 100.10%
- Current HPI
- 457.3342
- Rent YoY
- —
- Metro
- —
- State GDP YoY
- ▲ 2.60%
- F500 in state
- 92
Industry mix (Fortune 500 HQ in NY)
| Industry | F500 HQs | Revenue |
|---|---|---|
| Financial Services | 10 | $950B |
|
||
| Consumer Goods | 9 | $162B |
|
||
| Insurance | 4 | $225B |
|
||
| Telecommunications | 2 | $144B |
|
||
| Pharmaceuticals | 2 | $112B |
|
||
| Media / Entertainment | 2 | $69B |
|
||
Price history
+649.8% since first listed10 events — show timeline
- 2026-05-15 Price Changed $299,900 OneKey® MLS as Distributed by MLS Grid
- 2026-04-15 Price Changed $325,000 OneKey® MLS as Distributed by MLS Grid
- 2026-04-06 Price Changed $350,000 OneKey® MLS as Distributed by MLS Grid
- 2026-03-02 Price Changed $399,900 OneKey® MLS as Distributed by MLS Grid
- 2025-12-18 Price Changed $415,000 OneKey® MLS as Distributed by MLS Grid
- 2025-12-03 Price Changed $449,900 OneKey® MLS as Distributed by MLS Grid
- 2025-10-29 Price Changed $469,900 OneKey® MLS as Distributed by MLS Grid
- 2025-10-15 Listed $499,900 OneKey® MLS as Distributed by MLS Grid
- 2025-02-25 Sold (Public Records) $200,000 Public Records
- 1995-08-31 Sold (Public Records) $40,000 Public Records
Property tax history
+1.1%/yrLatest (2025): $5,450 · +1.2% YoY. Source: county tax records.
Cash-flow waterfall
monthlySold comps — $/sqft
last 12 mo · ≤1 miLoading sold comps…