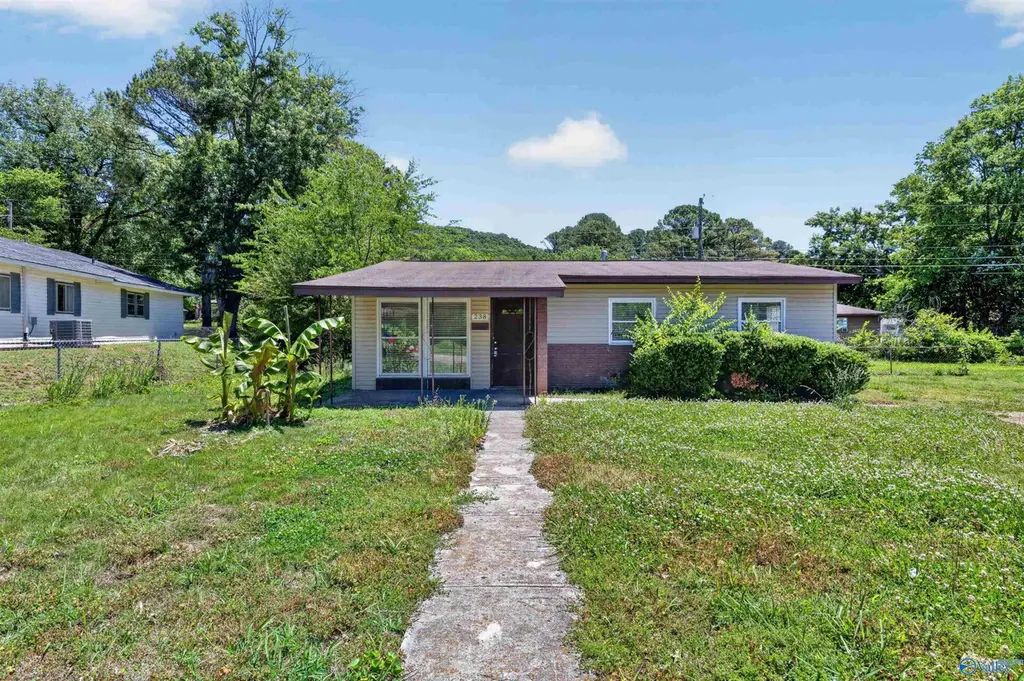
238 Victory Ln NE · Huntsville, AL
Flood risk 1/10 · Minimal
- FEMA flood zone
- X (unshaded)
- Chance of flooding over 30 yrs
- 0.0%
- Est. flood insurance / yr
- $507 – $1,088
Fire risk 2/10 · Minimal
- Est. fire insurance / yr
- $916 – $1,700
Heat risk 5/10 · Moderate
- Hot days now (above 104°F)
- 7 days/yr
- Hot days in 30 yrs
- 19 days/yr
Wind risk 4/10 · Minor
- Chance of severe wind over 30 yrs
- 14.0%
Air-quality risk 2/10 · Minimal
- Unhealthy air days now
- 1 days/yr
- Unhealthy air days in 30 yrs
- 1 days/yr
Risk factors via First Street. Map © Google.
Why this score? — see what drove the B grade
The composite is a weighted blend of 9 inputs, each scored 0–100. Each bar is that input's sub-score; the figure is the points it added to the 100-point composite (weight × sub-score).
- Cash flow +27.9/30.0
- ARV discount +11.2/15.0
- DSCR +9.9/10.0
- 1% rule +6.5/10.0
- Rent growth +4.2/5.0
- Livability +4.1/5.0
- Schools +2.9/10.0
- Condition / age +2.5/5.0
- Appreciation +1.4/10.0
$144,900
🖨 Deal sheet 📄 Offer letter ✓ Due diligence
Listing remarks MLS
Great starter home or investment property. House is being Sold AS IS, house needs some TLC. NO SHOWINGS SAT-SUN, JUNE 19TH-20TH
Key facts
- Spacious backyard
- Level lot
- Northeast huntsville
Tags
Property features AI
Finance
- HOA & community: No homeowners association; Subdivision: Edmonton Heights
Exterior
- Parking: No designated parking
- Utilities: Public sewer
- Home design: Single-family residence; Built in 1959; Living area about 1,100; Vinyl siding
- Construction: Slab foundation
- Exterior features: Public water; Lot approximately 0.22 acres (68 x 115 x 100 x 130)
Interior
- Kitchen: Range
- Bathrooms: 1 full bathroom
- Heating & cooling: Central heating; Central cooling
- Interior features: Total of 4 rooms; One-level living
Neighborhood map
What this means for you Summary
Snapshot
- This is a 4-bed/1.0-bath single-family listed at $145k.
Deal economics
- At list price, monthly cash flow is $446 ($5k/yr) — positive.
- The deal already cash-flows at list — no discount required.
- Meets the 1% rule at list price ($2k rent vs $145k).
- Recommended offer: $141k (3.0% below list) — sets the bar for market timing.
- Cap rate 10.0% vs local median 3.8% in Huntsville — top-decile yield for the area; either an underpriced asset or a hidden risk that comps aren't pricing in. Stress-test before assuming the spread holds.
Location & tenants
- Location reads 82/100 on livability (#3 in AL, #1,082 nationally) — a professional / high-income tenant draw. Strengths: commute A+, cost of living A+, housing A+; Watch: crime F.
- Huntsville City (urban): math 21% / reading 46% proficiency, ranked #48 of 129 in AL (top 37%) — families likely to look elsewhere, expect single-tenant / working-renter base with shorter leases.
- Zoned schools: Martin Luther King Jr Elementary School (math 4% / reading 18%, grade F, #560 of 627 statewide, top 90%, 464 students, 89% FRL); Huntsville Junior High School (math 20% / reading 45%, grade F, #105 of 257 statewide, top 42%, 418 students, 38% FRL); Lee High School (math 2% / reading 17%, grade F, #252 of 305 statewide, top 84%, 840 students, 77% FRL) — zoned schools average 68% FRL vs 46% district-wide (22 pts higher); higher-poverty schools than district average — tighter screening recommended.
- Zoned-school proficiency averages 18% at this address vs 34% district-wide (-16 pts) — the specific schools serving this property underperform the Huntsville City average; the district grade overstates school quality for this exact location.
- Market conditions: Rents rising fast (+6.8%/yr); 560 active listings in the ZIP; 13 comparable units currently listed for rent nearby; rentals lingering (median 44d on market — plan ~5-8 weeks vacancy on turnover, expect pricing pressure); 62% of comp listings sitting > 30 days — soft ceiling on asking rent; solid renter incomes; 4,709 units permitted in Madison County in 2024 (1,186 in 5+ unit buildings).
Forward outlook
- Local home prices are declining (-3.0%/yr); year-one equity from $1k of loan paydown is wiped out by about $4k of value loss. Plan a longer hold.
- Madison County population projected at +18% by 2050 — long-run rental-demand tailwind backs the buy-and-hold thesis.
- At projected returns (-3.0% appreciation + 6.8% rent growth), your $41k cash investment doubles in ~7 years — after that, you're playing with house money.
Negotiation context
- It's been on market 36 days — a 3% lower offer ($141k) is reasonable based on typical stale-listing flexibility.
- 2 sale attempts since 5y ago with the ask held roughly flat each time — persistent listings suggest the price (not the market) is what's stuck; bring a comps-based counter.
Risks & watch-outs
- Watch-outs: built in 1959 — expect roof / HVAC / electrical / plumbing capex.
- Climate carrying-cost: extreme-heat days projected 7→19/yr by 2055 (HVAC capex compounding) — expect insurance premiums to compound above CPI over the hold.
Questions for the listing agent
- It's been on market 36 days. Have you received any prior offers? Is the seller open to a 3% concession, seller financing, or rate buy-down credit?
- Built in 1959 — when were the roof, HVAC, electrical panel, plumbing, and water heater last replaced?
- Is there a deadline driving the sale (1031 exchange, divorce, estate, relocation)? That informs how much negotiation room exists.
- Crime grade is F in this area — have there been break-ins, vandalism, or insurance claims at this property in the last 3 years? What carrier currently insures it and at what premium?
- What's the average days-on-market for RENTAL listings here right now (not sales)? A rising rental-DOM trend means longer vacancies and softer asking-rent achievability than the comps imply.
- What's the recent tenant-quality profile in this submarket — average credit score on applications, eviction rate, late-payment / NSF rate, and stable-employment percentage? A property-management company in the area should have these aggregated.
- How much new for-sale + rental construction is in the pipeline within 1–3 miles? Heavy new supply typically softens prices + rents 12–24 months out; constrained supply supports both.
Investment metrics
- 1% rule
- 1.15% ✓
- Cap rate
- 9.99%
- Cash-on-cash
- 13.19%
- DSCR
- 1.59
- GRM
- 7.3
CMA / ARV
- ARV (median comp)
- $157,833
- List price
- $144,900
- Delta
- -8.19%
- Verdict
- FAIR
- Comps
- 20 within 1.0 mi
Show comp detail 7 sales within ~0.75 mi
| Address | Dist | Beds/Ba | Sqft | Sold | Price | $/sf | Match |
|---|---|---|---|---|---|---|---|
| 3820 Colton Ln | 0.08mi | 4/1.5 | 1,098 (+6%) | 12mo | $170,000 | $155 | 73 |
| 3807 Melody Rd NE | 0.04mi | 3/1.0 (-1) | 920 (-11%) | 3mo | $151,000 | $164 | 73 |
| 112 Wilkenson Dr NE | 0.37mi | 3/1.0 (-1) | 1,023 (-1%) | 7mo | $155,000 | $152 | 70 |
| 203 Victory Ln NE | 0.20mi | 3/1.0 (-1) | 925 (-10%) | 8mo | $166,000 | $179 | 62 |
| 3803 Melody Rd NE | 0.05mi | 3/1.0 (-1) | 931 (-10%) | 20mo | $162,900 | $175 | 60 |
| 3815 Colton Ln NE | 0.10mi | 3/1.0 (-1) | 900 (-13%) | 21mo | $179,900 | $200 | 52 |
| 172 Wilkenson Dr NE | 0.28mi | 3/1.0 (-1) | 884 (-14%) | 20mo | $145,000 | $164 | 41 |
Match score weights: distance 35% · size 25% · config 20% · recency 20%. Top-matched comps best support the ARV.
Projected returns pro-forma
-3.0% appreciation · 6.81% rent growth · sell at horizon
- IRR
- 7.0%
- Equity multiple
- 1.28×
- Total profit
- $11,485
- Equity at exit
- $21,605
- IRR
- 19.2%
- Equity multiple
- 2.87×
- Total profit
- $75,697
- Equity at exit
- $12,528
Cash invested: $40,572 (down + closing). Projections, not guarantees.
Landlord ↔ Tenant lean methodology
- Overall (STATE)
- 90 Strongly Landlord-Friendly
- State Alabama
- 90 Strongly Landlord-Friendly · R+15
- County
- — inherits STATE
- City
- — inherits STATE
ZIP-level market 35811
- Home prices YoY
- -2.1%
- Rents YoY
- 6.8%
- Active inventory
- 560
- Price-to-rent
- 7.3×
Monthly cashflow live
- Estimated rent
- $1,661 high interval (Pro) →
- Mortgage (P&I)
- −$760
- Tax from tax record
- −$46 /mo · $551/yr
- Insurance
- −$60
- HOA
- −$0
- Vacancy / Maint / Mgmt
- −$349
- Net cashflow
- $446
Break-even live
UW: 25.0% down · 7.5% · 30yr · 1.5% tax · 5.0% vac · 8.0% maint · 8.0% mgmt
Financing live
Cash to close
- Down payment
- $36,225
- Closing costs
- $4,347
- Reserves months
- —
- Total cash needed
- —
Loan-product check · same deal, 3 products live
Conventional
25% down · 7.5% · 30yr
- Down + closing
- —
- Monthly P&I
- —
- Monthly cashflow
- —
- DSCR
- —
- Eligible?
- —
Personal DTI + credit; lowest rate.
DSCR
20% down · 8.5% · 30yr
- Down + closing
- —
- Monthly P&I
- —
- Monthly cashflow
- —
- DSCR
- —
- Eligible?
- —
No personal income docs; deal must DSCR.
Hard money
10% down · 12.0% · 12mo
- Down + closing
- —
- Monthly P&I
- —
- Monthly cashflow
- —
- DSCR
- —
- Eligible?
- —
Short-term bridge; refi at stabilization.
Rent comps 13 comps
| Address | Beds | Baths | Sqft | Rent | $/sqft | DOM | Units | Dist |
|---|---|---|---|---|---|---|---|---|
| 4130 High Mountain Rd NE Huntsville, AL | 1.0–3.0 | 1.0–2.0 | 1119 | $2,061 | $1.84 | 43d | 129 | 1.00mi |
| 3606 Lakewood Rd NW Huntsville, AL | 3.0 | 1.5 | 1408 | $1,400 | $0.99 | 43d | 1 | 1.10mi |
| 4005 Memorial Pkwy NW Huntsville, AL | 3.0 | 1.0 | 1100 | $1,375 | $1.25 | 43d | 1 | 1.13mi |
| 3707 Lakewood Dr NW Huntsville, AL | 3.0 | 1.0 | 1100 | $1,100 | $1.00 | 43d | 1 | 1.14mi |
| 2113 Norris Rd NW Huntsville, AL | 3.0 | 1.0 | 1372 | $1,550 | $1.13 | 43d | 1 | 1.30mi |
| 2117 Griffith Dr NW Huntsville, AL | 3.0 | 1.0 | 1000 | $1,095 | $1.09 | 23d | 1 | 1.32mi |
| 611 Ofallon Rd NW Huntsville, AL | 3.0 | 2.0 | 1350 | $3,000 | $2.22 | 23d | 1 | 1.38mi |
| 2117 Atkins Dr NW Huntsville, AL | 3.0 | 2.0 | 1250 | $1,699 | $1.36 | 23d | 1 | 1.41mi |
| 621 Murray Rd NW Huntsville, AL | 3.0 | 1.5 | 1008 | $1,325 | $1.31 | 13d | 1 | 1.43mi |
| 3058 Boswell Dr NW Huntsville, AL | 4.0 | 2.0 | 1450 | $1,398 | $0.96 | 43d | 1 | 1.44mi |
| 2206 Harris Rd NW Huntsville, AL | 3.0 | 1.0 | 1354 | $1,400 | $1.03 | 43d | 1 | 1.44mi |
| 522 Lisa Ln NW Huntsville, AL | 4.0 | 3.0 | 1025 | $1,695 | $1.65 | 43d | 1 | 1.46mi |
| 2207 Norwood Dr NW Huntsville, AL | 3.0 | 1.0 | 1020 | $1,295 | $1.27 | 13d | 1 | 1.49mi |
Listing history 22 events
-
2026-06-18days on market $144,900 Active 36 DOM
-
2026-06-17days on market $144,900 Active 35 DOM
-
2026-06-16days on market $144,900 Active 34 DOM
-
2026-06-15days on market $144,900 Active 33 DOM
-
2026-06-14pricedays on market $144,900 Active 31 DOM
-
2026-06-10days on market $149,900 Active 28 DOM
-
2026-06-09days on market $149,900 Active 27 DOM
-
2026-06-08days on market $149,900 Active 26 DOM
-
2026-06-07days on market $149,900 Active 25 DOM
-
2026-06-03days on market $149,900 Active 21 DOM
-
2026-06-02days on market $149,900 Active 20 DOM
-
2026-06-01days on market $149,900 Active 19 DOM
-
2026-05-31days on market $149,900 Active 18 DOM
-
2026-05-30days on market $149,900 Active 17 DOM
-
2026-05-13$149,900 Active 538-char remark
-
2023-12-08soldstatus $2,040,000
-
2022-02-03soldstatus $85,000
-
2022-01-19soldstatus $85,000 Sold 128-char remark
Show marketing remark (128 chars)
Great starter home or investment property. House is being Sold AS IS, house needs some TLC. NO SHOWINGS SAT-SUN, JUNE 19TH-20TH
-
2021-07-24status Pending 128-char remark
Show marketing remark (128 chars)
Great starter home or investment property. House is being Sold AS IS, house needs some TLC. NO SHOWINGS SAT-SUN, JUNE 19TH-20TH
-
2021-07-09historical Contingent 128-char remark
Show marketing remark (128 chars)
Great starter home or investment property. House is being Sold AS IS, house needs some TLC. NO SHOWINGS SAT-SUN, JUNE 19TH-20TH
-
2021-06-28price $89,900 128-char remark
Show marketing remark (128 chars)
Great starter home or investment property. House is being Sold AS IS, house needs some TLC. NO SHOWINGS SAT-SUN, JUNE 19TH-20TH
-
2021-06-11$99,900 Active 128-char remark
Show marketing remark (128 chars)
Great starter home or investment property. House is being Sold AS IS, house needs some TLC. NO SHOWINGS SAT-SUN, JUNE 19TH-20TH
ⓘ Source: listings_history table (triggers on properties + properties_extension) + one-shot
backfill from property_details.listing_events for pre-trigger history.
Tax reassessment forecast AL · Resets to sale price
- Current annual tax
- $551 · $46/mo
- Projected year-2 tax
- $594 · $50/mo
- Expected delta
- +$43/yr (+$4/mo · 7.8%)
ⓘ Screening estimate from a state-policy table — verify with the county assessor before closing.
Climate risk First Street
- Flood 1/10 Low FEMA zone X (unshaded) · 0% chance over 30 yrs
- Wildfire 2/10 Low
- Heat 5/10 Major 7 d/yr ≥104°F today · 19 d/yr by 30 yrs out
- Wind 4/10 Moderate 14% chance of damaging wind over 30 yrs
- Air quality 2/10 Low 1 unhealthy d/yr today · 1 by 30 yrs out
Nearby sold comps map
Loading sold comps map…
Walkable amenities ~0.75 mi
Loading nearby amenities…
Taxation est. · year 1
- Rental income
- $19,933
- − Mortgage interest
- −$8,117
- − Property taxes
- −$551
- − Insurance
- −$724
- − Repairs & maintenance
- −$1,595
- − Management
- −$1,595
- − Depreciation
- −$4,215
- Taxable income
- $3,136
- Est. tax owed @ 24.0%
- −$753
- After-tax cash flow
- $4,600/yr
For passive investors: Depreciation is non-cash, so a rental often shows a tax loss while cash-flowing — sheltering income. Rental losses are passive: they offset passive income freely, and up to $25,000/yr can offset ordinary (W-2) income if you actively participate and your MAGI is under $100k (phasing out to $0 by $150k); unused losses carry forward. On sale, claimed depreciation is recaptured at up to 25%, and gains may owe capital-gains tax (a 1031 exchange can defer both). Figures are a year-1 estimate at your 24.0% rate — not tax advice; consult a CPA.
Schools (NCES district)
- District
- Huntsville City
- NCES district ID
- 0101800
- Math proficiency
- 21% ▼ -23.00%
- Reading proficiency
- 46% ▬ 0.00%
- Median HH income
- $48,264
- Composite
- 28.84/100
- National rank
- #6647
- State rank
- #48 of 129 in AL
Livability — Huntsville
- Score
- 82/100
- State rank
- #3
- US rank
- #1082
Category grades
Schools grade is shown separately in the Schools card above.
Census & demographics
- Census place
- Huntsville, AL
- County
- Madison County · 380,832 people
- City population
- 220,435
- Metro
- Huntsville, AL
- Population (ZIP)
- 31,008
- Household income
- $90,812
- Rent vs Own
- Severe rent burden
- 517.0
Population outlook (Madison County) Hauer SSP2
- Today (2025)
- 392,086 people
- By 2030
- 409,788 · +4.5%
- By 2040
- 440,557 · +12.4%
- By 2050
- 460,990 · +17.6%
- By 2075
- 502,872 · +28.3%
- By 2100
- 513,623 · +31.0%
Race, ethnicity, and origin ACS 2023
- Neighborhood character
- Majority White (64%)
- Race & ethnicity
- White 64% Black 27% Two or more races 5% Hispanic / Latino 3% Asian 2%
- Common ancestry
- Slovak 2% Italian 2% Serbian 2%
- Foreign-born
- 4% · Canada, Vietnam, China
- Languages at home
- 95% English-only · Spanish 3% Vietnamese 1%
Political lean MEDSL · Madison
- 2024 margin
- Lean R (+9.0) · D 44.7% · R 53.7% · Other 1.6%
- 2008→2024 swing
- +6.0pp toward D · 2008: -14.9pp · 2024: -9.0pp
- All cycles
- 2024: R+9.0 2020: R+8.0 2016: R+16.8 2012: R+18.7 2008: R+14.9
Not yet ingested
- Civics
- —
Market trends
- HPI YoY
- ▼ -7.13%
- Current HPI
- 332.9423
- Rent YoY
- ▲ 6.81%
- Metro
- Huntsville, AL
- State GDP YoY
- ▲ 2.94%
- F500 in state
- 4
Industry mix (Fortune 500 HQ in AL)
| Industry | F500 HQs | Revenue |
|---|---|---|
| Financial Services | 1 | $8B |
|
||
| Healthcare | 1 | $5B |
|
||
Price history
+45.0% since first listed9 events — show timeline
- 2026-06-11 Price Changed $144,900 VMLS
- 2026-05-13 Listed $149,900 VMLS
- 2023-12-08 Sold (Public Records) $2,040,000 Public Records
- 2022-02-03 Sold (Public Records) $85,000 Public Records
- 2022-01-19 Sold (MLS) $85,000 VMLS
- 2021-07-24 Pending — VMLS
- 2021-07-09 Contingent — VMLS
- 2021-06-28 Price Changed $89,900 VMLS
- 2021-06-11 Listed $99,900 VMLS
Property tax history
+2.9%/yrLatest (2024): $551 · -46.4% YoY. Source: county tax records.
Cash-flow waterfall
monthlySold comps — $/sqft
last 12 mo · ≤1 miLoading sold comps…